| Param | Original file | Final file |
|---|---|---|
| Filename | modeM0/AS1T05_143T01_9000005834_42946cztM0_level2.fits | modeM0/AS1T05_143T01_9000005834_42946cztM0_level2_quad_clean.evt |
| Size (bytes) | 1,007,976,960 | 258,937,920 |
| Size | 961.3 MB | 246.9 MB |
| Events in quadrant A | 10,392,181 | 1,702,905 |
| Events in quadrant B | 7,291,686 | 1,789,504 |
| Events in quadrant C | 7,666,055 | 1,702,619 |
| Events in quadrant D | 10,702,226 | 1,522,104 |
| Mode SS | |||
|---|---|---|---|
| Quadrant | BADHDUFLAG | Total packets | Discarded packets |
| A | 0 | 336 | 0 |
| B | 0 | 336 | 0 |
| C | 0 | 336 | 0 |
| D | 0 | 336 | 0 |
| Mode M0 | |||
|---|---|---|---|
| Quadrant | BADHDUFLAG | Total packets | Discarded packets |
| A | 0 | 41024 | 4 |
| B | 0 | 33216 | 4 |
| C | 0 | 33151 | 4 |
| D | 0 | 43456 | 4 |
| Mode M9 | |||
|---|---|---|---|
| Quadrant | BADHDUFLAG | Total packets | Discarded packets |
| A | 0 | 53 | 0 |
| B | 0 | 53 | 0 |
| C | 0 | 53 | 0 |
| D | 0 | 53 | 0 |
| Quadrant | Total seconds | Saturated seconds | Saturation percentage |
|---|---|---|---|
| A | 16263 | 508 | 3.123655% |
| B | 16264 | 35 | 0.215199% |
| C | 16264 | 37 | 0.227496% |
| D | 16263 | 616 | 3.787739% |
Noise dominated data is calculated using 1-second bins in cleaned event files. If a bin has >2000 counts, and if more than 50% of those come from <1% of pixels, then it is considered to be noise-dominated and hence unusable.
| Quadrant | # 1 sec bins | Bins with >0 counts | Bins with >2000 counts | High rate bins dominated by noise | Noise dominated (total time) | Noise dominated (detector-on time) | Marked lightcurve |
|---|---|---|---|---|---|---|---|
| A | 21691 | 16265 | 354 | 354 | 1.63% | 2.18% | 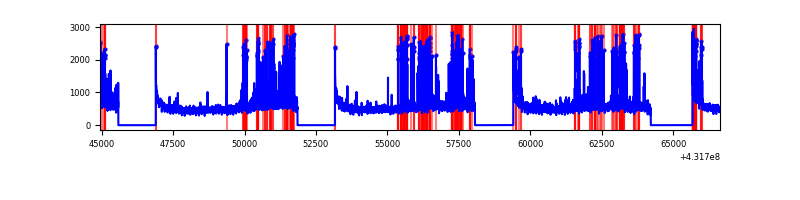 |
| B | 21692 | 16263 | 14 | 14 | 0.06% | 0.09% | 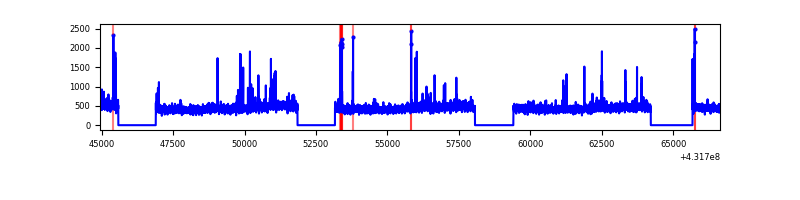 |
| C | 21692 | 16263 | 28 | 28 | 0.13% | 0.17% | 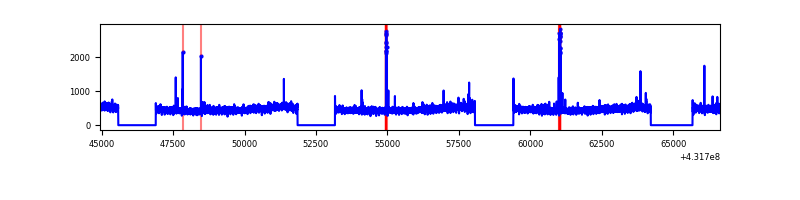 |
| D | 21691 | 16262 | 565 | 565 | 2.60% | 3.47% | 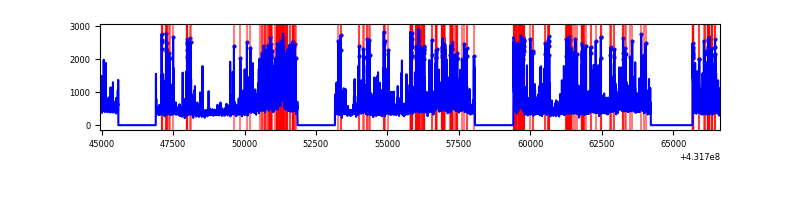 |
Top three noisy pixels from each quadrant. If the there are fewer than three noisy pixels in the level2.evt file, extra rows are filled as -1
| Pixel properties | Quadrant properties | ||||||
|---|---|---|---|---|---|---|---|
| Quadrant | DetID | PixID | Counts | Sigma | Mean | Median | Sigma |
| A | 10 | 83 | 1569105 | 4327.6 | 1763 | 1727 | 362.2 |
| A | 15 | 237 | 1511658 | 4168.98 | 1763 | 1727 | 362.2 |
| A | 15 | 222 | 371442 | 1020.8 | 1763 | 1727 | 362.2 |
| B | 3 | 112 | 57902 | 163.82 | 1780 | 1731 | 342.9 |
| B | 4 | 81 | 49664 | 139.8 | 1780 | 1731 | 342.9 |
| B | 12 | 111 | 44299 | 124.15 | 1780 | 1731 | 342.9 |
| C | 15 | 214 | 708220 | 1752.4 | 1742 | 1751 | 403.1 |
| C | 15 | 111 | 61403 | 147.97 | 1742 | 1751 | 403.1 |
| C | 12 | 2 | 59207 | 142.52 | 1742 | 1751 | 403.1 |
| D | 1 | 52 | 1163883 | 2786.26 | 1717 | 1668 | 417.1 |
| D | 2 | 249 | 777188 | 1859.21 | 1717 | 1668 | 417.1 |
| D | 10 | 118 | 586478 | 1402.01 | 1717 | 1668 | 417.1 |
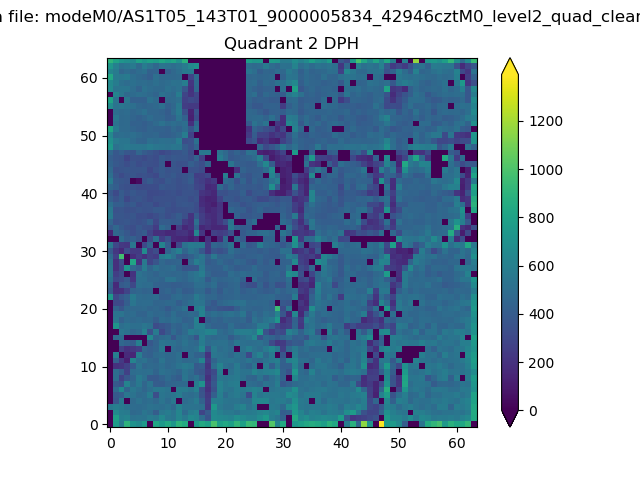
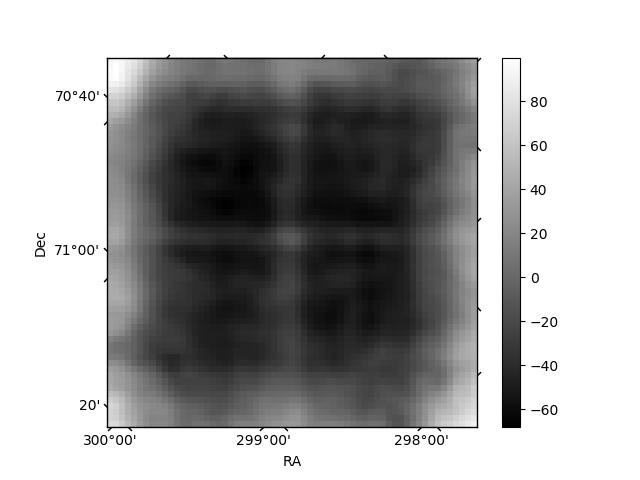
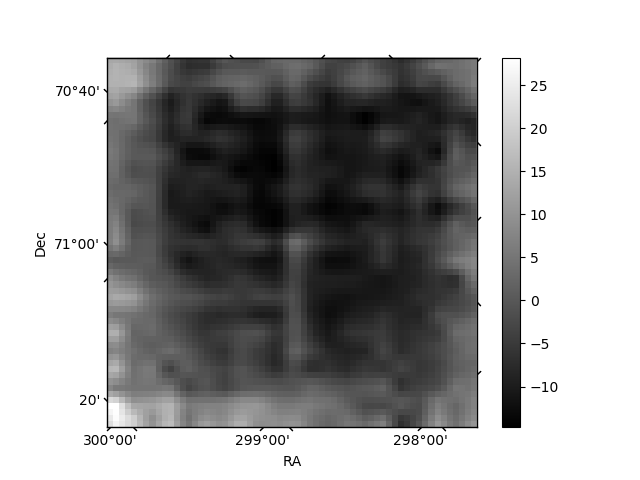
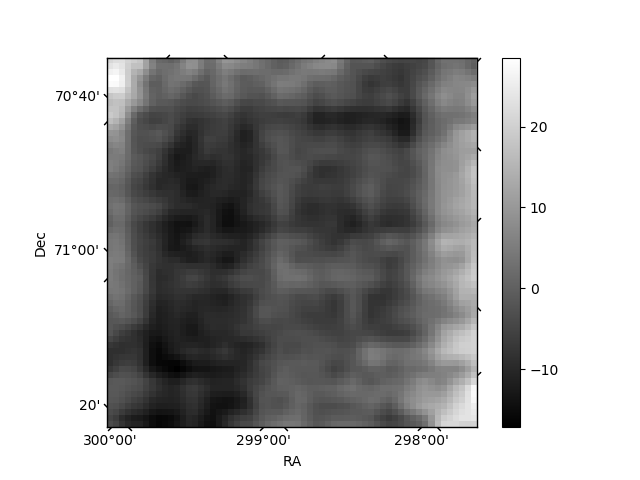
Histogram calculated using DETX and DETY for each event in the final _common_clean file
| Quadrant A | 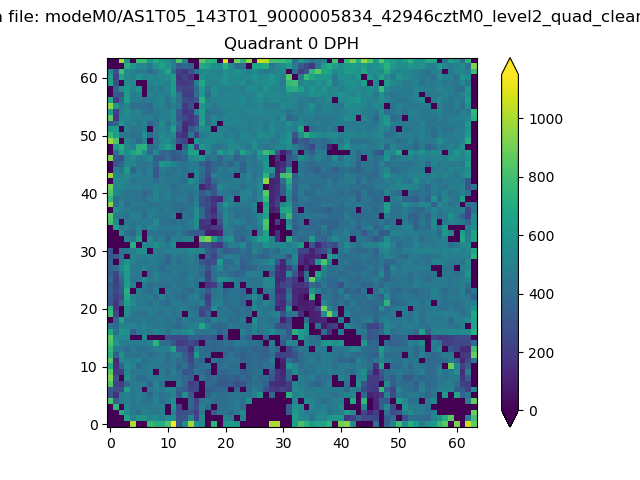 |
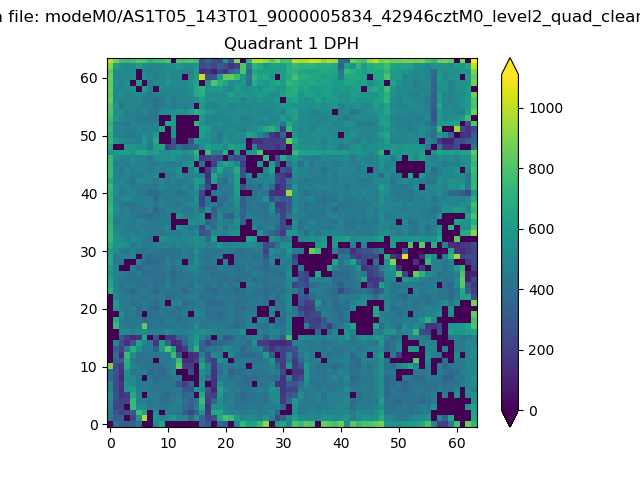 |
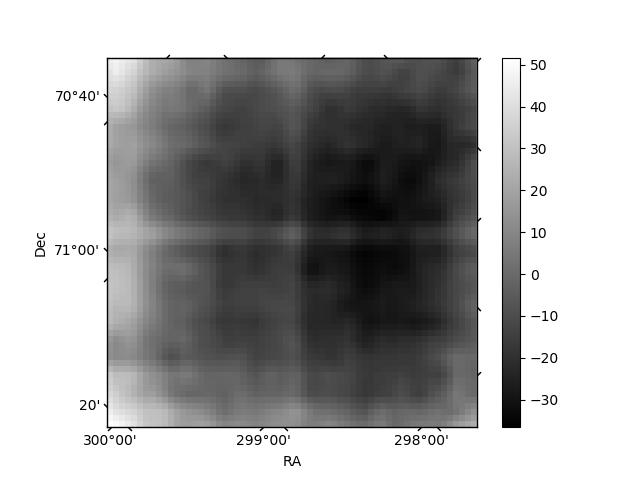
Quadrant B |
|---|---|---|---|
| Quadrant D | 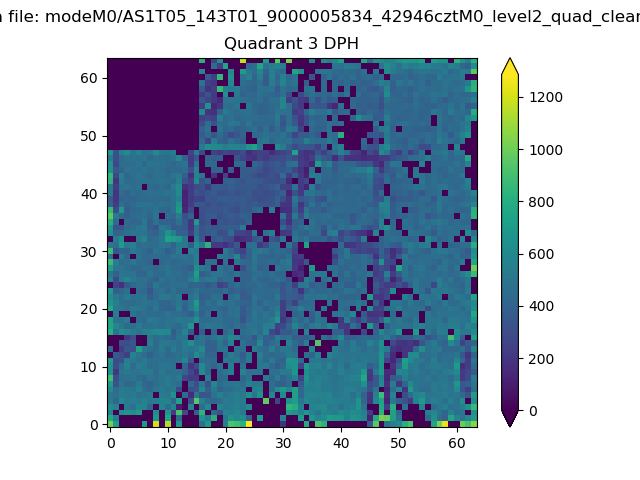 |
 |
Quadrant C |
| Plot type | Count rate plots | Images |
|---|---|---|
| Comparison with Poisson distribution Blue bars denote a histogram of data divided into 1 sec bins. Red curve is a Poisson curve with rate = median count rate of data. |
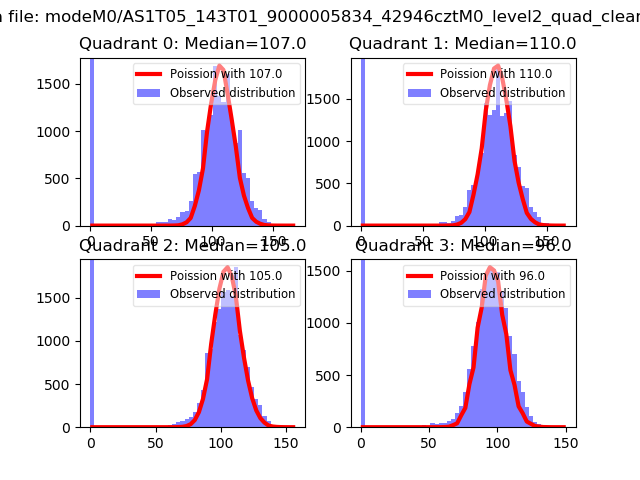 |
 |
| Quadrant-wise count rates Data is divided into 100 sec bins |
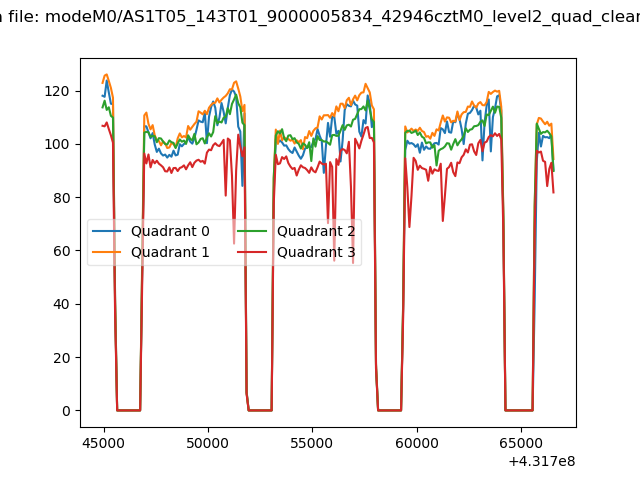 |
|
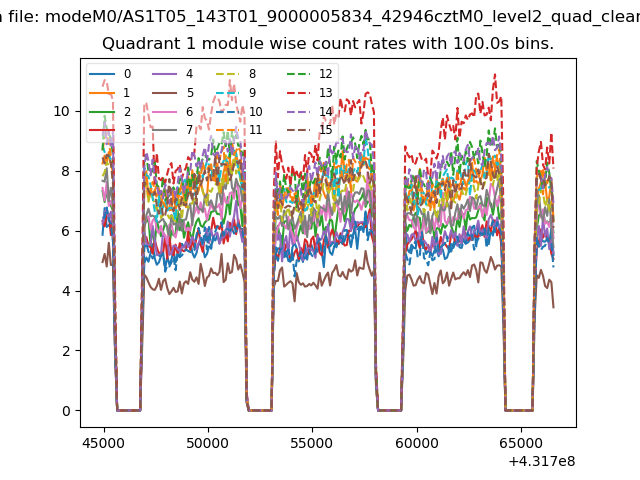
| Module-wise count rates for Quadrant A Data is divided into 100 sec bins |
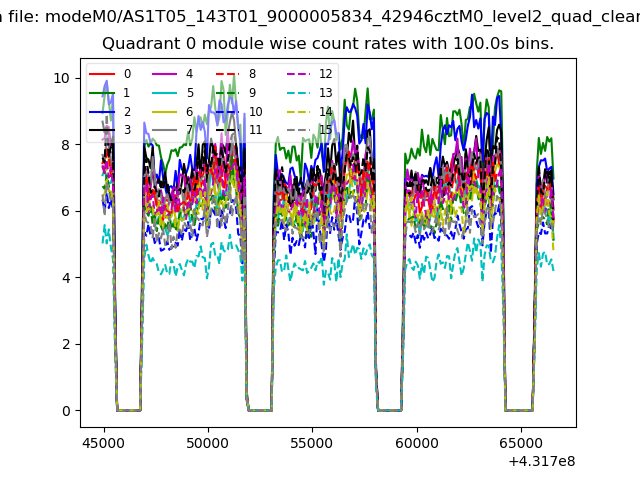 |
 |
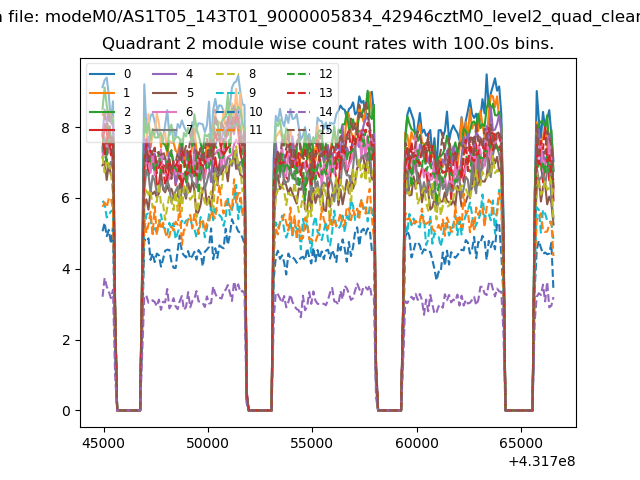
| Module-wise count rates for Quadrant B Data is divided into 100 sec bins |
 |
 |
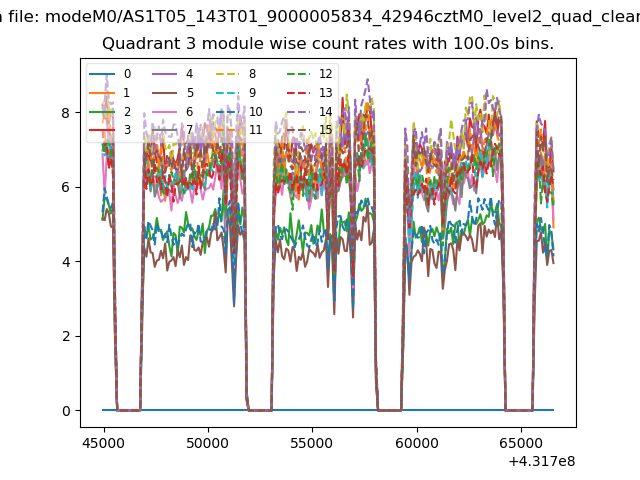
| Module-wise count rates for Quadrant C Data is divided into 100 sec bins |
 |
 |
| Module-wise count rates for Quadrant D Data is divided into 100 sec bins |
 |
 |
| Parameter | Plot |
|---|---|
| CZT HV Monitor | 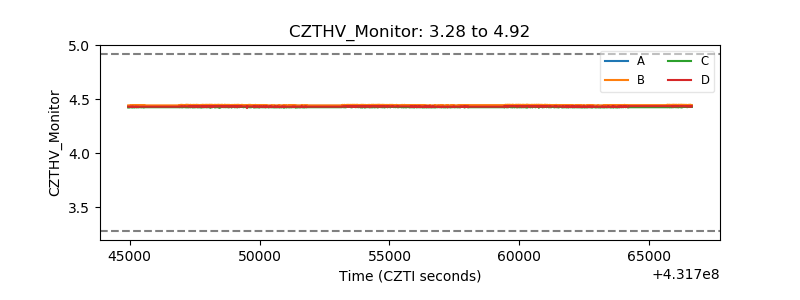 |
| D_VDD | 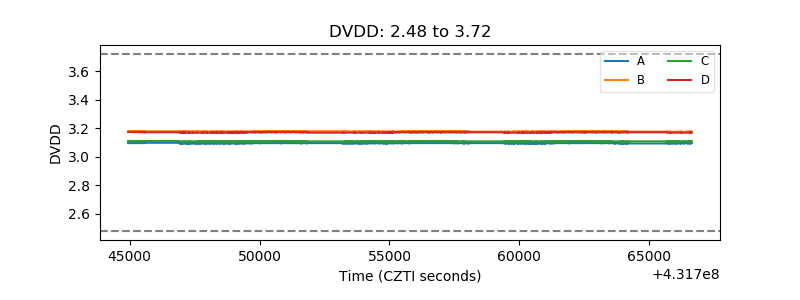 |
| Temperature 1 | 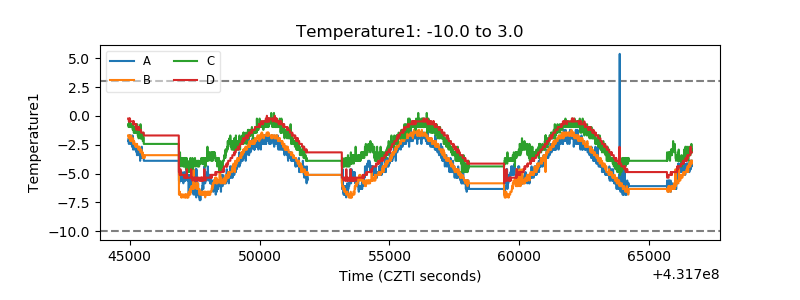 |
| Veto HV Monitor | 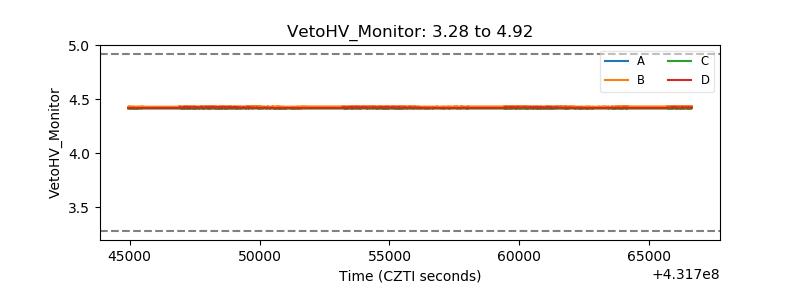 |
| Veto LLD | 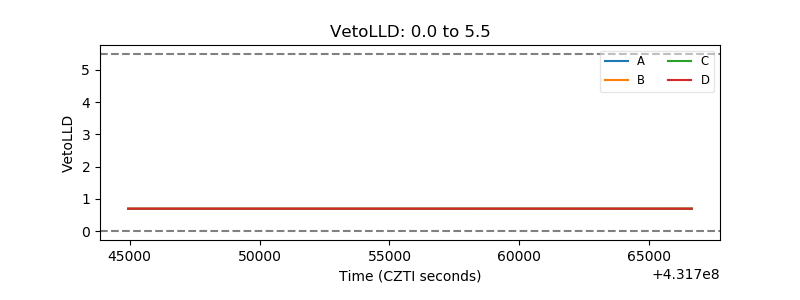 |
| Alpha Counter | 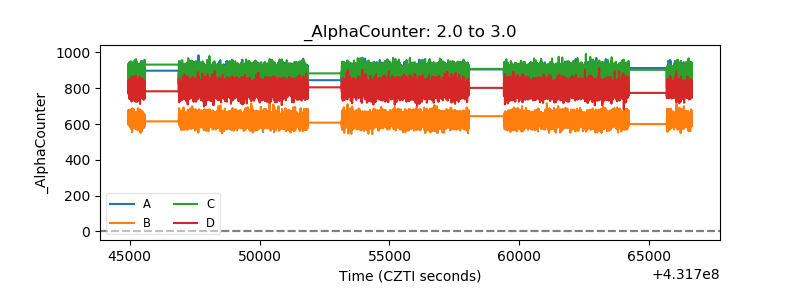 |
| _CPM_Rate | 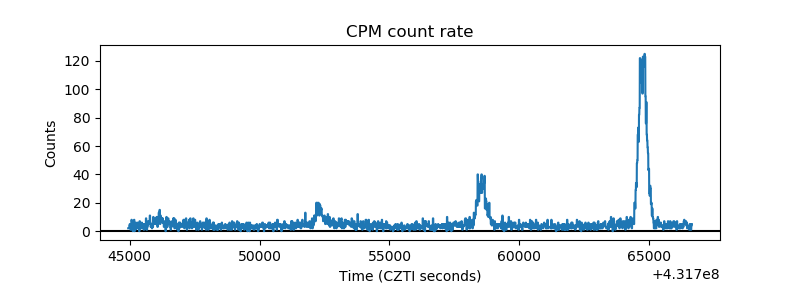 |
| CZT Counter | 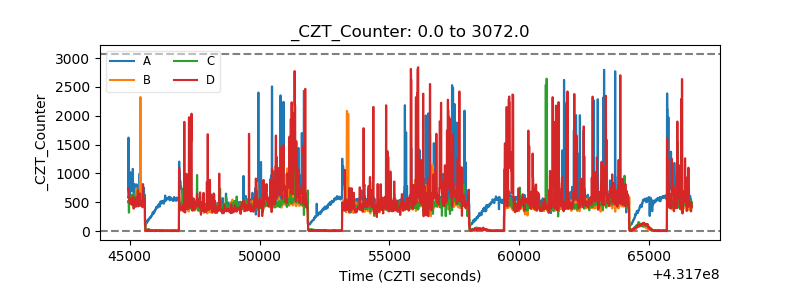 |
| +2.5 Volts monitor | 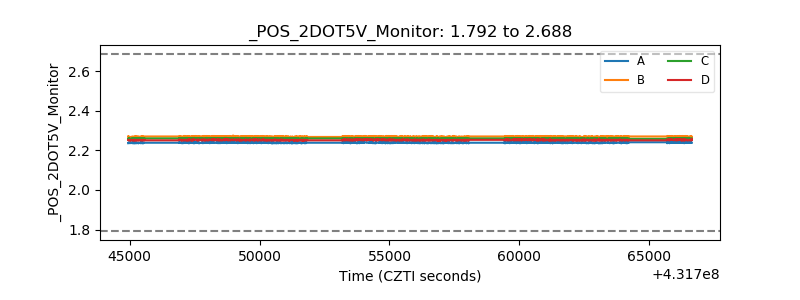 |
| +5 Volts monitor | 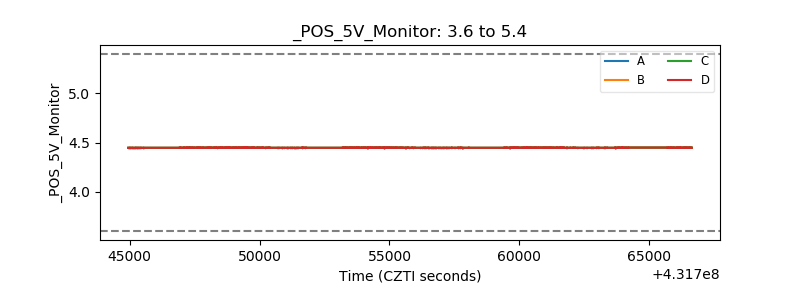 |
| _ROLL_ROT | 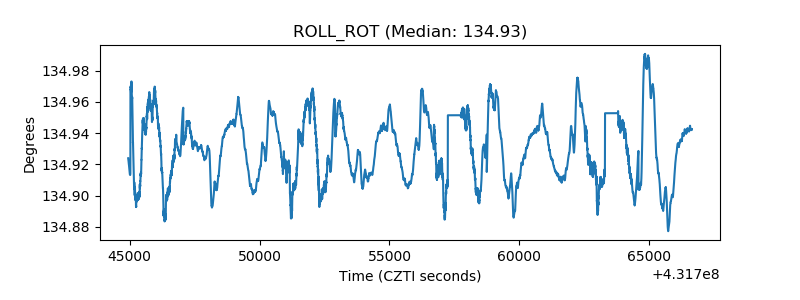 |
| _Roll_DEC |  |
| _Roll_RA | 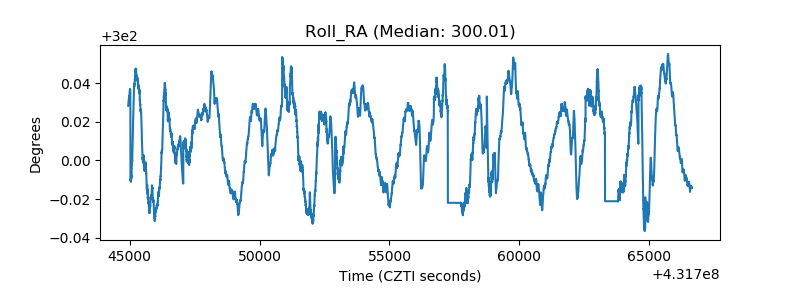 |
| Veto Counter | 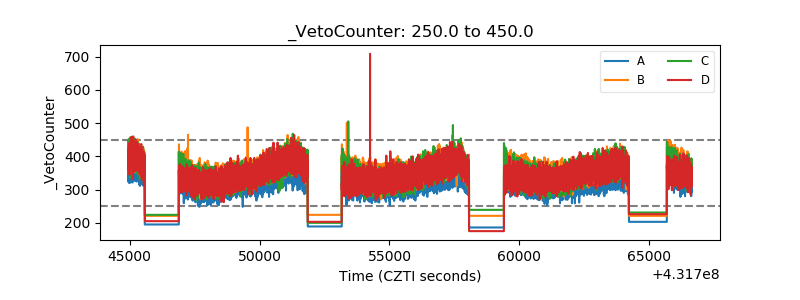 |