| Param | Original file | Final file |
|---|---|---|
| Filename | modeM0/AS1T05_143T01_9000005834_42947cztM0_level2.fits | modeM0/AS1T05_143T01_9000005834_42947cztM0_level2_quad_clean.evt |
| Size (bytes) | 401,832,000 | 98,737,920 |
| Size | 383.2 MB | 94.2 MB |
| Events in quadrant A | 3,901,697 | 659,213 |
| Events in quadrant B | 2,683,074 | 688,112 |
| Events in quadrant C | 2,927,161 | 646,514 |
| Events in quadrant D | 4,889,326 | 570,329 |
| Mode SS | |||
|---|---|---|---|
| Quadrant | BADHDUFLAG | Total packets | Discarded packets |
| A | 0 | 128 | 0 |
| B | 0 | 128 | 0 |
| C | 0 | 128 | 0 |
| D | 0 | 128 | 0 |
| Mode M0 | |||
|---|---|---|---|
| Quadrant | BADHDUFLAG | Total packets | Discarded packets |
| A | 0 | 15179 | 2 |
| B | 0 | 12265 | 2 |
| C | 0 | 12436 | 2 |
| D | 0 | 18683 | 2 |
| Mode M9 | |||
|---|---|---|---|
| Quadrant | BADHDUFLAG | Total packets | Discarded packets |
| A | 0 | 30 | 0 |
| B | 0 | 30 | 0 |
| C | 0 | 30 | 0 |
| D | 0 | 30 | 0 |
| Quadrant | Total seconds | Saturated seconds | Saturation percentage |
|---|---|---|---|
| A | 6083 | 158 | 2.597403% |
| B | 6084 | 10 | 0.164366% |
| C | 6084 | 4 | 0.065746% |
| D | 6084 | 360 | 5.917160% |
Noise dominated data is calculated using 1-second bins in cleaned event files. If a bin has >2000 counts, and if more than 50% of those come from <1% of pixels, then it is considered to be noise-dominated and hence unusable.
| Quadrant | # 1 sec bins | Bins with >0 counts | Bins with >2000 counts | High rate bins dominated by noise | Noise dominated (total time) | Noise dominated (detector-on time) | Marked lightcurve |
|---|---|---|---|---|---|---|---|
| A | 9126 | 6085 | 134 | 134 | 1.47% | 2.20% | 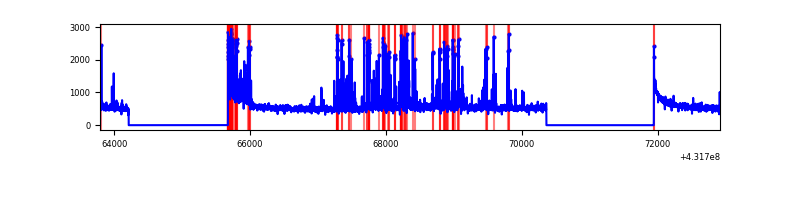 |
| B | 9127 | 6084 | 2 | 2 | 0.02% | 0.03% | 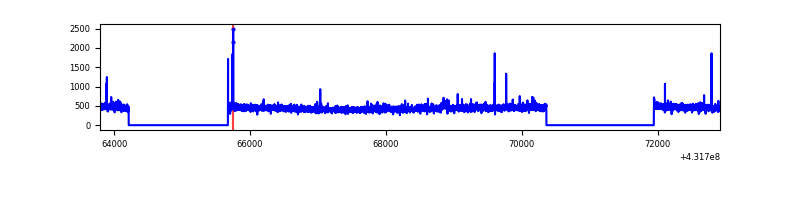 |
| C | 9127 | 6084 | 4 | 4 | 0.04% | 0.07% | 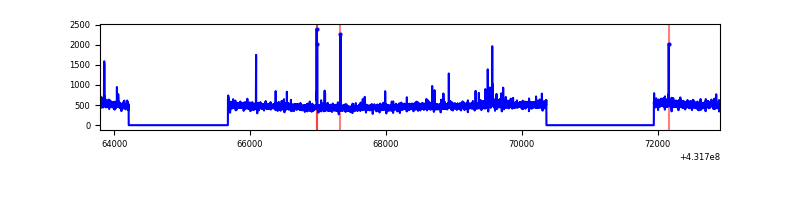 |
| D | 9127 | 6084 | 372 | 372 | 4.08% | 6.11% | 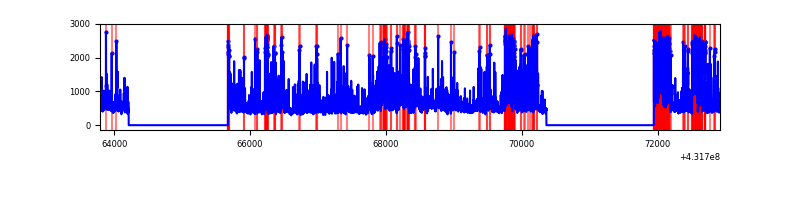 |
Top three noisy pixels from each quadrant. If the there are fewer than three noisy pixels in the level2.evt file, extra rows are filled as -1
| Pixel properties | Quadrant properties | ||||||
|---|---|---|---|---|---|---|---|
| Quadrant | DetID | PixID | Counts | Sigma | Mean | Median | Sigma |
| A | 10 | 83 | 618376 | 4497.97 | 664 | 650 | 137.3 |
| A | 15 | 237 | 586485 | 4265.76 | 664 | 650 | 137.3 |
| A | 15 | 222 | 111026 | 803.7 | 664 | 650 | 137.3 |
| B | 12 | 111 | 16590 | 123.73 | 669 | 650 | 128.8 |
| B | 3 | 112 | 15624 | 116.23 | 669 | 650 | 128.8 |
| B | 11 | 111 | 15307 | 113.77 | 669 | 650 | 128.8 |
| C | 15 | 214 | 268324 | 1759.46 | 653 | 658 | 152.1 |
| C | 0 | 207 | 54842 | 356.17 | 653 | 658 | 152.1 |
| C | 14 | 254 | 28367 | 182.14 | 653 | 658 | 152.1 |
| D | 12 | 217 | 652115 | 4171.23 | 640 | 619 | 156.2 |
| D | 1 | 47 | 511628 | 3271.75 | 640 | 619 | 156.2 |
| D | 1 | 52 | 472770 | 3022.96 | 640 | 619 | 156.2 |
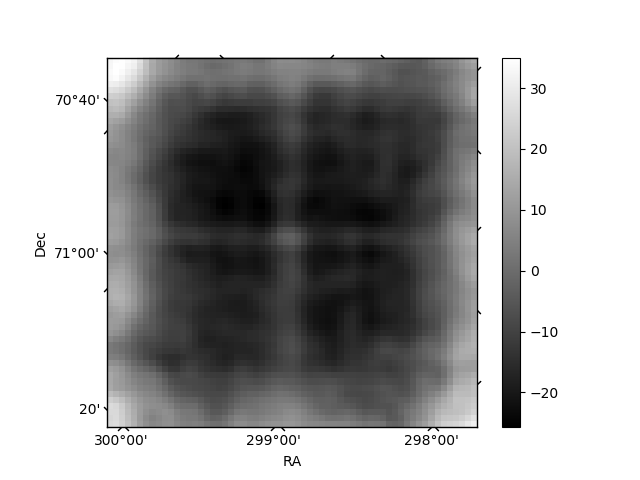
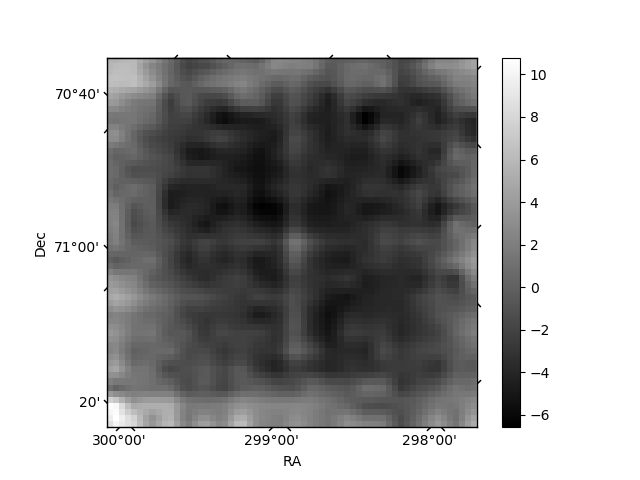
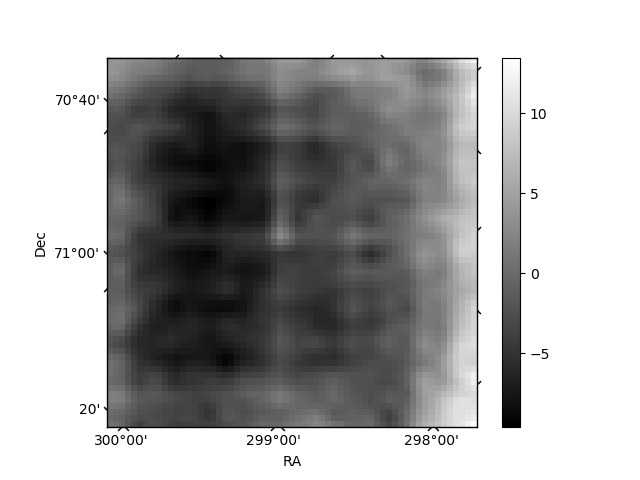
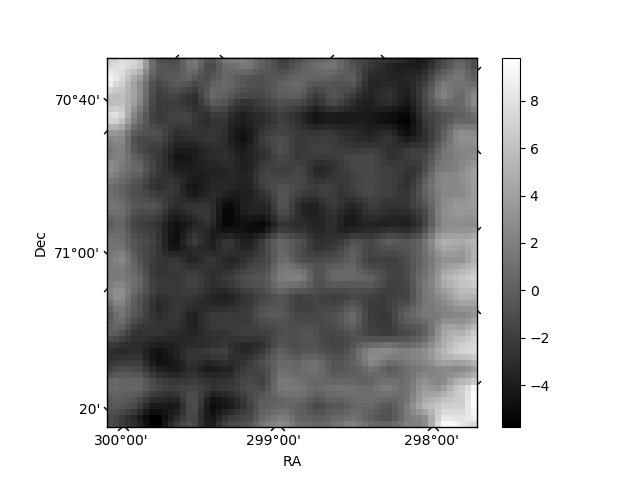
Histogram calculated using DETX and DETY for each event in the final _common_clean file
| Quadrant A | 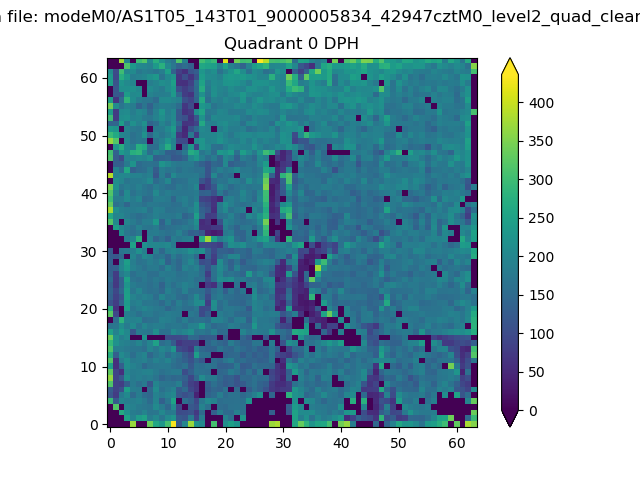 |
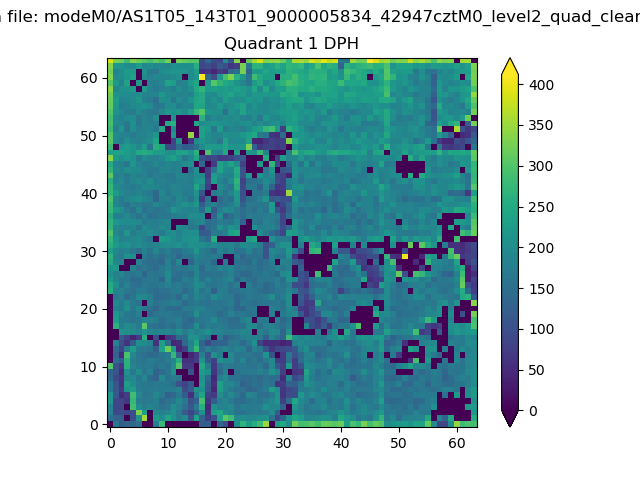 |
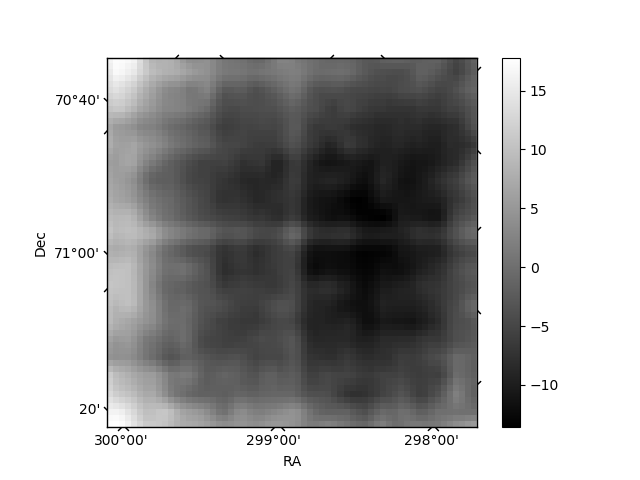
Quadrant B |
|---|---|---|---|
| Quadrant D | 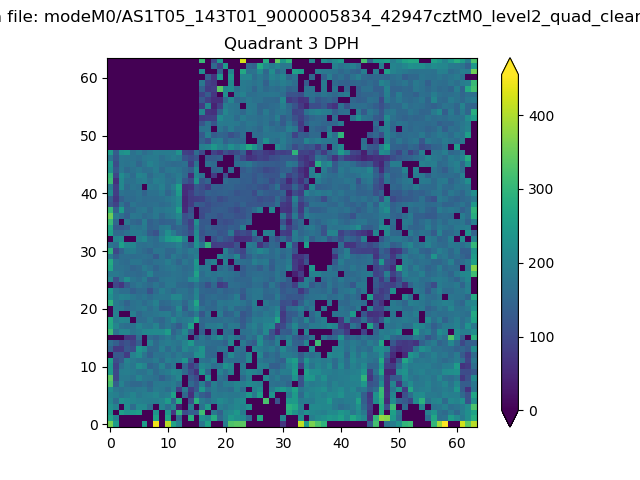 |
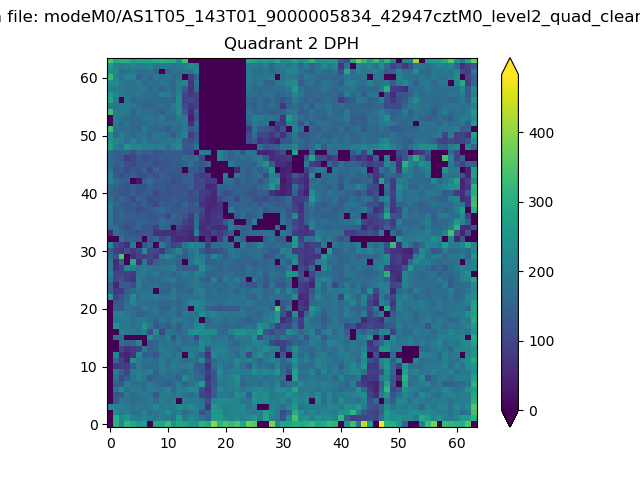 |
Quadrant C |
| Plot type | Count rate plots | Images |
|---|---|---|
| Comparison with Poisson distribution Blue bars denote a histogram of data divided into 1 sec bins. Red curve is a Poisson curve with rate = median count rate of data. |
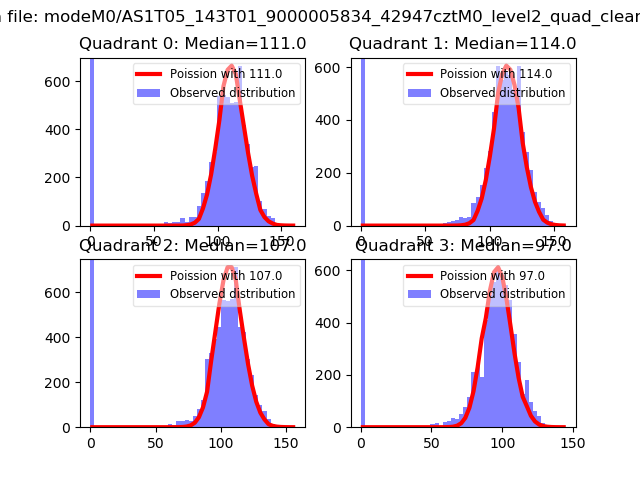 |
 |
| Quadrant-wise count rates Data is divided into 100 sec bins |
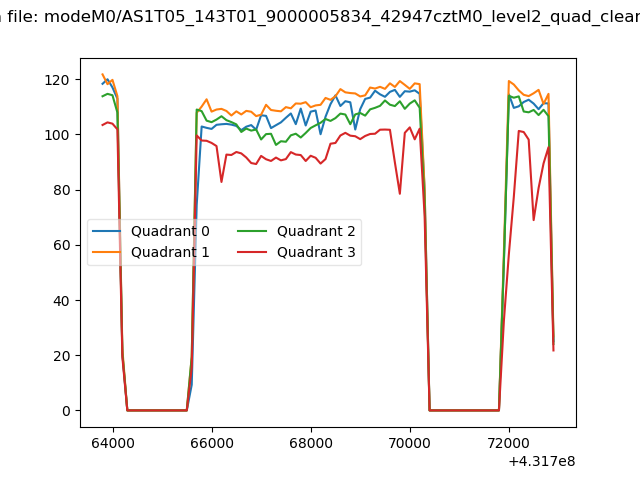 |
|
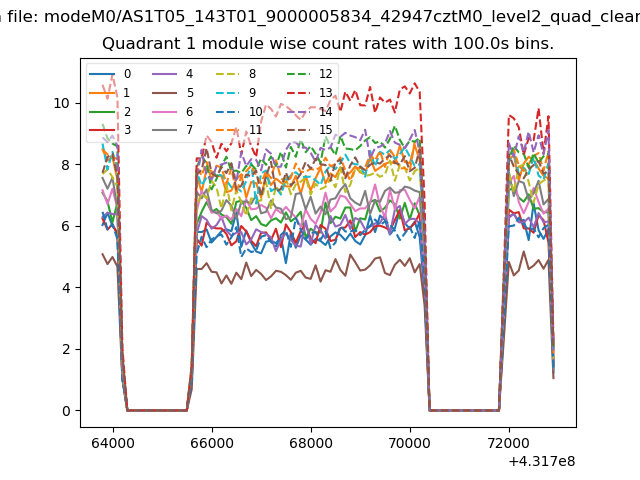
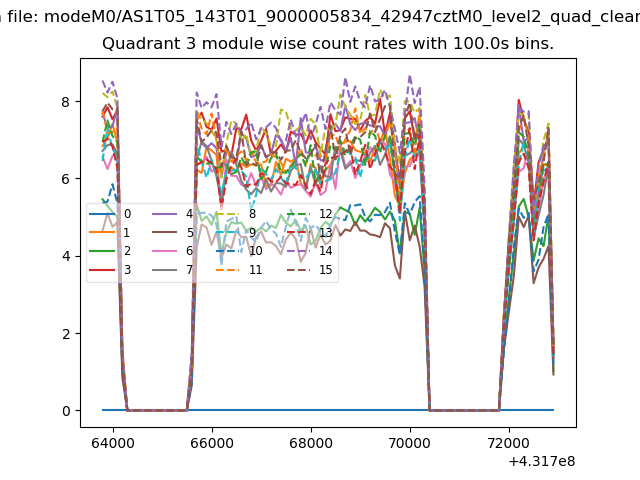
| Module-wise count rates for Quadrant A Data is divided into 100 sec bins |
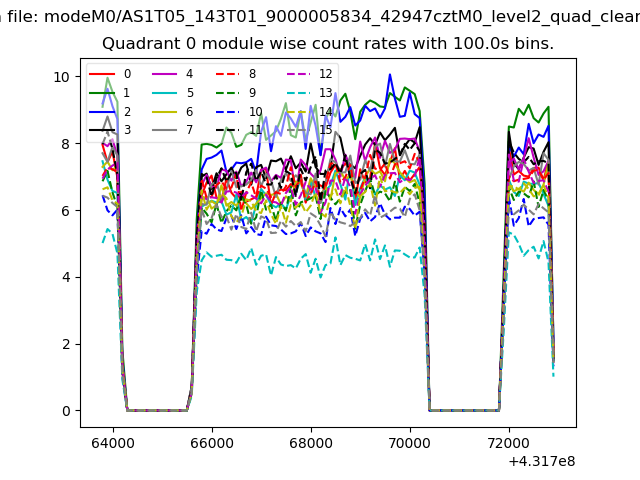 |
 |
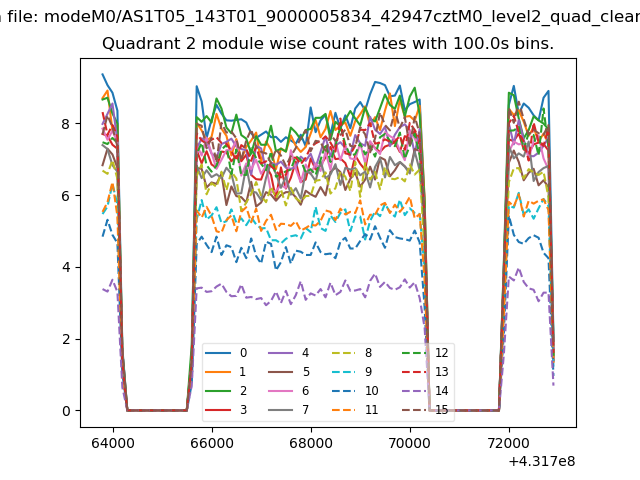
| Module-wise count rates for Quadrant B Data is divided into 100 sec bins |
 |
 |
| Module-wise count rates for Quadrant C Data is divided into 100 sec bins |
 |
 |
| Module-wise count rates for Quadrant D Data is divided into 100 sec bins |
 |
 |
| Parameter | Plot |
|---|---|
| CZT HV Monitor |  |
| D_VDD | 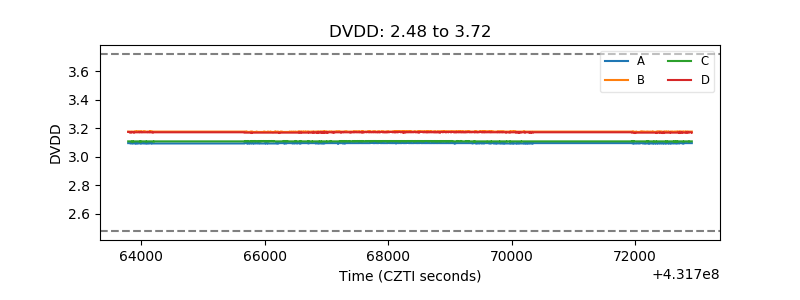 |
| Temperature 1 | 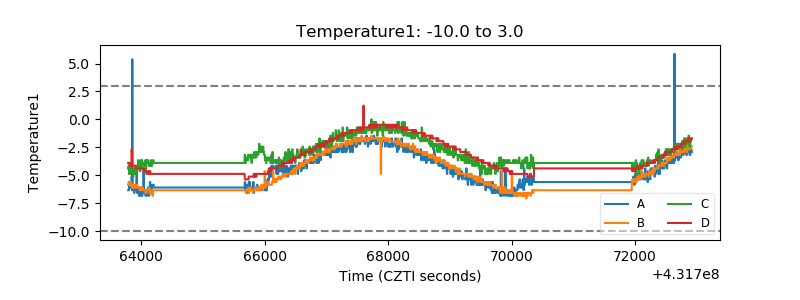 |
| Veto HV Monitor | 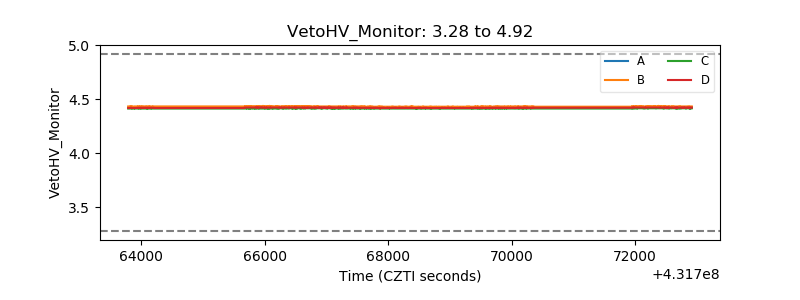 |
| Veto LLD | 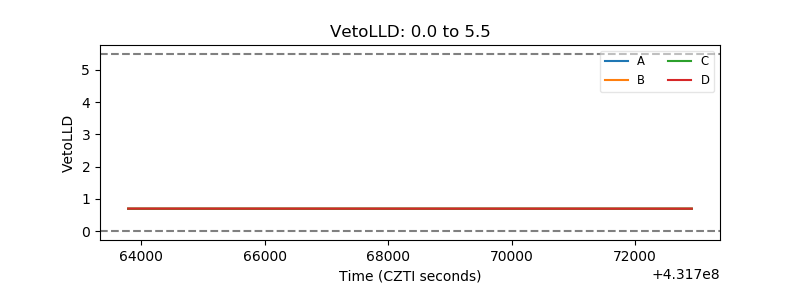 |
| Alpha Counter | 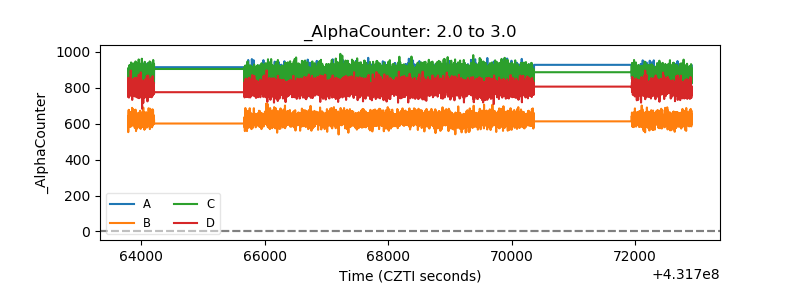 |
| _CPM_Rate | 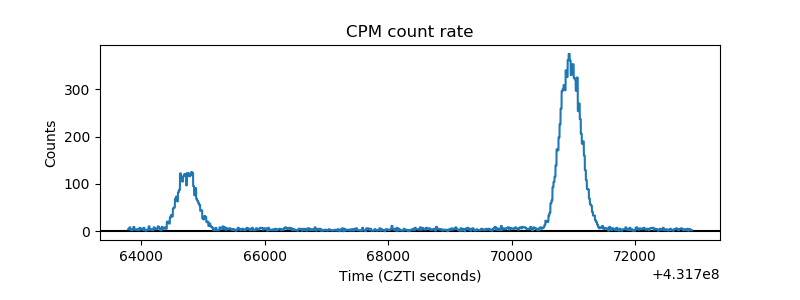 |
| CZT Counter | 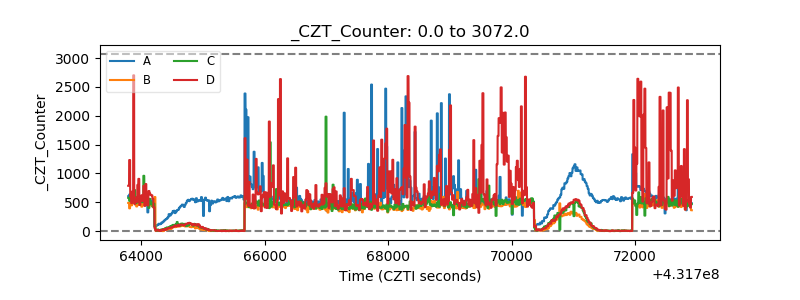 |
| +2.5 Volts monitor |  |
| +5 Volts monitor | 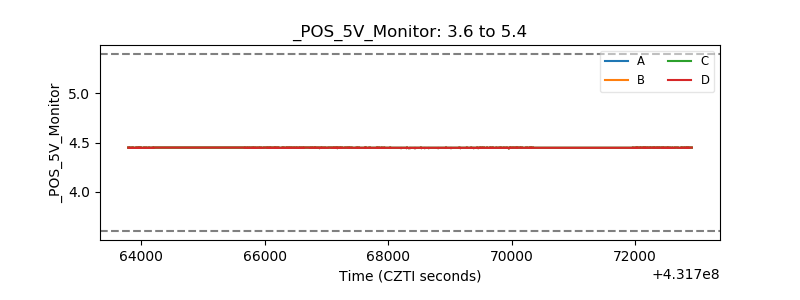 |
| _ROLL_ROT | 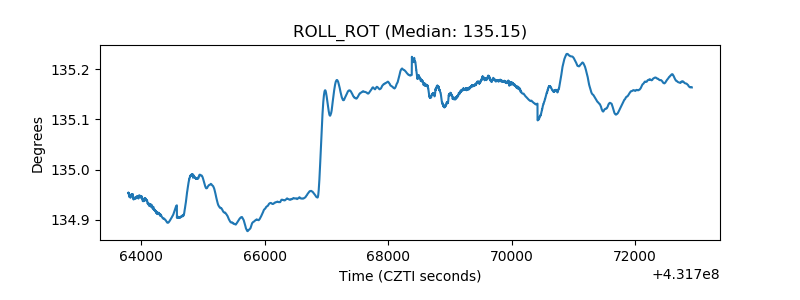 |
| _Roll_DEC |  |
| _Roll_RA | 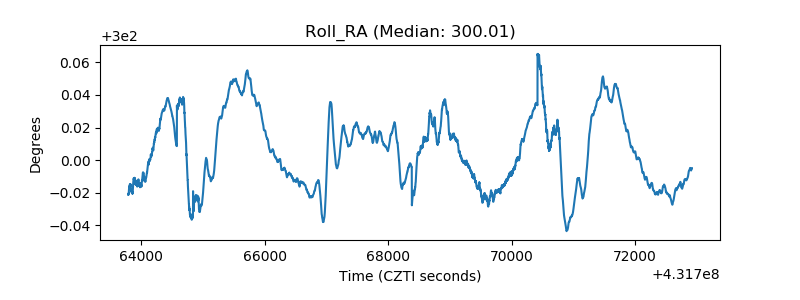 |
| Veto Counter | 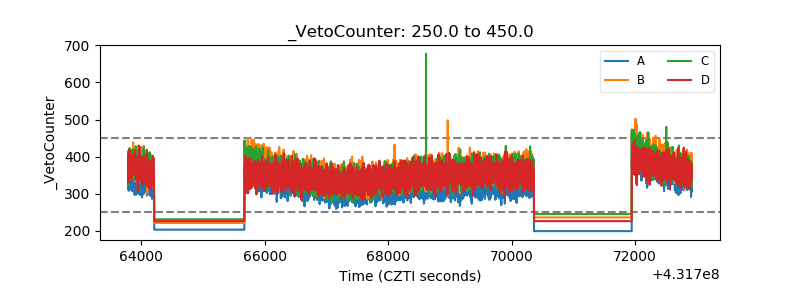 |