| Param | Original file | Final file |
|---|---|---|
| Filename | modeM0/AS1T05_143T01_9000005834_42948cztM0_level2.fits | modeM0/AS1T05_143T01_9000005834_42948cztM0_level2_quad_clean.evt |
| Size (bytes) | 370,189,440 | 97,963,200 |
| Size | 353.0 MB | 93.4 MB |
| Events in quadrant A | 3,583,391 | 660,614 |
| Events in quadrant B | 2,603,381 | 688,068 |
| Events in quadrant C | 2,788,941 | 637,870 |
| Events in quadrant D | 4,269,243 | 568,857 |
| Mode SS | |||
|---|---|---|---|
| Quadrant | BADHDUFLAG | Total packets | Discarded packets |
| A | 0 | 120 | 0 |
| B | 0 | 120 | 0 |
| C | 0 | 120 | 0 |
| D | 0 | 120 | 0 |
| Mode M0 | |||
|---|---|---|---|
| Quadrant | BADHDUFLAG | Total packets | Discarded packets |
| A | 0 | 14134 | 2 |
| B | 0 | 11854 | 2 |
| C | 0 | 11938 | 2 |
| D | 0 | 16740 | 2 |
| Mode M9 | |||
|---|---|---|---|
| Quadrant | BADHDUFLAG | Total packets | Discarded packets |
| A | 0 | 34 | 0 |
| B | 0 | 34 | 0 |
| C | 0 | 34 | 0 |
| D | 0 | 34 | 0 |
| Quadrant | Total seconds | Saturated seconds | Saturation percentage |
|---|---|---|---|
| A | 5885 | 138 | 2.344945% |
| B | 5886 | 7 | 0.118926% |
| C | 5885 | 4 | 0.067969% |
| D | 5885 | 294 | 4.995752% |
Noise dominated data is calculated using 1-second bins in cleaned event files. If a bin has >2000 counts, and if more than 50% of those come from <1% of pixels, then it is considered to be noise-dominated and hence unusable.
| Quadrant | # 1 sec bins | Bins with >0 counts | Bins with >2000 counts | High rate bins dominated by noise | Noise dominated (total time) | Noise dominated (detector-on time) | Marked lightcurve |
|---|---|---|---|---|---|---|---|
| A | 9200 | 5886 | 101 | 101 | 1.10% | 1.72% | 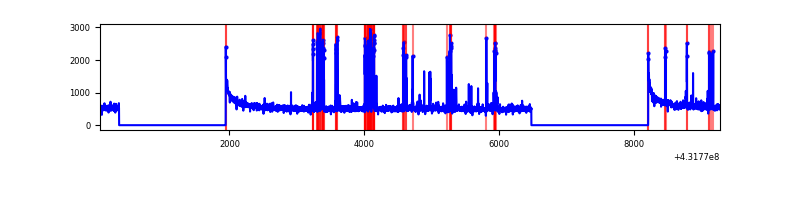 |
| B | 9202 | 5886 | 2 | 2 | 0.02% | 0.03% |  |
| C | 9201 | 5885 | 1 | 1 | 0.01% | 0.02% |  |
| D | 9201 | 5885 | 278 | 278 | 3.02% | 4.72% | 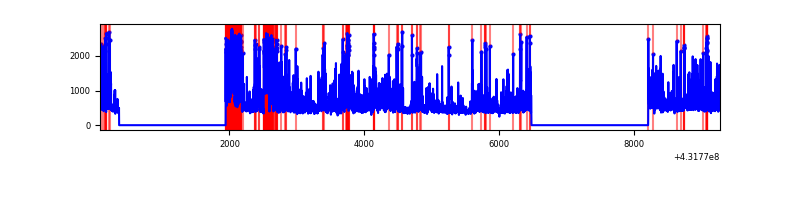 |
Top three noisy pixels from each quadrant. If the there are fewer than three noisy pixels in the level2.evt file, extra rows are filled as -1
| Pixel properties | Quadrant properties | ||||||
|---|---|---|---|---|---|---|---|
| Quadrant | DetID | PixID | Counts | Sigma | Mean | Median | Sigma |
| A | 10 | 83 | 620712 | 4608.67 | 653 | 640 | 134.5 |
| A | 15 | 237 | 396287 | 2940.64 | 653 | 640 | 134.5 |
| A | 15 | 222 | 19246 | 138.29 | 653 | 640 | 134.5 |
| B | 12 | 111 | 15627 | 117.51 | 653 | 635 | 127.6 |
| B | 15 | 85 | 15451 | 116.13 | 653 | 635 | 127.6 |
| B | 11 | 111 | 14774 | 110.83 | 653 | 635 | 127.6 |
| C | 15 | 214 | 244606 | 1630.88 | 634 | 637 | 149.6 |
| C | 0 | 207 | 43804 | 288.56 | 634 | 637 | 149.6 |
| C | 14 | 254 | 10119 | 63.39 | 634 | 637 | 149.6 |
| D | 1 | 47 | 553275 | 3621.66 | 625 | 607 | 152.6 |
| D | 1 | 52 | 461642 | 3021.18 | 625 | 607 | 152.6 |
| D | 13 | 249 | 222555 | 1454.44 | 625 | 607 | 152.6 |
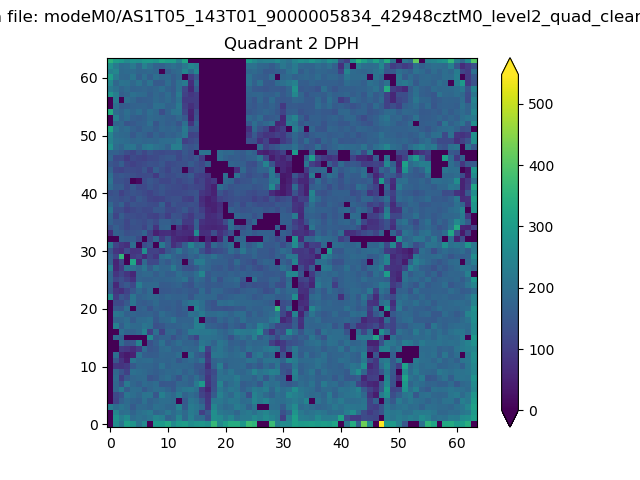
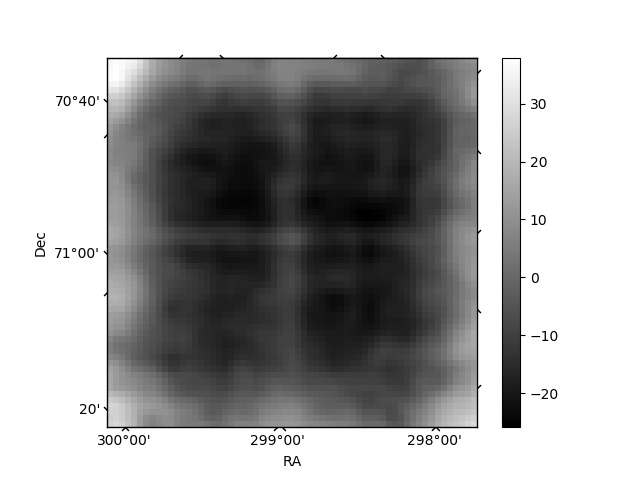
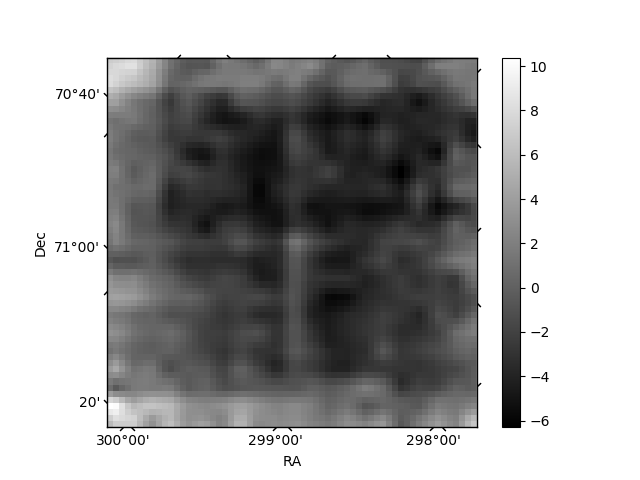
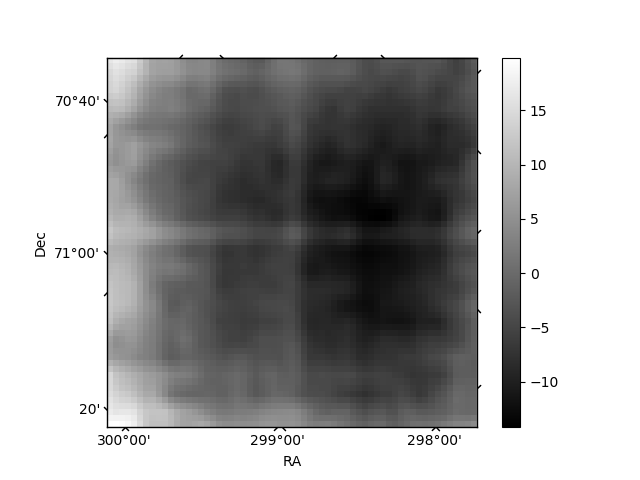
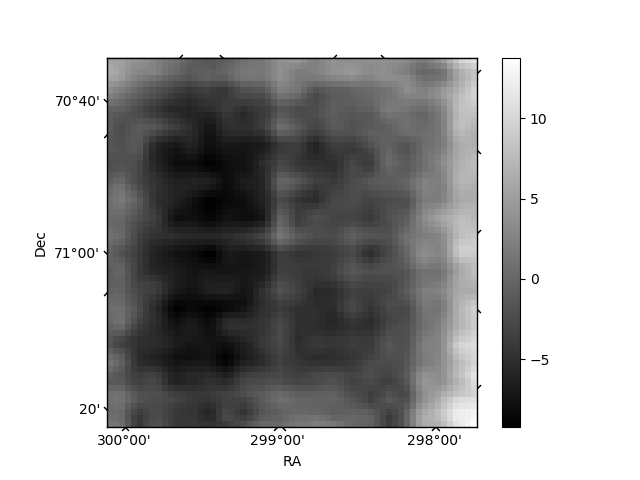
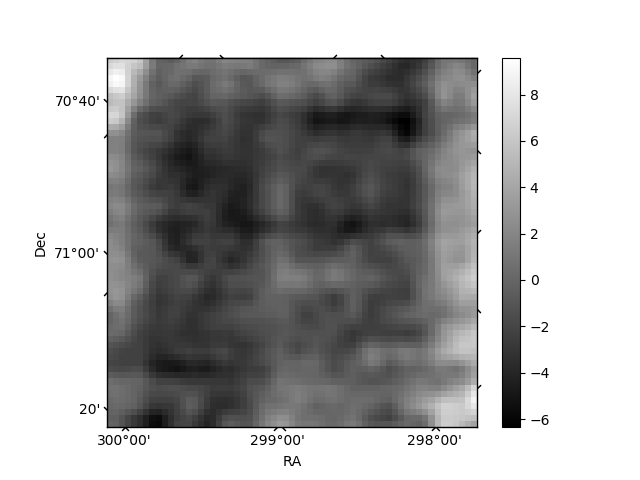
Histogram calculated using DETX and DETY for each event in the final _common_clean file
| Quadrant A | 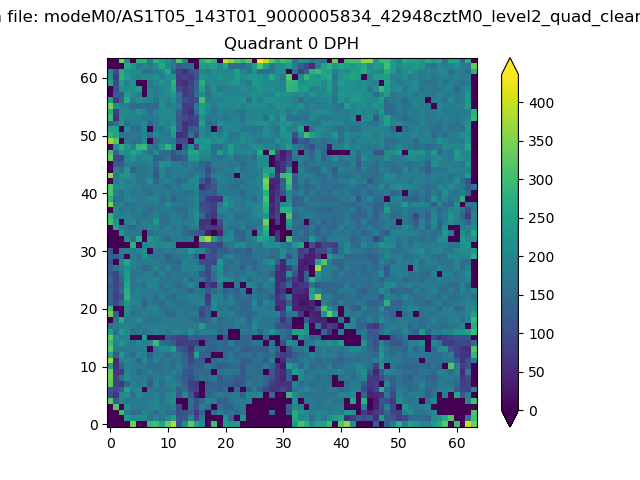 |
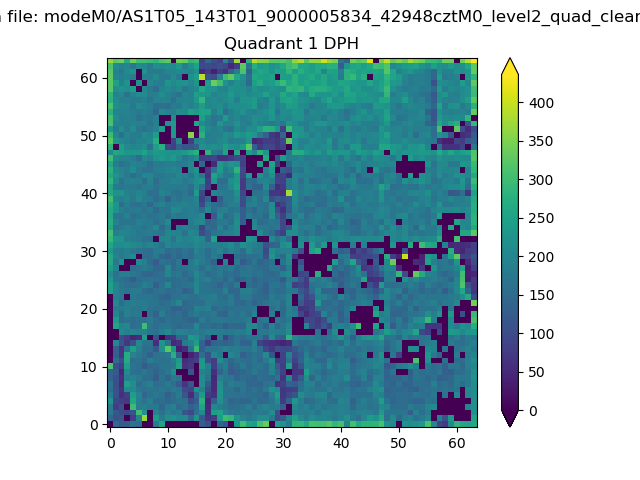 |
Quadrant B |
|---|---|---|---|
| Quadrant D | 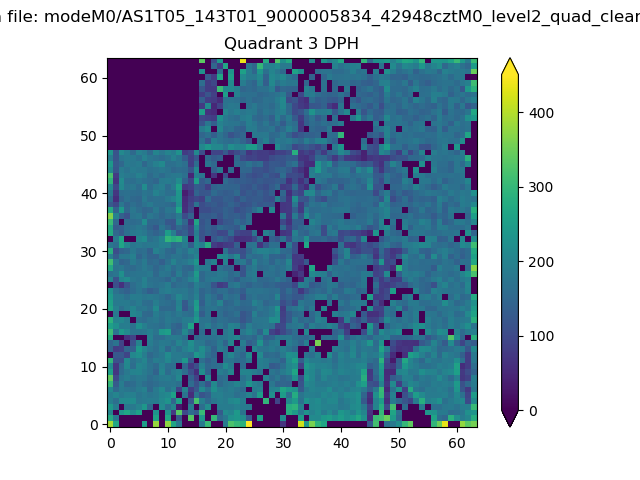 |
 |
Quadrant C |
| Plot type | Count rate plots | Images |
|---|---|---|
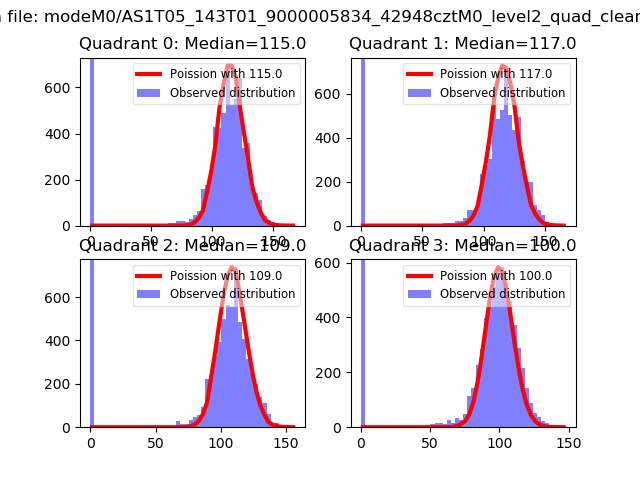
| Comparison with Poisson distribution Blue bars denote a histogram of data divided into 1 sec bins. Red curve is a Poisson curve with rate = median count rate of data. |
 |
 |
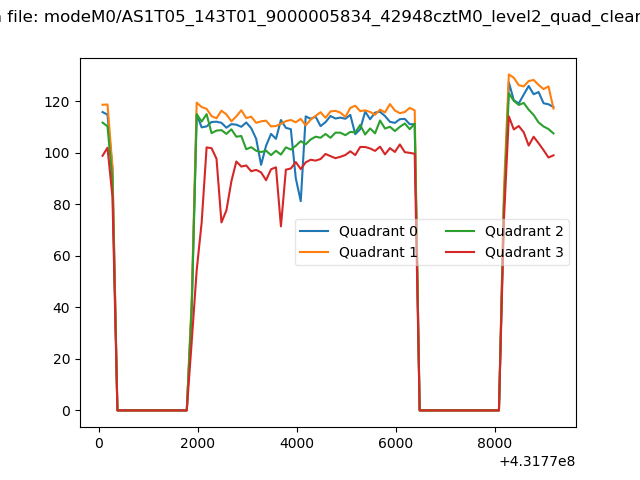
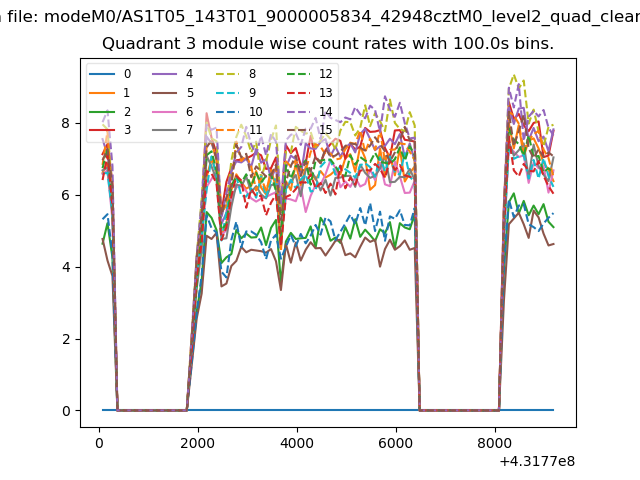
| Quadrant-wise count rates Data is divided into 100 sec bins |
 |
|
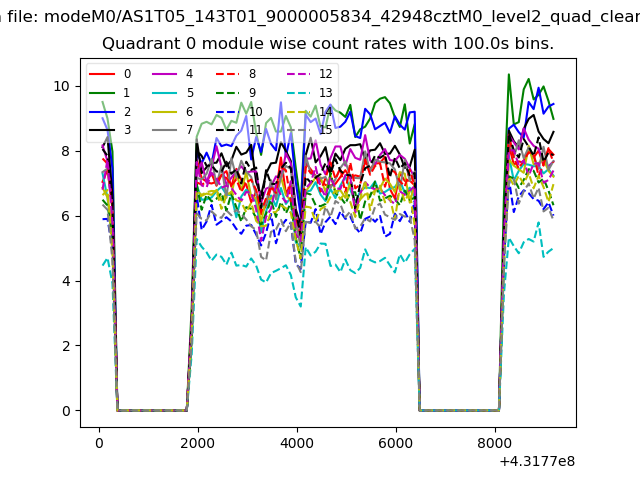
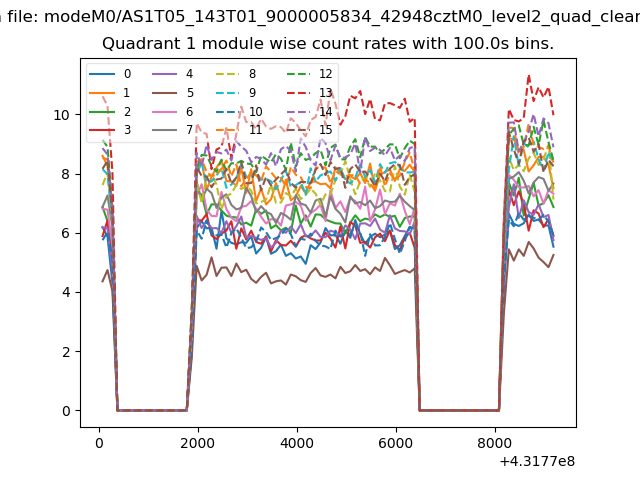
| Module-wise count rates for Quadrant A Data is divided into 100 sec bins |
 |
 |
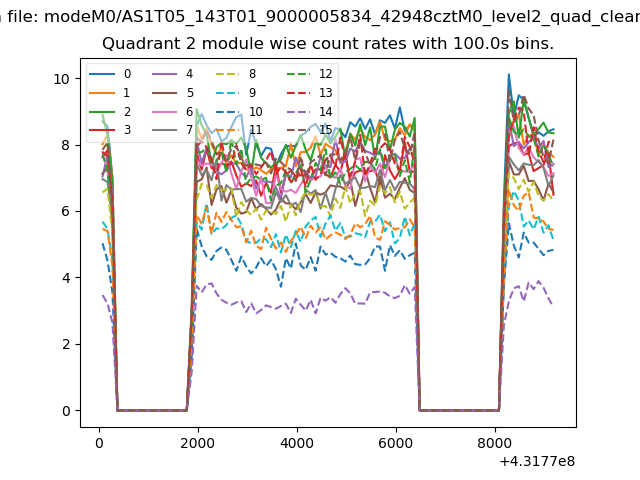
| Module-wise count rates for Quadrant B Data is divided into 100 sec bins |
 |
 |
| Module-wise count rates for Quadrant C Data is divided into 100 sec bins |
 |
 |
| Module-wise count rates for Quadrant D Data is divided into 100 sec bins |
 |
 |
| Parameter | Plot |
|---|---|
| CZT HV Monitor | 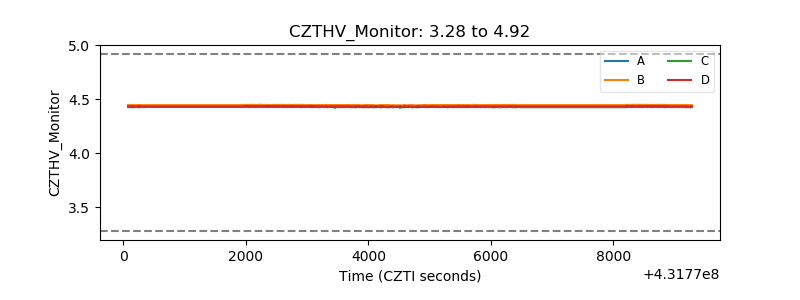 |
| D_VDD | 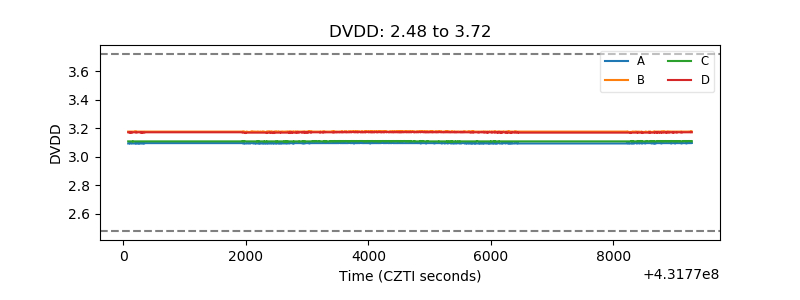 |
| Temperature 1 | 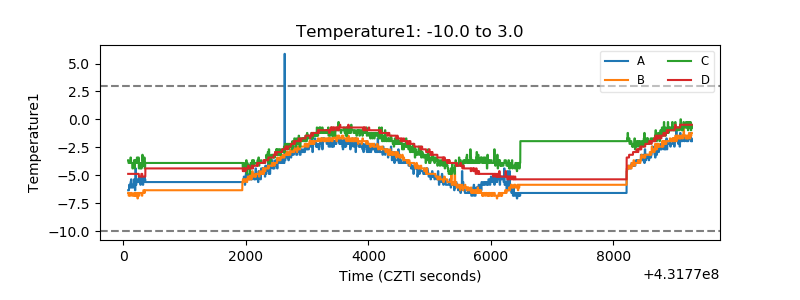 |
| Veto HV Monitor | 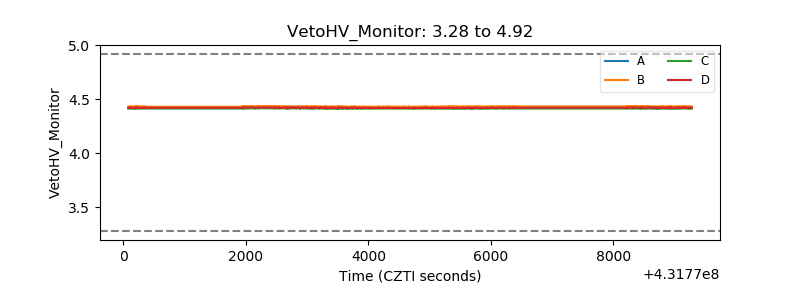 |
| Veto LLD | 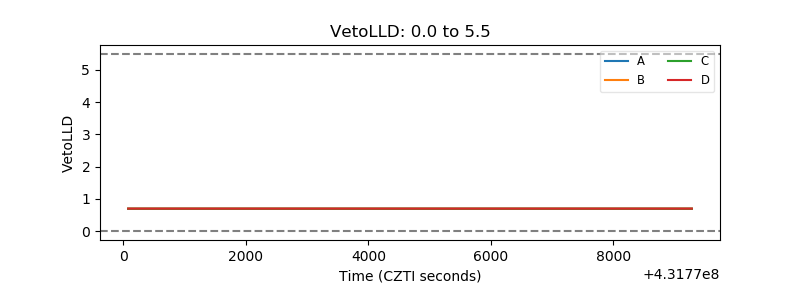 |
| Alpha Counter | 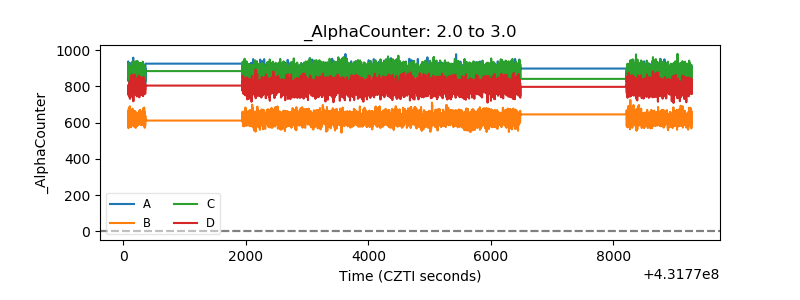 |
| _CPM_Rate | 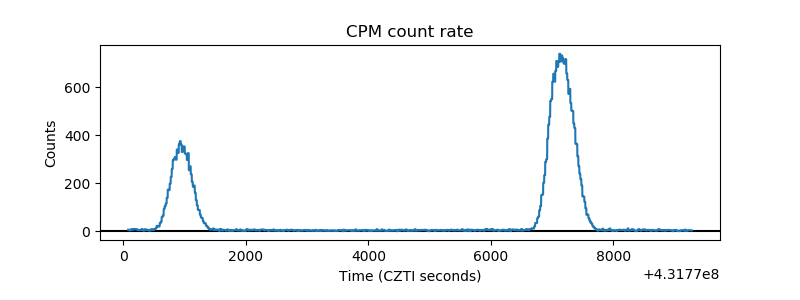 |
| CZT Counter | 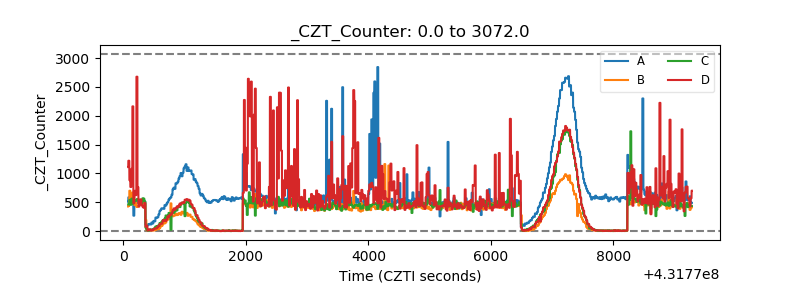 |
| +2.5 Volts monitor | 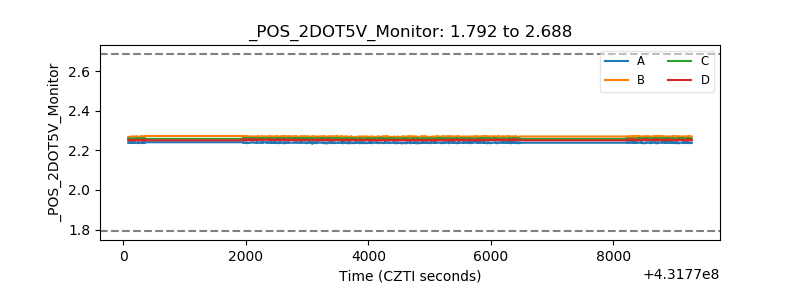 |
| +5 Volts monitor | 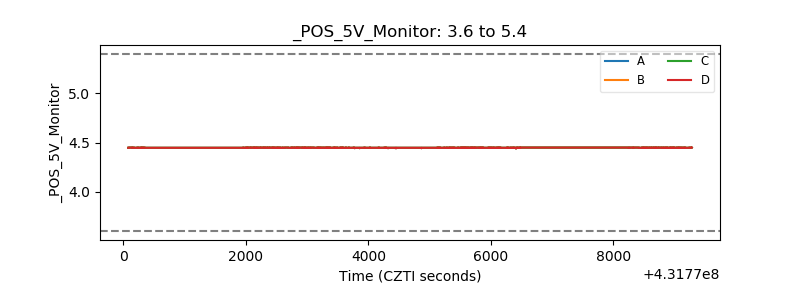 |
| _ROLL_ROT | 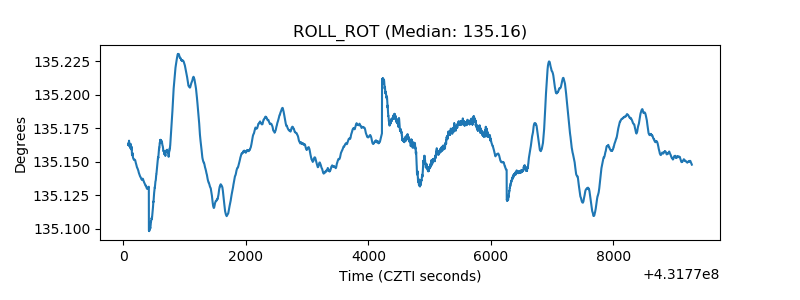 |
| _Roll_DEC | 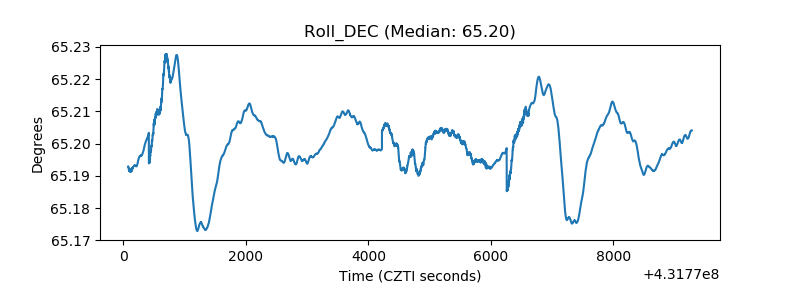 |
| _Roll_RA | 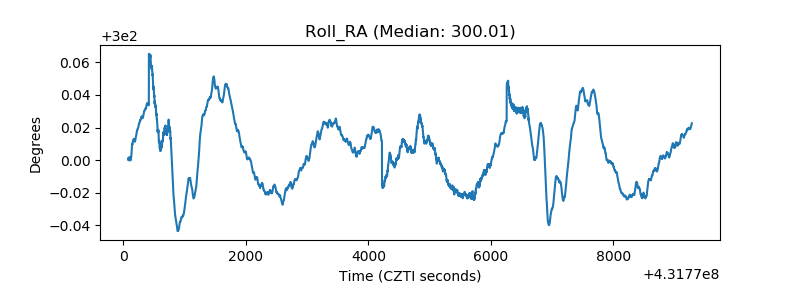 |
| Veto Counter | 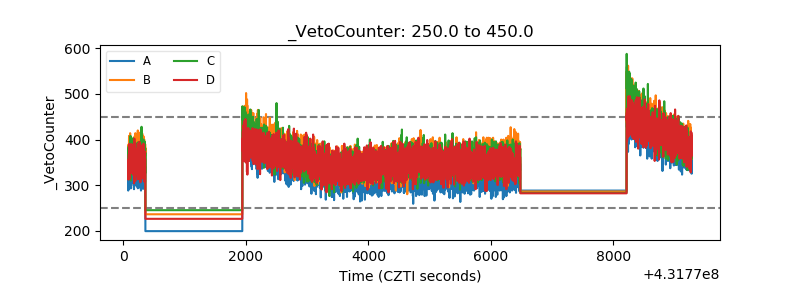 |