| Param | Original file | Final file |
|---|---|---|
| Filename | modeM0/AS1T05_143T01_9000005834_42950cztM0_level2.fits | modeM0/AS1T05_143T01_9000005834_42950cztM0_level2_quad_clean.evt |
| Size (bytes) | 341,141,760 | 89,533,440 |
| Size | 325.3 MB | 85.4 MB |
| Events in quadrant A | 3,690,143 | 595,468 |
| Events in quadrant B | 2,355,973 | 632,963 |
| Events in quadrant C | 2,512,195 | 583,362 |
| Events in quadrant D | 3,664,616 | 534,991 |
| Mode SS | |||
|---|---|---|---|
| Quadrant | BADHDUFLAG | Total packets | Discarded packets |
| A | 0 | 106 | 0 |
| B | 0 | 106 | 0 |
| C | 0 | 106 | 0 |
| D | 0 | 106 | 0 |
| Mode M0 | |||
|---|---|---|---|
| Quadrant | BADHDUFLAG | Total packets | Discarded packets |
| A | 0 | 14229 | 1 |
| B | 0 | 10529 | 1 |
| C | 0 | 10676 | 1 |
| D | 0 | 14483 | 1 |
| Mode M9 | |||
|---|---|---|---|
| Quadrant | BADHDUFLAG | Total packets | Discarded packets |
| A | 0 | 18 | 0 |
| B | 0 | 18 | 0 |
| C | 0 | 18 | 0 |
| D | 0 | 18 | 0 |
| Quadrant | Total seconds | Saturated seconds | Saturation percentage |
|---|---|---|---|
| A | 5200 | 273 | 5.250000% |
| B | 5200 | 6 | 0.115385% |
| C | 5201 | 5 | 0.096135% |
| D | 5200 | 168 | 3.230769% |
Noise dominated data is calculated using 1-second bins in cleaned event files. If a bin has >2000 counts, and if more than 50% of those come from <1% of pixels, then it is considered to be noise-dominated and hence unusable.
| Quadrant | # 1 sec bins | Bins with >0 counts | Bins with >2000 counts | High rate bins dominated by noise | Noise dominated (total time) | Noise dominated (detector-on time) | Marked lightcurve |
|---|---|---|---|---|---|---|---|
| A | 7023 | 5201 | 219 | 219 | 3.12% | 4.21% | 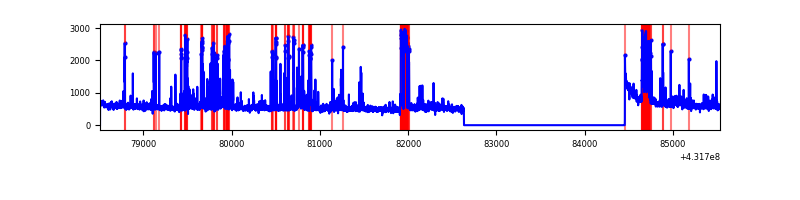 |
| B | 7023 | 5200 | 2 | 2 | 0.03% | 0.04% | 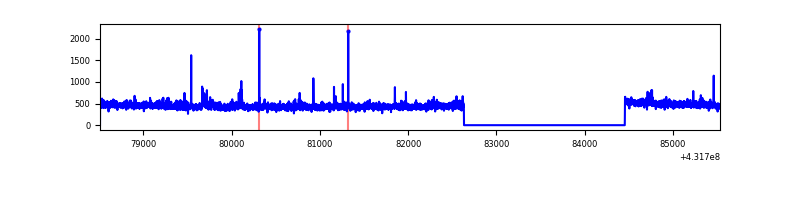 |
| C | 7024 | 5201 | 3 | 3 | 0.04% | 0.06% | 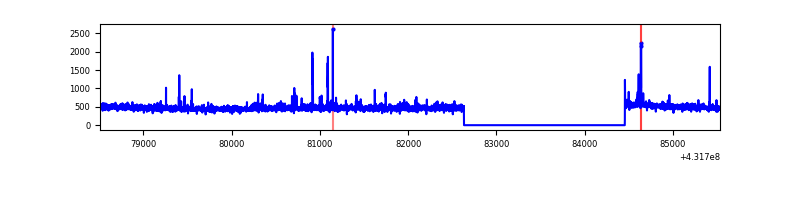 |
| D | 7023 | 5200 | 177 | 177 | 2.52% | 3.40% | 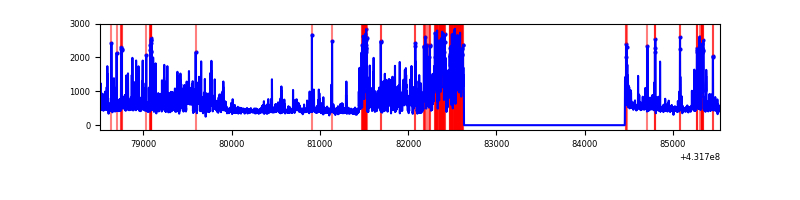 |
Top three noisy pixels from each quadrant. If the there are fewer than three noisy pixels in the level2.evt file, extra rows are filled as -1
| Pixel properties | Quadrant properties | ||||||
|---|---|---|---|---|---|---|---|
| Quadrant | DetID | PixID | Counts | Sigma | Mean | Median | Sigma |
| A | 15 | 237 | 794207 | 6779.81 | 575 | 563 | 117.1 |
| A | 10 | 83 | 498045 | 4249.81 | 575 | 563 | 117.1 |
| A | 15 | 222 | 129725 | 1103.38 | 575 | 563 | 117.1 |
| B | 4 | 171 | 26217 | 227.93 | 584 | 567 | 112.5 |
| B | 12 | 111 | 13608 | 115.88 | 584 | 567 | 112.5 |
| B | 3 | 112 | 13333 | 113.44 | 584 | 567 | 112.5 |
| C | 15 | 214 | 208662 | 1576.13 | 570 | 574 | 132.0 |
| C | 14 | 254 | 37877 | 282.55 | 570 | 574 | 132.0 |
| C | 0 | 207 | 32402 | 241.08 | 570 | 574 | 132.0 |
| D | 12 | 217 | 680567 | 4952.16 | 566 | 549 | 137.3 |
| D | 12 | 6 | 209489 | 1521.58 | 566 | 549 | 137.3 |
| D | 13 | 249 | 194416 | 1411.82 | 566 | 549 | 137.3 |
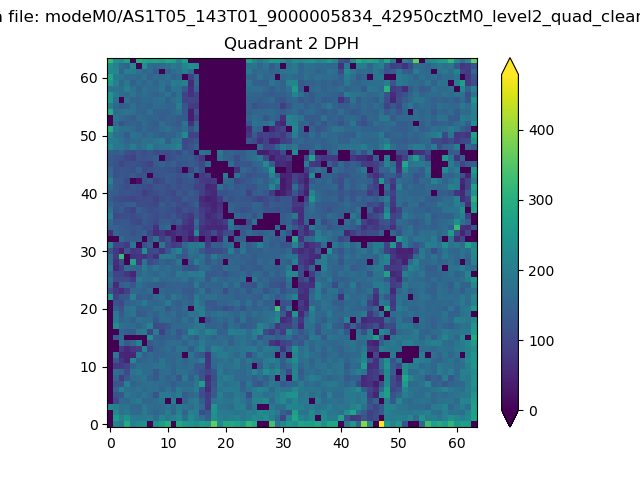
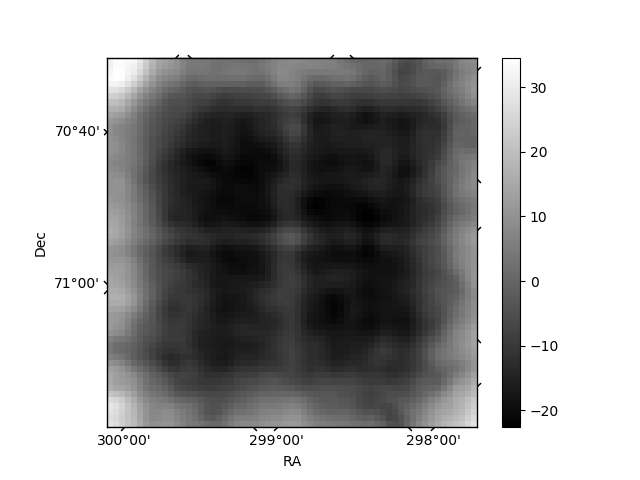
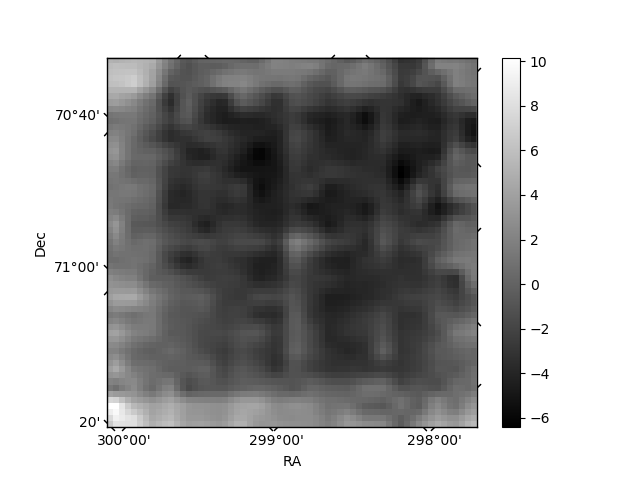
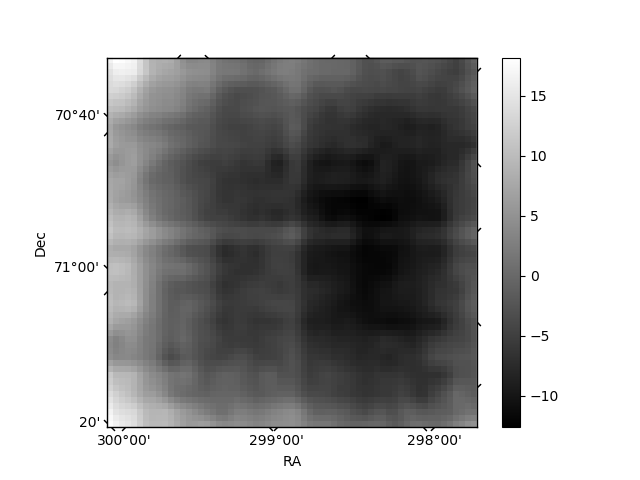
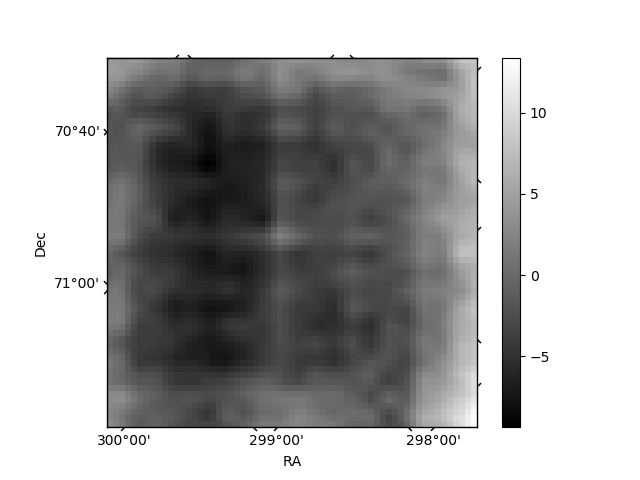
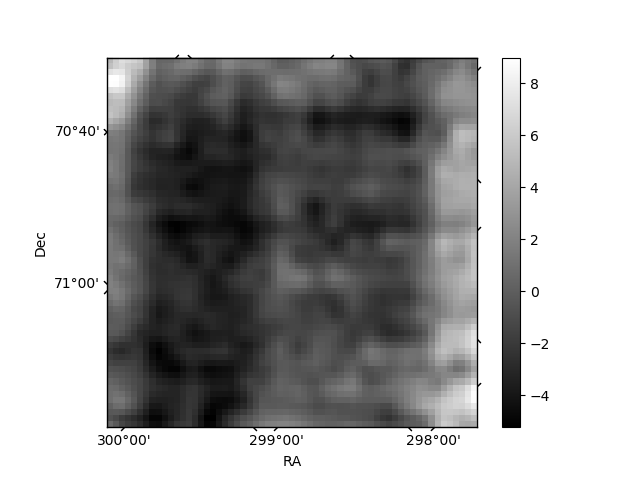
Histogram calculated using DETX and DETY for each event in the final _common_clean file
| Quadrant A | 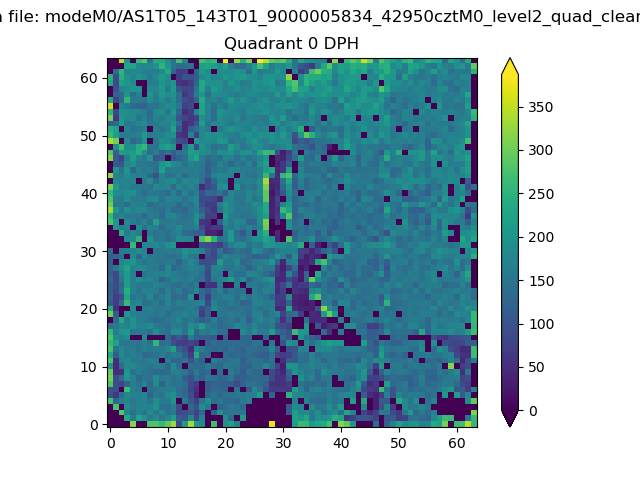 |
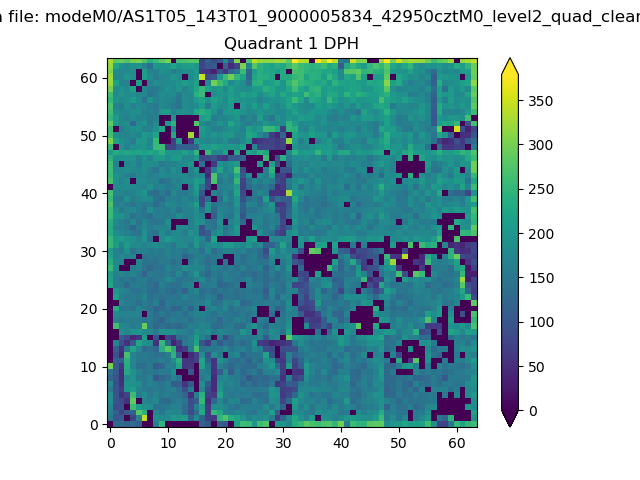 |
Quadrant B |
|---|---|---|---|
| Quadrant D | 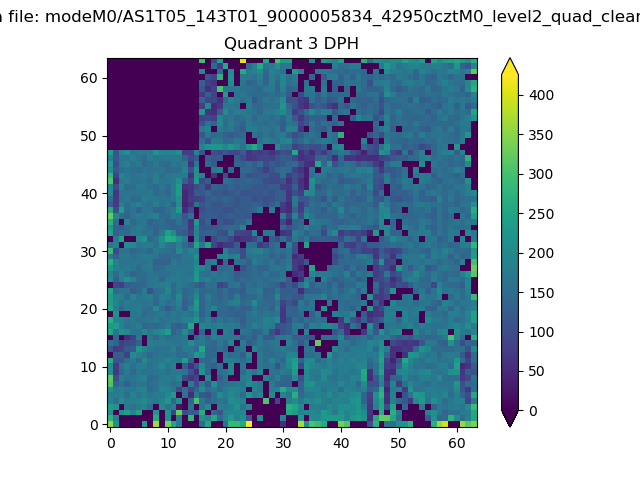 |
 |
Quadrant C |
| Plot type | Count rate plots | Images |
|---|---|---|
| Comparison with Poisson distribution Blue bars denote a histogram of data divided into 1 sec bins. Red curve is a Poisson curve with rate = median count rate of data. |
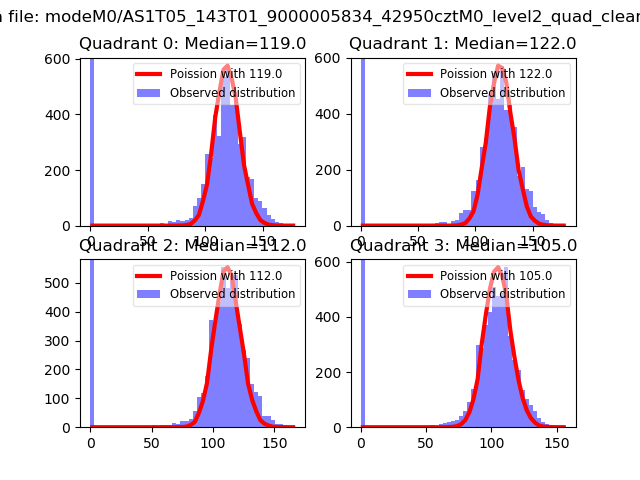 |
 |
| Quadrant-wise count rates Data is divided into 100 sec bins |
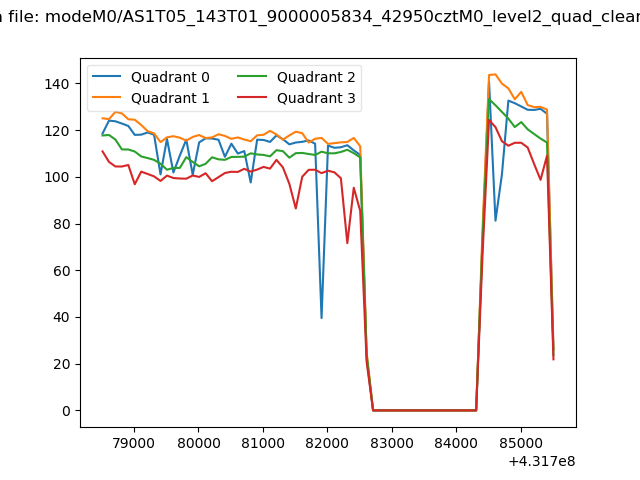 |
|
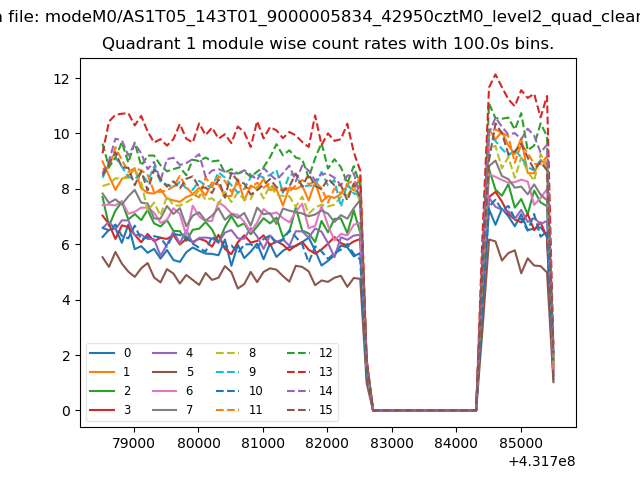
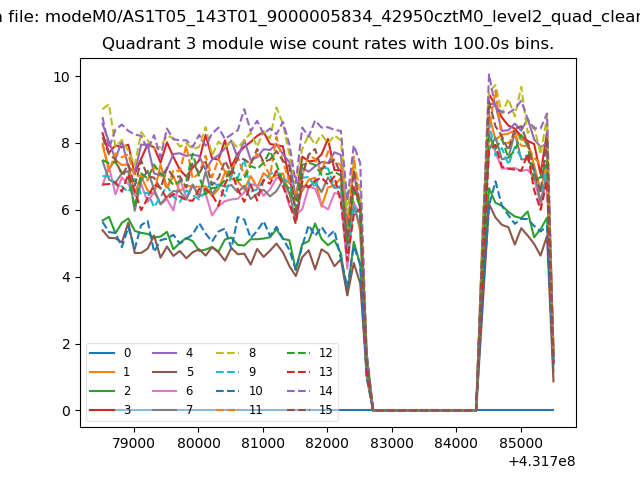
| Module-wise count rates for Quadrant A Data is divided into 100 sec bins |
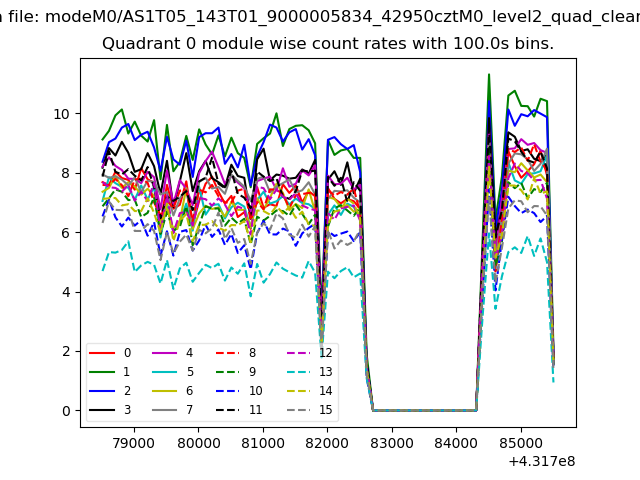 |
 |
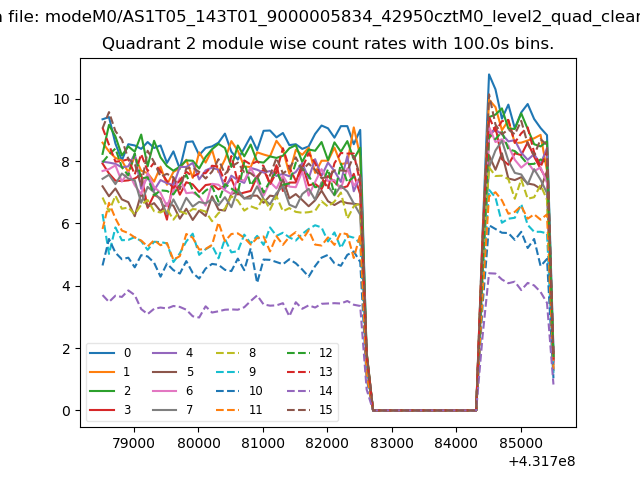
| Module-wise count rates for Quadrant B Data is divided into 100 sec bins |
 |
 |
| Module-wise count rates for Quadrant C Data is divided into 100 sec bins |
 |
 |
| Module-wise count rates for Quadrant D Data is divided into 100 sec bins |
 |
 |
| Parameter | Plot |
|---|---|
| CZT HV Monitor | 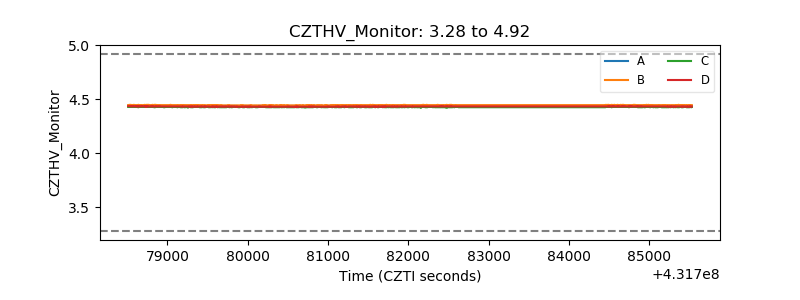 |
| D_VDD | 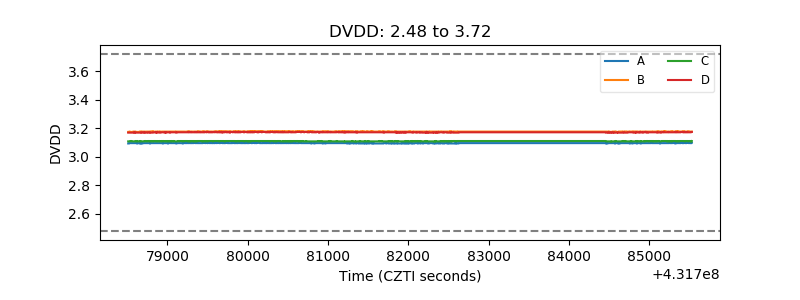 |
| Temperature 1 | 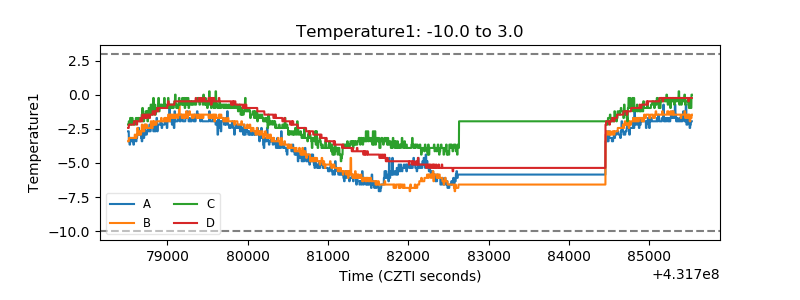 |
| Veto HV Monitor | 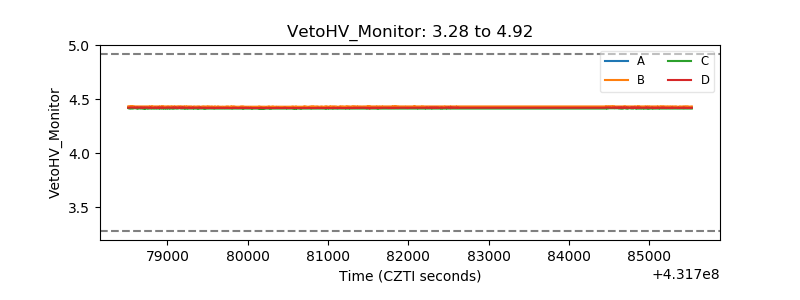 |
| Veto LLD | 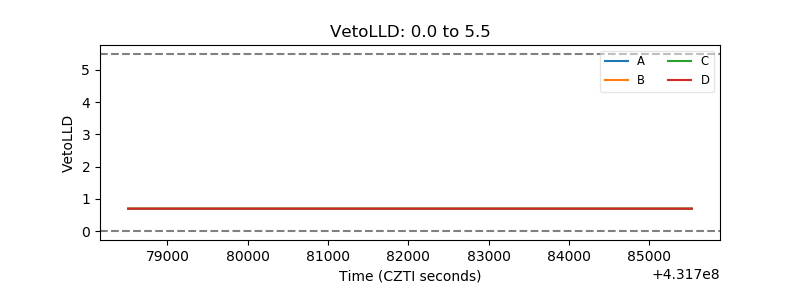 |
| Alpha Counter | 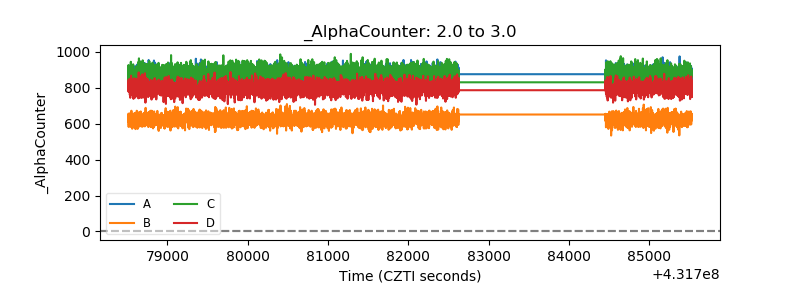 |
| _CPM_Rate | 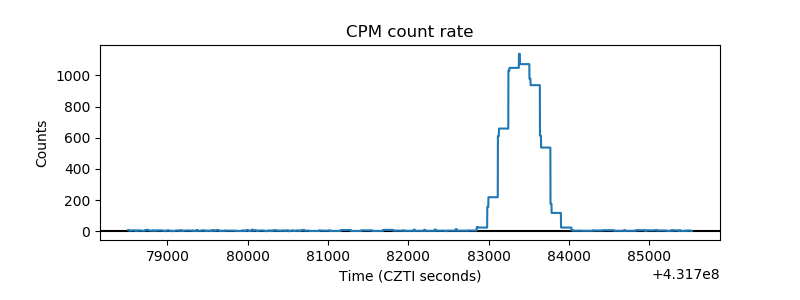 |
| CZT Counter | 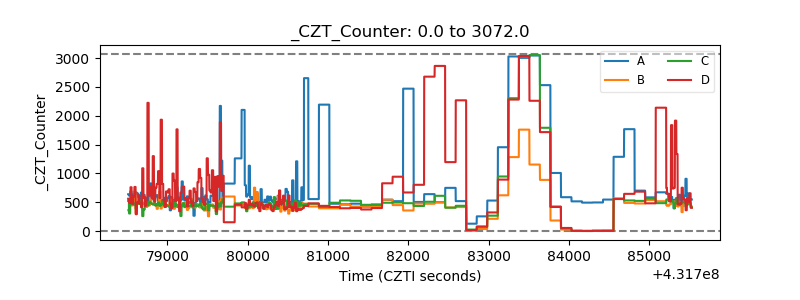 |
| +2.5 Volts monitor |  |
| +5 Volts monitor | 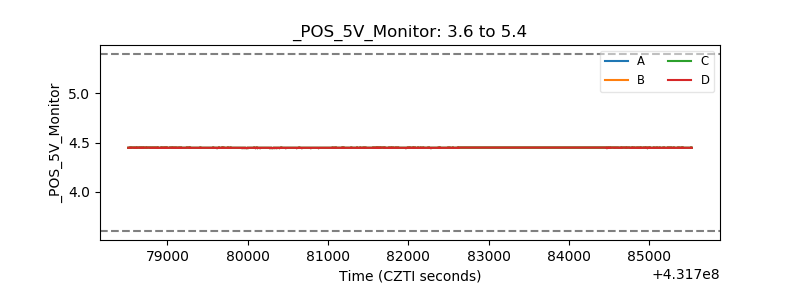 |
| _ROLL_ROT | 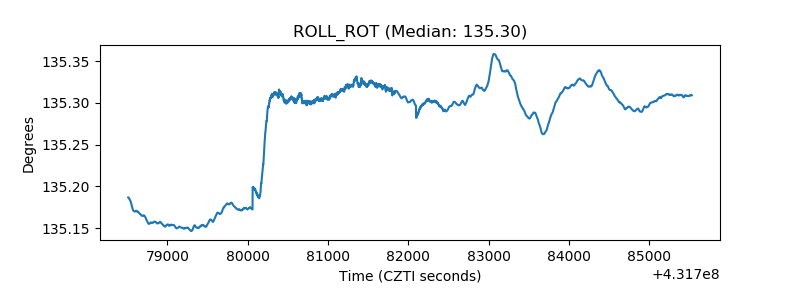 |
| _Roll_DEC | 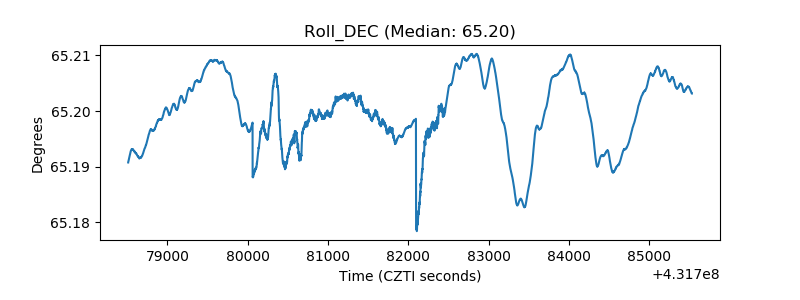 |
| _Roll_RA | 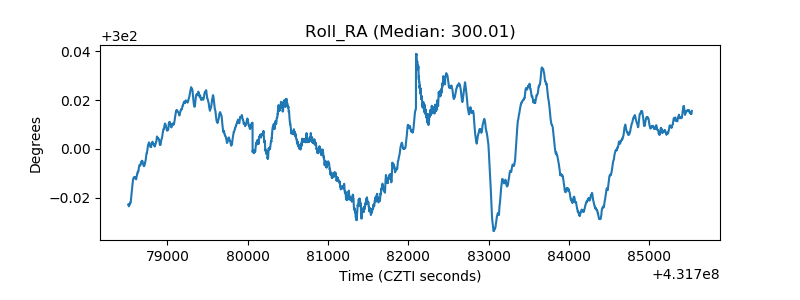 |
| Veto Counter | 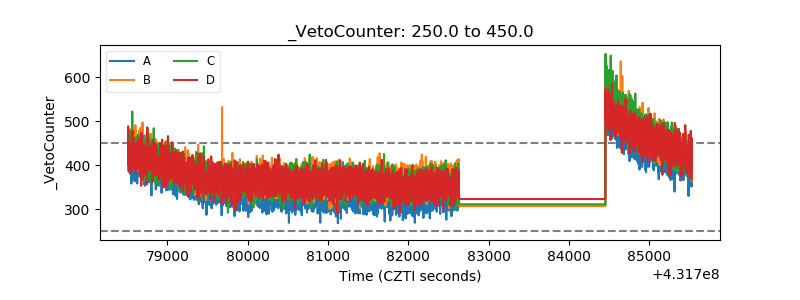 |