| Param | Original file | Final file |
|---|---|---|
| Filename | modeM0/AS1T05_143T01_9000005834_42951cztM0_level2.fits | modeM0/AS1T05_143T01_9000005834_42951cztM0_level2_quad_clean.evt |
| Size (bytes) | 334,249,920 | 90,953,280 |
| Size | 318.8 MB | 86.7 MB |
| Events in quadrant A | 3,439,652 | 619,016 |
| Events in quadrant B | 2,373,975 | 642,490 |
| Events in quadrant C | 2,564,657 | 600,644 |
| Events in quadrant D | 3,598,174 | 535,450 |
| Mode SS | |||
|---|---|---|---|
| Quadrant | BADHDUFLAG | Total packets | Discarded packets |
| A | 0 | 104 | 0 |
| B | 0 | 104 | 0 |
| C | 0 | 104 | 0 |
| D | 0 | 104 | 0 |
| Mode M0 | |||
|---|---|---|---|
| Quadrant | BADHDUFLAG | Total packets | Discarded packets |
| A | 0 | 13391 | 1 |
| B | 0 | 10482 | 1 |
| C | 0 | 10666 | 1 |
| D | 0 | 14094 | 1 |
| Mode M9 | |||
|---|---|---|---|
| Quadrant | BADHDUFLAG | Total packets | Discarded packets |
| A | 0 | 20 | 0 |
| B | 0 | 20 | 0 |
| C | 0 | 20 | 0 |
| D | 0 | 20 | 0 |
| Quadrant | Total seconds | Saturated seconds | Saturation percentage |
|---|---|---|---|
| A | 5088 | 188 | 3.694969% |
| B | 5089 | 10 | 0.196502% |
| C | 5089 | 7 | 0.137552% |
| D | 5089 | 276 | 5.423462% |
Noise dominated data is calculated using 1-second bins in cleaned event files. If a bin has >2000 counts, and if more than 50% of those come from <1% of pixels, then it is considered to be noise-dominated and hence unusable.
| Quadrant | # 1 sec bins | Bins with >0 counts | Bins with >2000 counts | High rate bins dominated by noise | Noise dominated (total time) | Noise dominated (detector-on time) | Marked lightcurve |
|---|---|---|---|---|---|---|---|
| A | 7061 | 5089 | 135 | 135 | 1.91% | 2.65% | 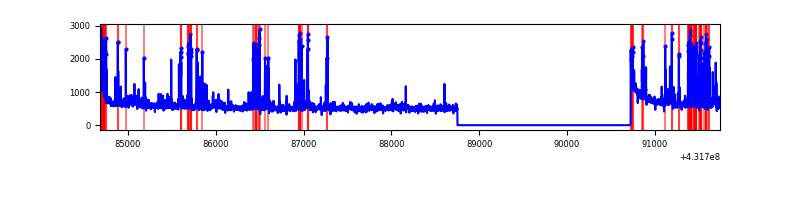 |
| B | 7062 | 5089 | 7 | 7 | 0.10% | 0.14% | 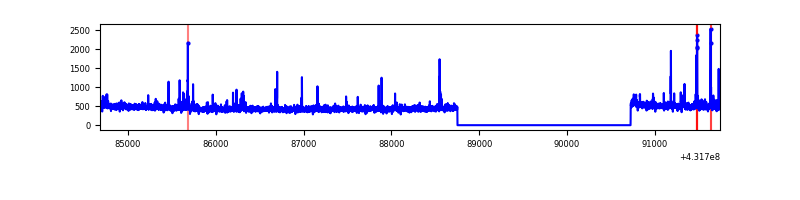 |
| C | 7062 | 5089 | 5 | 5 | 0.07% | 0.10% | 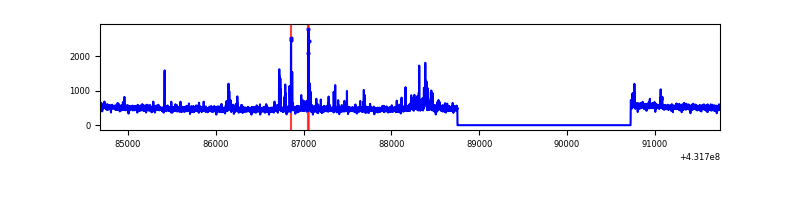 |
| D | 7062 | 5089 | 280 | 280 | 3.96% | 5.50% | 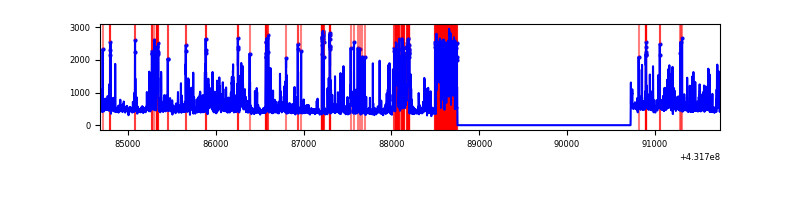 |
Top three noisy pixels from each quadrant. If the there are fewer than three noisy pixels in the level2.evt file, extra rows are filled as -1
| Pixel properties | Quadrant properties | ||||||
|---|---|---|---|---|---|---|---|
| Quadrant | DetID | PixID | Counts | Sigma | Mean | Median | Sigma |
| A | 15 | 237 | 560940 | 4767.33 | 575 | 565 | 117.5 |
| A | 10 | 83 | 500863 | 4256.23 | 575 | 565 | 117.5 |
| A | 15 | 222 | 104893 | 887.56 | 575 | 565 | 117.5 |
| B | 15 | 32 | 35046 | 311.35 | 580 | 565 | 110.7 |
| B | 15 | 85 | 25292 | 223.27 | 580 | 565 | 110.7 |
| B | 0 | 229 | 13626 | 117.93 | 580 | 565 | 110.7 |
| C | 15 | 214 | 204848 | 1556.67 | 570 | 574 | 131.2 |
| C | 14 | 254 | 77333 | 584.94 | 570 | 574 | 131.2 |
| C | 0 | 207 | 44268 | 332.97 | 570 | 574 | 131.2 |
| D | 2 | 249 | 501622 | 3687.36 | 561 | 546 | 135.9 |
| D | 1 | 52 | 235028 | 1725.53 | 561 | 546 | 135.9 |
| D | 13 | 249 | 191344 | 1404.06 | 561 | 546 | 135.9 |
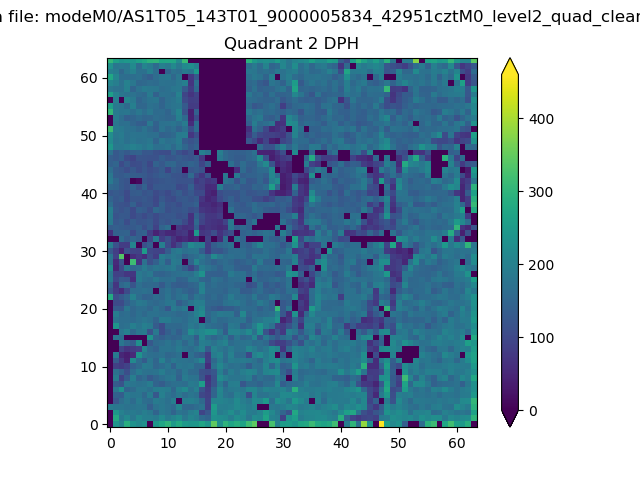
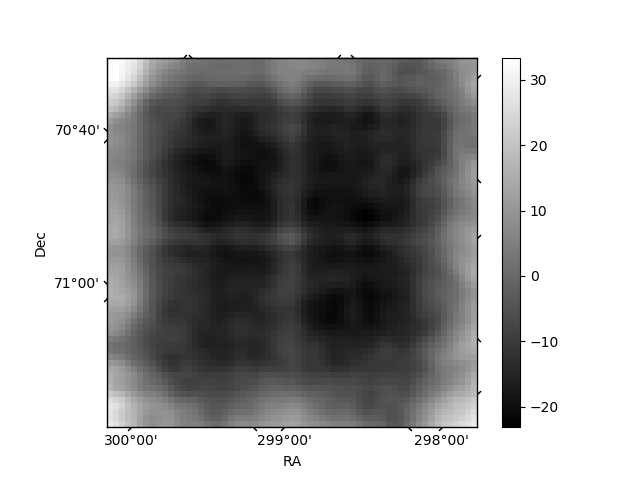
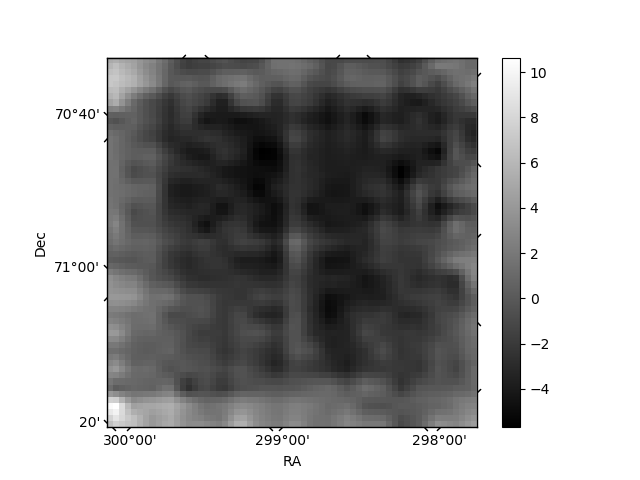
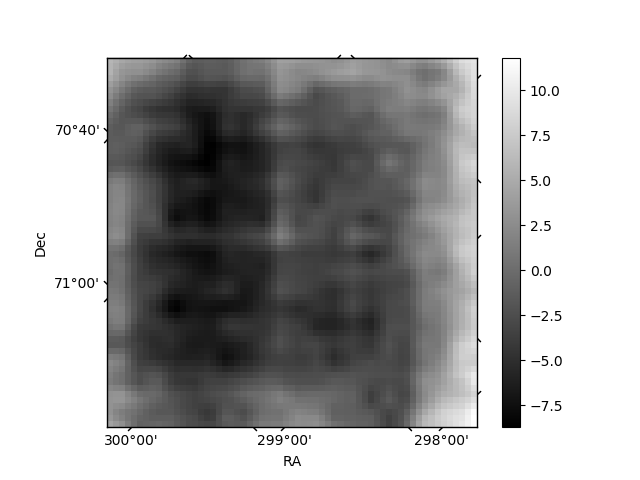
Histogram calculated using DETX and DETY for each event in the final _common_clean file
| Quadrant A | 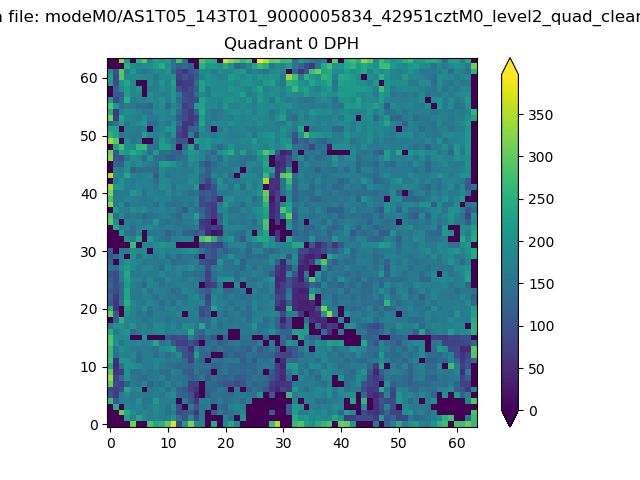 |
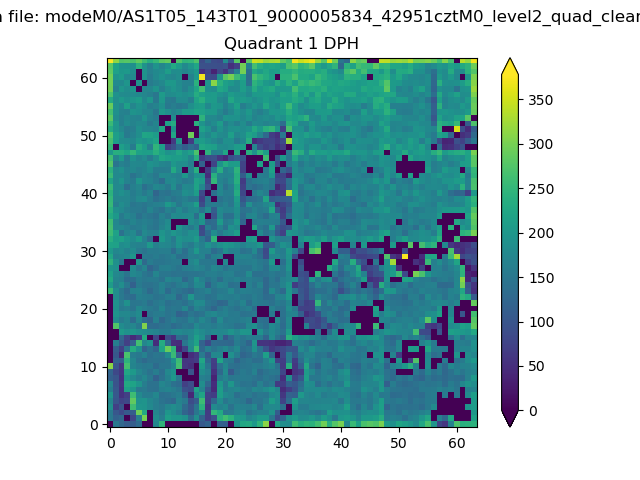 |
Quadrant B |
|---|---|---|---|
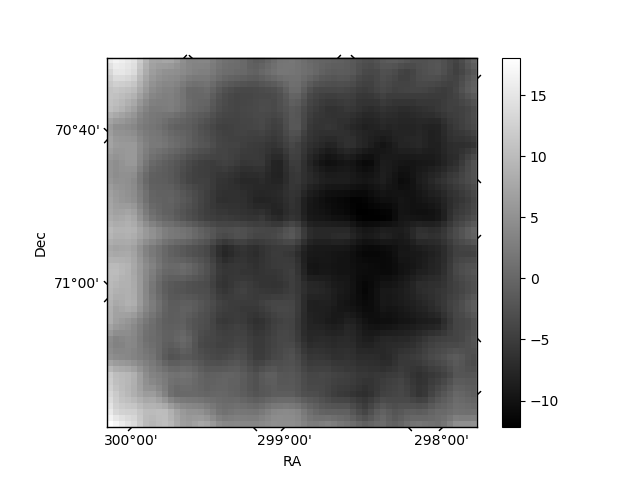
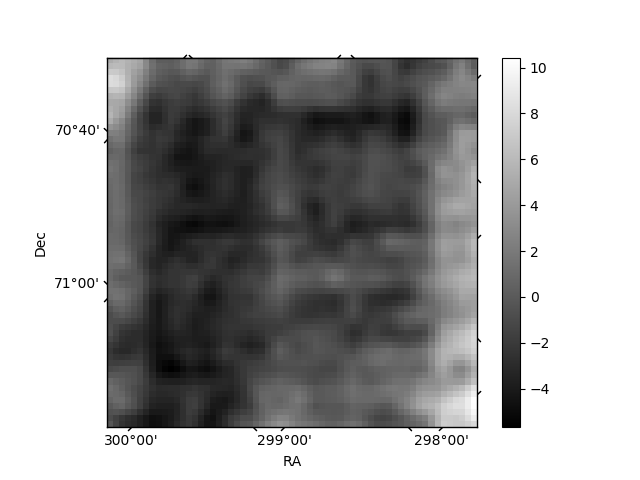
| Quadrant D | 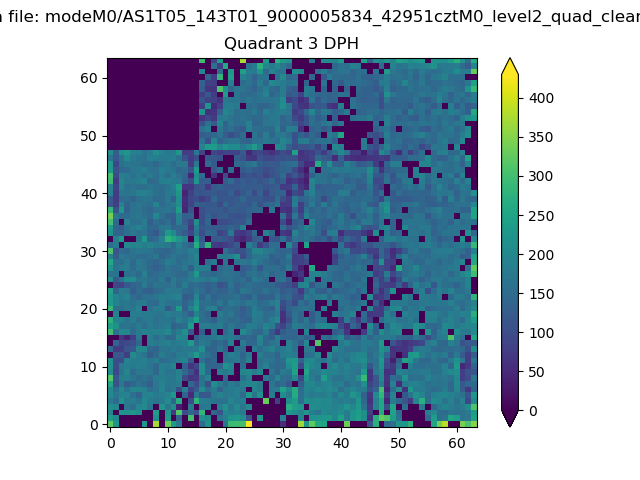 |
 |
Quadrant C |
| Plot type | Count rate plots | Images |
|---|---|---|
| Comparison with Poisson distribution Blue bars denote a histogram of data divided into 1 sec bins. Red curve is a Poisson curve with rate = median count rate of data. |
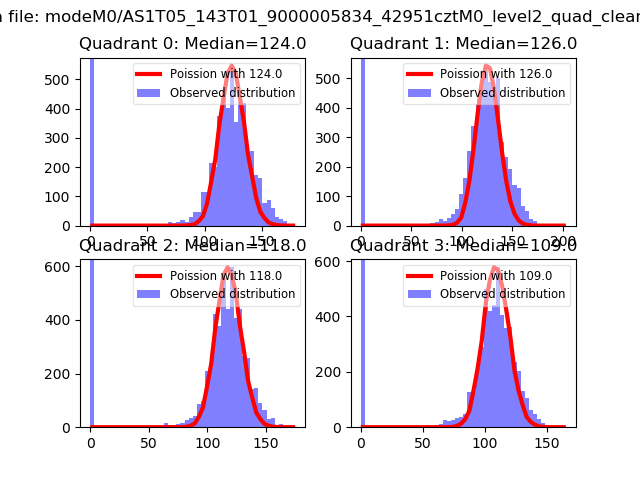 |
 |
| Quadrant-wise count rates Data is divided into 100 sec bins |
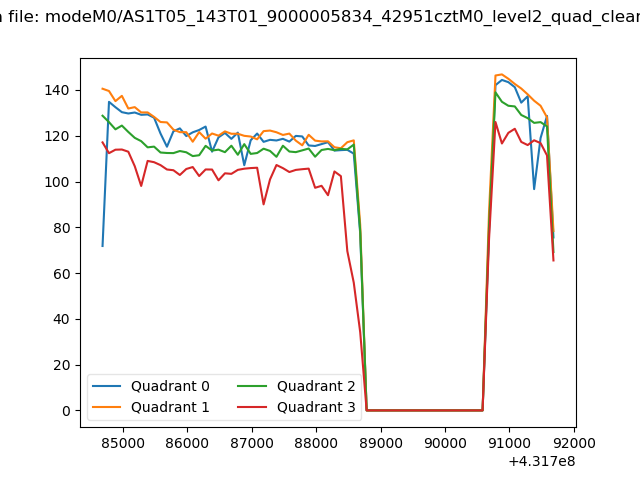 |
|
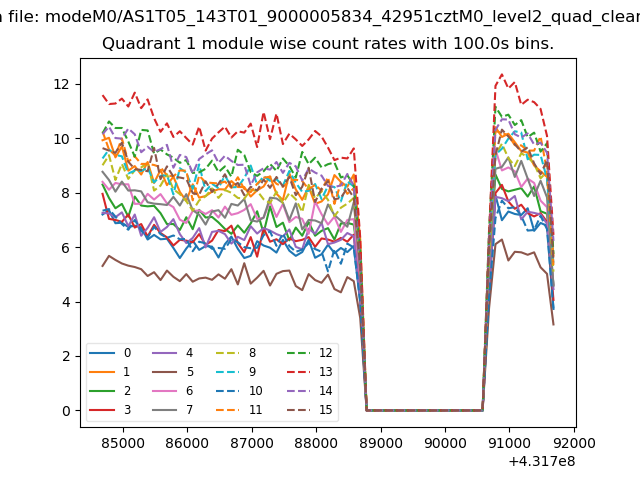
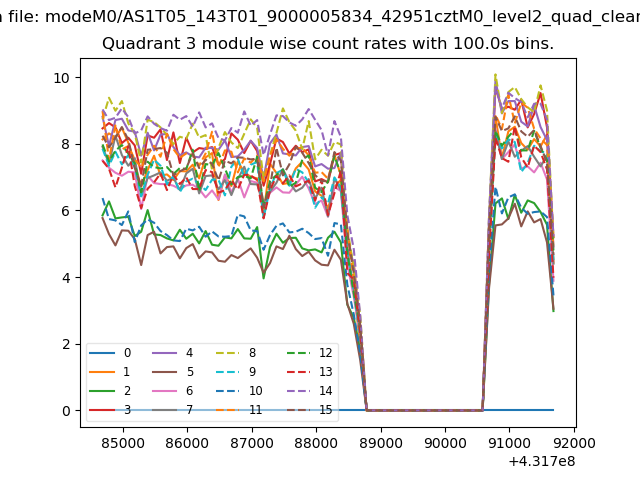
| Module-wise count rates for Quadrant A Data is divided into 100 sec bins |
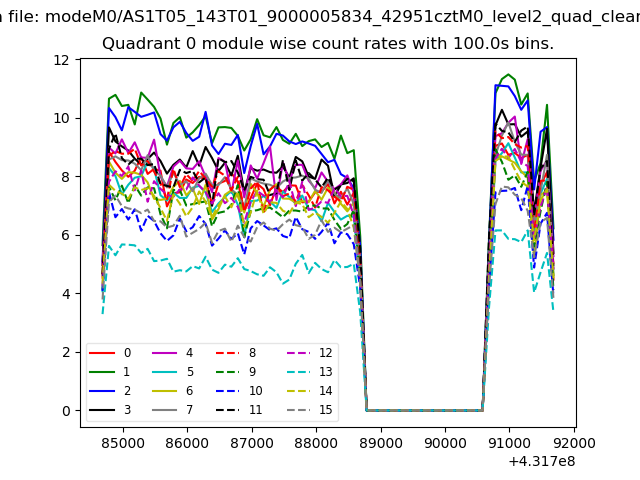 |
 |
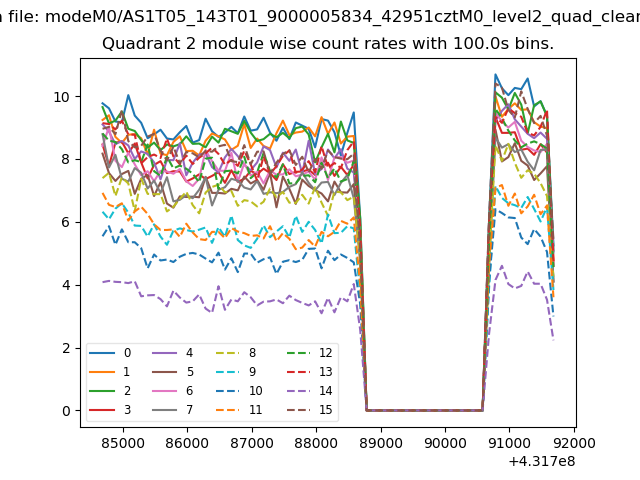
| Module-wise count rates for Quadrant B Data is divided into 100 sec bins |
 |
 |
| Module-wise count rates for Quadrant C Data is divided into 100 sec bins |
 |
 |
| Module-wise count rates for Quadrant D Data is divided into 100 sec bins |
 |
 |
| Parameter | Plot |
|---|---|
| CZT HV Monitor |  |
| D_VDD | 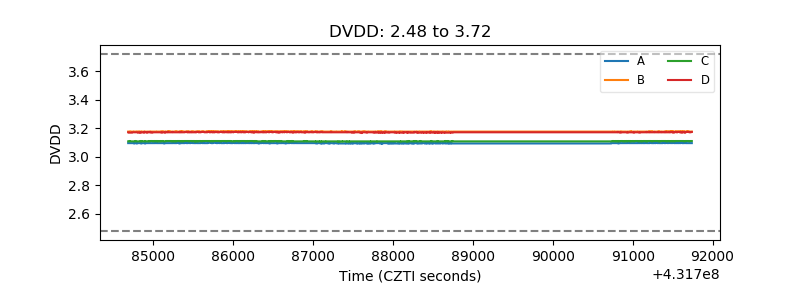 |
| Temperature 1 | 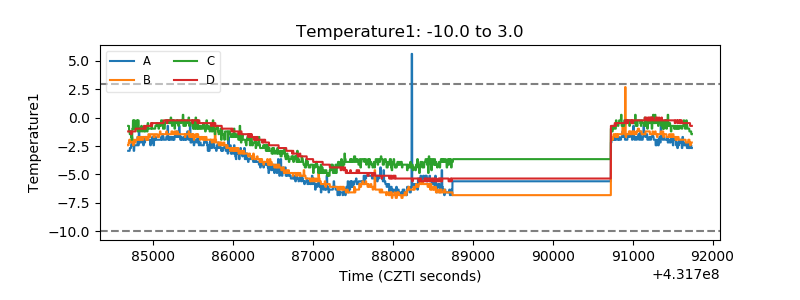 |
| Veto HV Monitor | 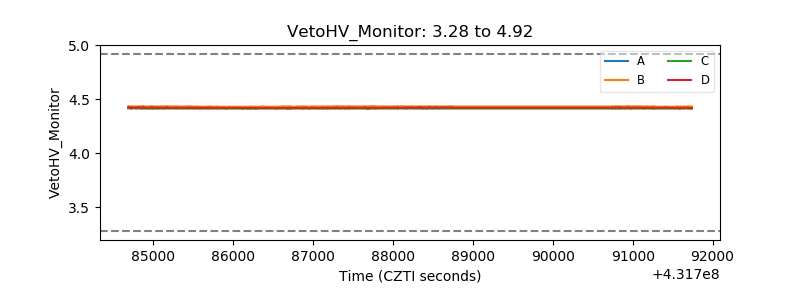 |
| Veto LLD | 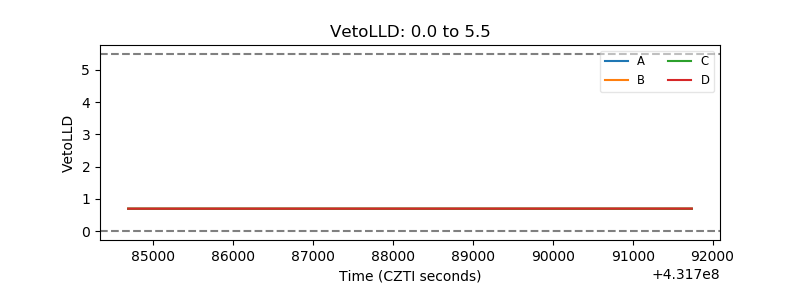 |
| Alpha Counter | 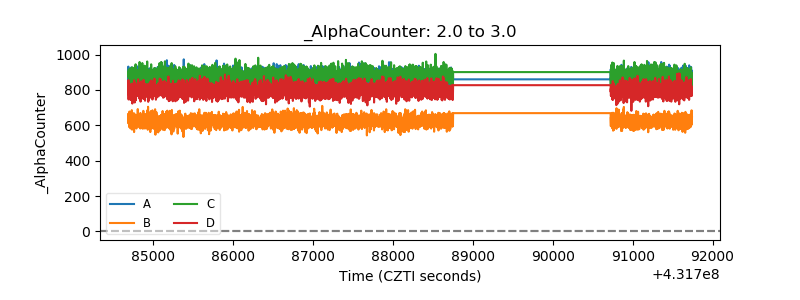 |
| _CPM_Rate | 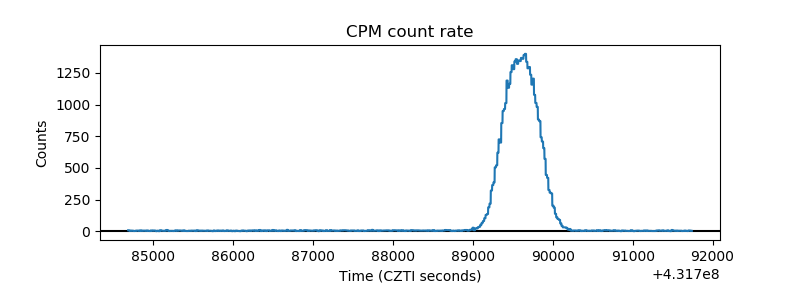 |
| CZT Counter | 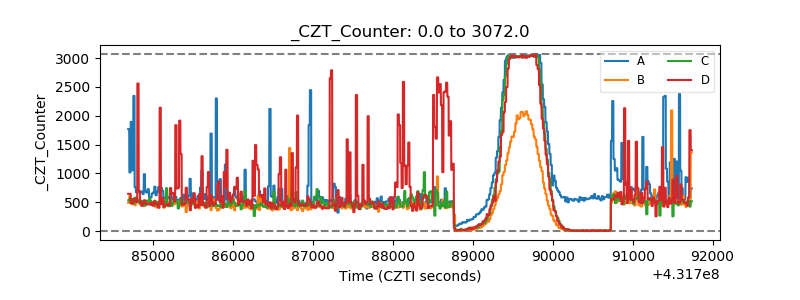 |
| +2.5 Volts monitor | 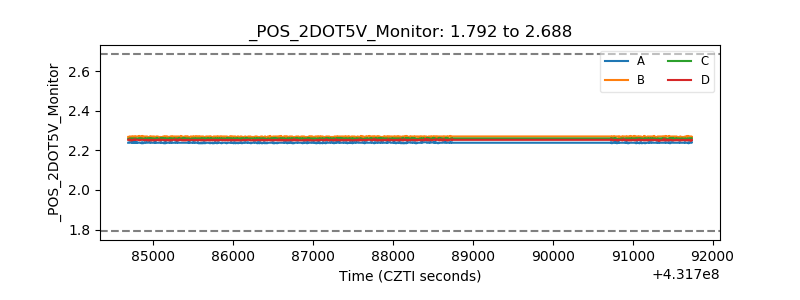 |
| +5 Volts monitor | 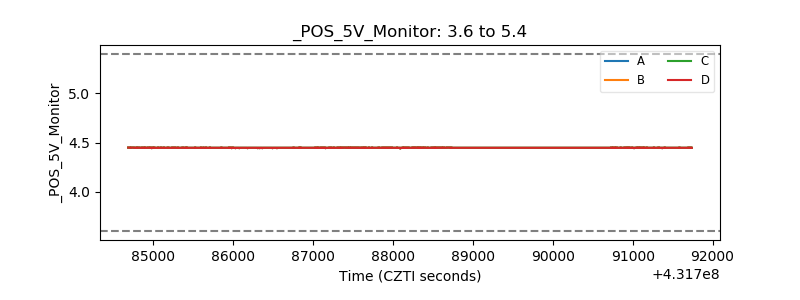 |
| _ROLL_ROT | 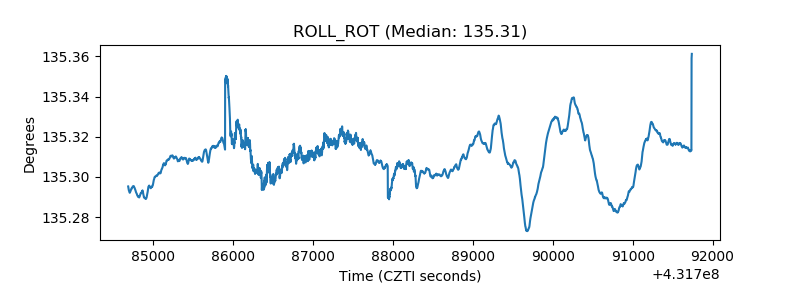 |
| _Roll_DEC | 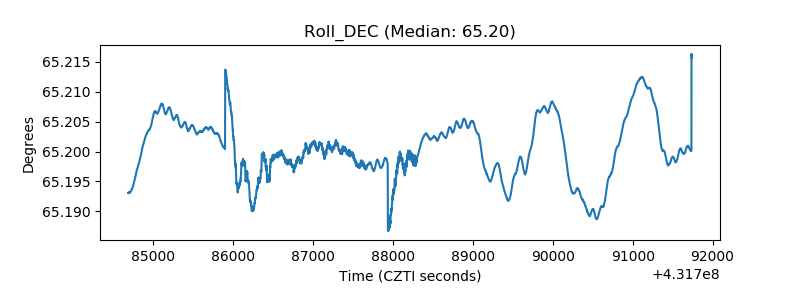 |
| _Roll_RA | 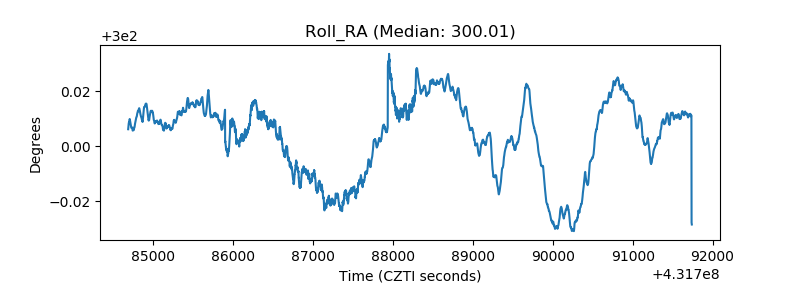 |
| Veto Counter | 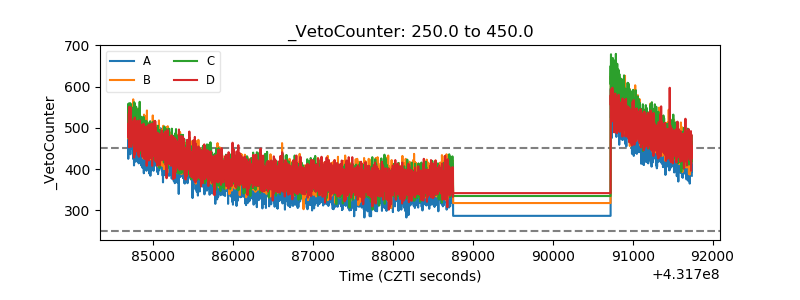 |