| Param | Original file | Final file |
|---|---|---|
| Filename | modeM0/AS1T05_143T01_9000005834_42952cztM0_level2.fits | modeM0/AS1T05_143T01_9000005834_42952cztM0_level2_quad_clean.evt |
| Size (bytes) | 311,630,400 | 88,441,920 |
| Size | 297.2 MB | 84.3 MB |
| Events in quadrant A | 3,196,778 | 601,486 |
| Events in quadrant B | 2,399,331 | 619,755 |
| Events in quadrant C | 2,445,218 | 587,089 |
| Events in quadrant D | 3,115,365 | 528,078 |
| Mode SS | |||
|---|---|---|---|
| Quadrant | BADHDUFLAG | Total packets | Discarded packets |
| A | 0 | 102 | 0 |
| B | 0 | 102 | 0 |
| C | 0 | 102 | 0 |
| D | 0 | 102 | 0 |
| Mode M0 | |||
|---|---|---|---|
| Quadrant | BADHDUFLAG | Total packets | Discarded packets |
| A | 0 | 12533 | 1 |
| B | 0 | 10369 | 1 |
| C | 0 | 10093 | 1 |
| D | 0 | 12599 | 1 |
| Mode M9 | |||
|---|---|---|---|
| Quadrant | BADHDUFLAG | Total packets | Discarded packets |
| A | 0 | 20 | 0 |
| B | 0 | 20 | 0 |
| C | 0 | 20 | 0 |
| D | 0 | 20 | 0 |
| Quadrant | Total seconds | Saturated seconds | Saturation percentage |
|---|---|---|---|
| A | 4860 | 123 | 2.530864% |
| B | 4861 | 33 | 0.678873% |
| C | 4861 | 4 | 0.082288% |
| D | 4861 | 200 | 4.114380% |
Noise dominated data is calculated using 1-second bins in cleaned event files. If a bin has >2000 counts, and if more than 50% of those come from <1% of pixels, then it is considered to be noise-dominated and hence unusable.
| Quadrant | # 1 sec bins | Bins with >0 counts | Bins with >2000 counts | High rate bins dominated by noise | Noise dominated (total time) | Noise dominated (detector-on time) | Marked lightcurve |
|---|---|---|---|---|---|---|---|
| A | 6923 | 4861 | 102 | 102 | 1.47% | 2.10% | 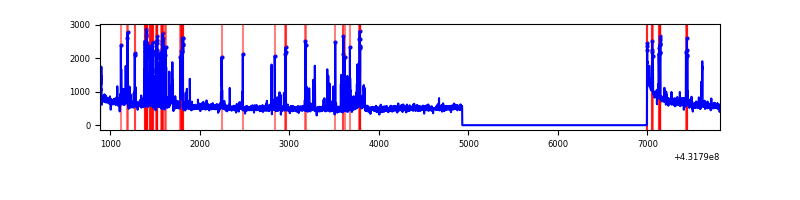 |
| B | 6924 | 4861 | 25 | 25 | 0.36% | 0.51% | 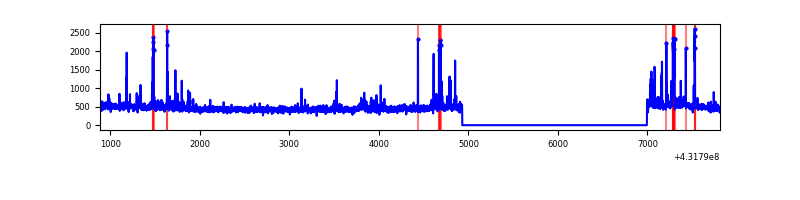 |
| C | 6924 | 4861 | 4 | 4 | 0.06% | 0.08% | 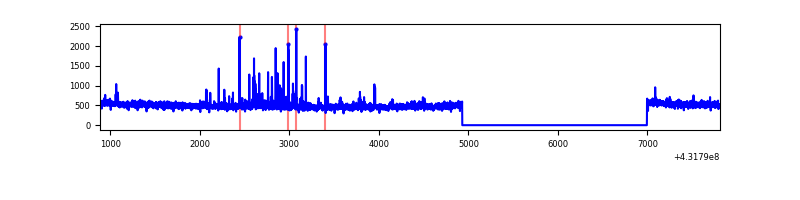 |
| D | 6924 | 4861 | 180 | 180 | 2.60% | 3.70% | 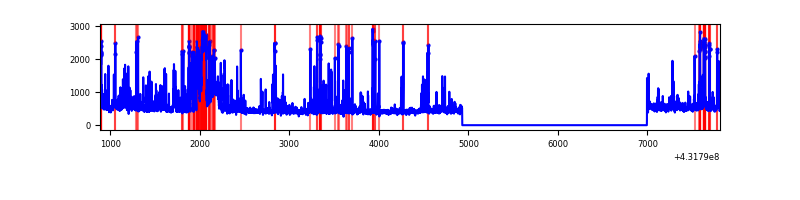 |
Top three noisy pixels from each quadrant. If the there are fewer than three noisy pixels in the level2.evt file, extra rows are filled as -1
| Pixel properties | Quadrant properties | ||||||
|---|---|---|---|---|---|---|---|
| Quadrant | DetID | PixID | Counts | Sigma | Mean | Median | Sigma |
| A | 10 | 83 | 501350 | 4425.76 | 554 | 543 | 113.2 |
| A | 15 | 237 | 459106 | 4052.44 | 554 | 543 | 113.2 |
| A | 15 | 222 | 29273 | 253.89 | 554 | 543 | 113.2 |
| B | 4 | 171 | 62659 | 588.57 | 554 | 539 | 105.5 |
| B | 3 | 112 | 45570 | 426.66 | 554 | 539 | 105.5 |
| B | 15 | 32 | 36024 | 336.21 | 554 | 539 | 105.5 |
| C | 15 | 214 | 197255 | 1549.11 | 549 | 551 | 127.0 |
| C | 14 | 254 | 47450 | 369.35 | 549 | 551 | 127.0 |
| C | 12 | 249 | 37294 | 289.36 | 549 | 551 | 127.0 |
| D | 10 | 118 | 555416 | 4234.69 | 541 | 527 | 131.0 |
| D | 13 | 249 | 137262 | 1043.51 | 541 | 527 | 131.0 |
| D | 1 | 52 | 129989 | 988.0 | 541 | 527 | 131.0 |
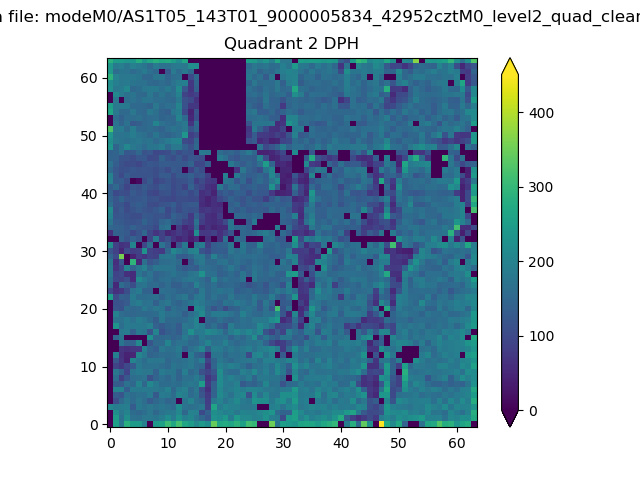
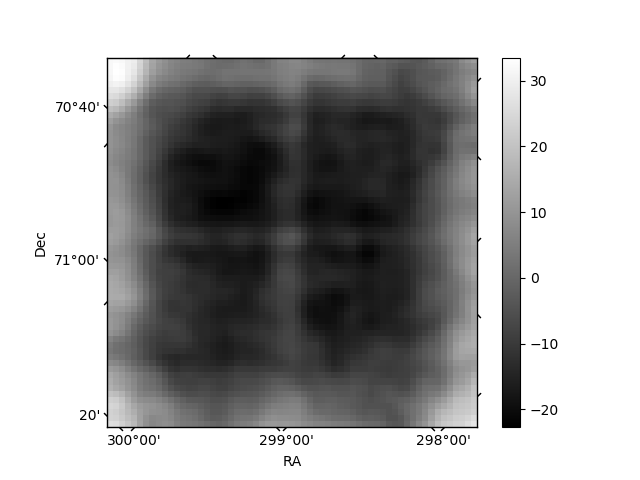
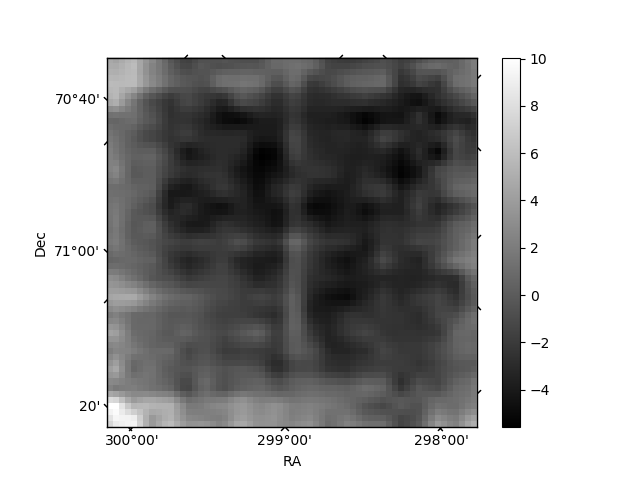
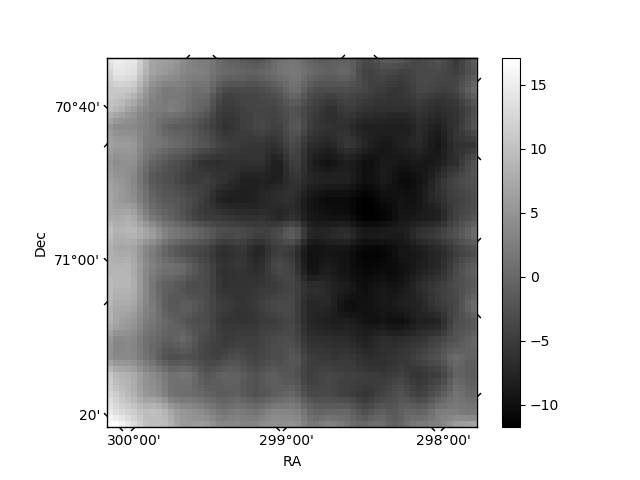
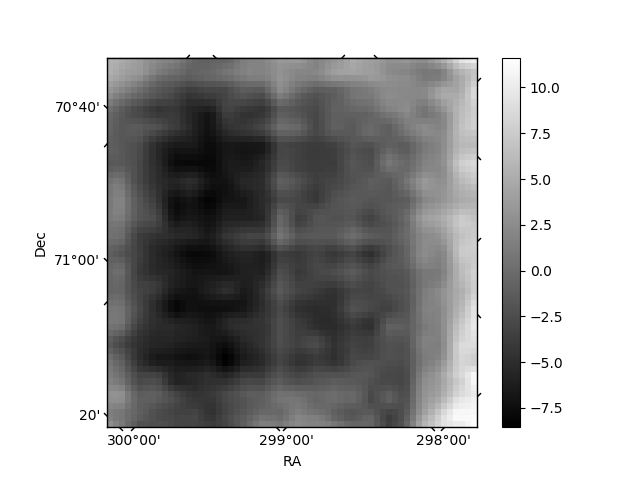
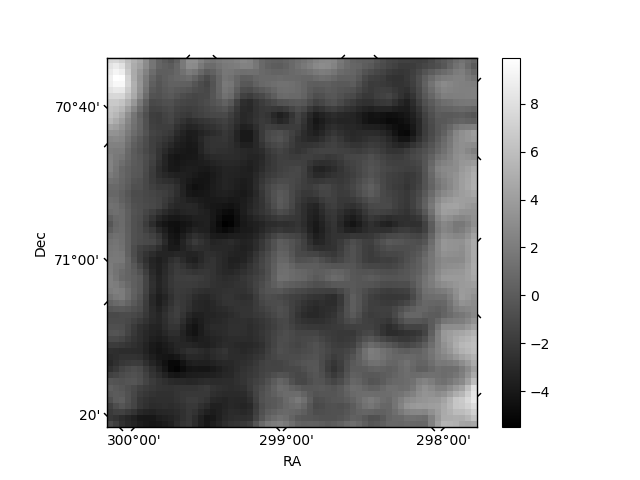
Histogram calculated using DETX and DETY for each event in the final _common_clean file
| Quadrant A | 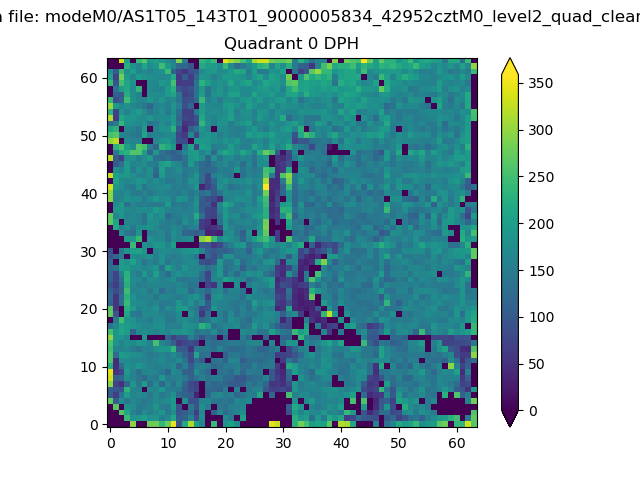 |
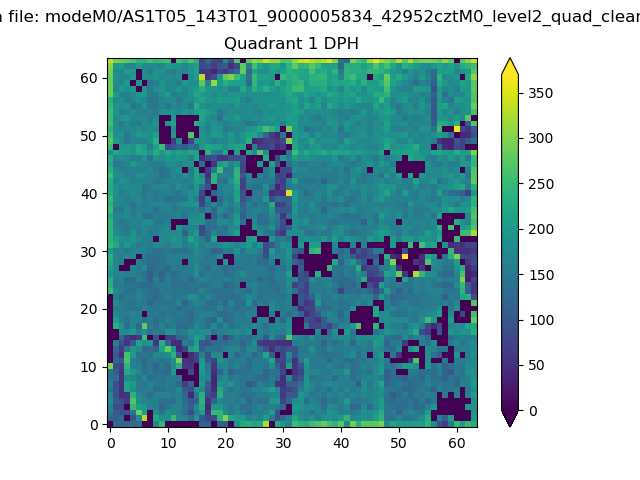 |
Quadrant B |
|---|---|---|---|
| Quadrant D | 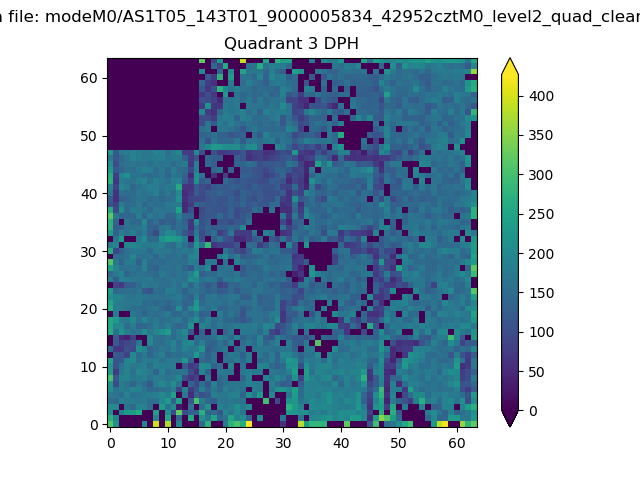 |
 |
Quadrant C |
| Plot type | Count rate plots | Images |
|---|---|---|
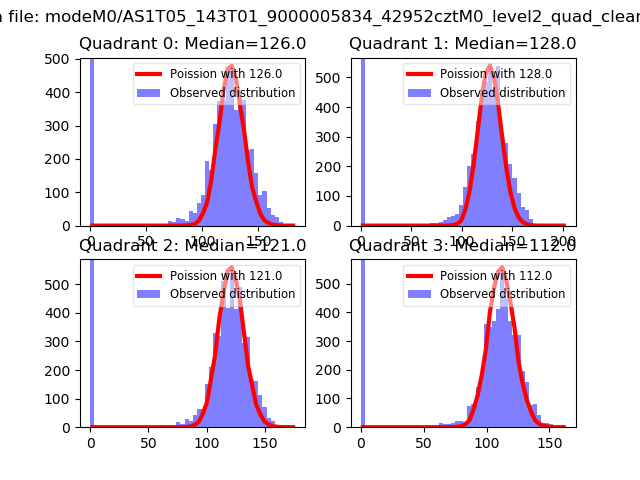
| Comparison with Poisson distribution Blue bars denote a histogram of data divided into 1 sec bins. Red curve is a Poisson curve with rate = median count rate of data. |
 |
 |
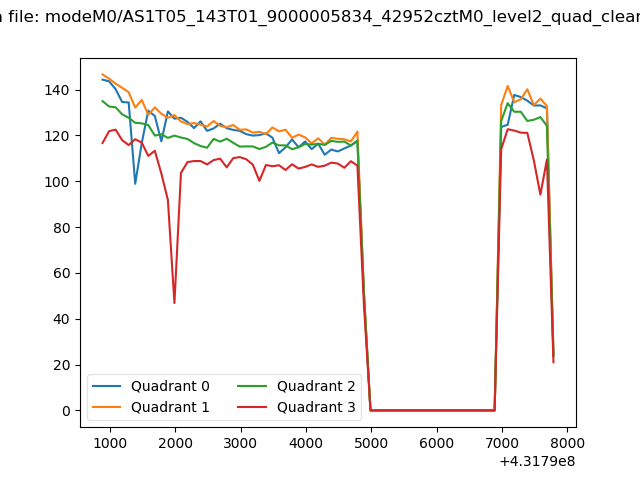
| Quadrant-wise count rates Data is divided into 100 sec bins |
 |
|
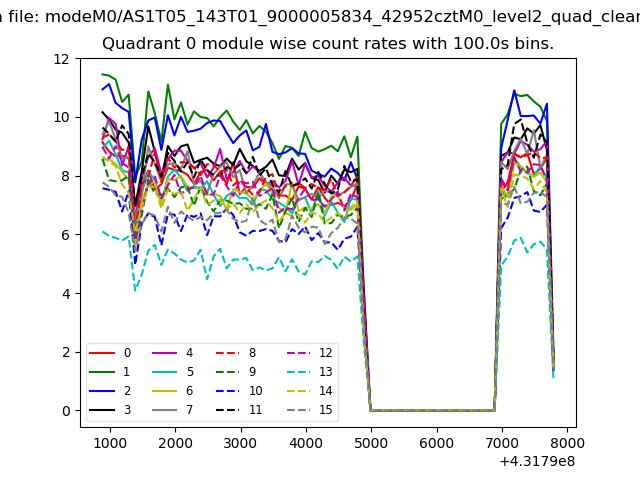
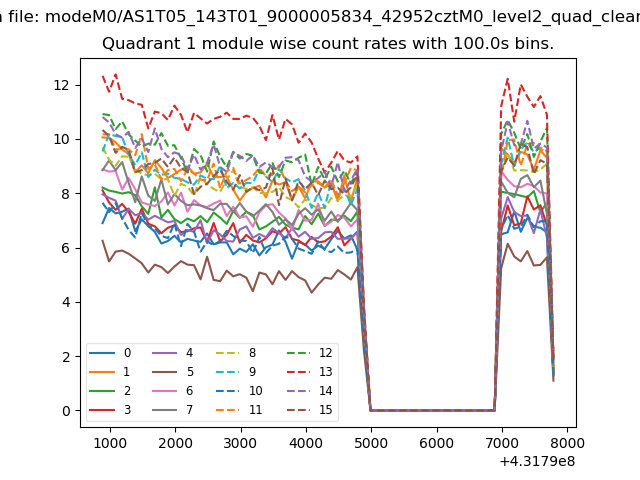
| Module-wise count rates for Quadrant A Data is divided into 100 sec bins |
 |
 |
| Module-wise count rates for Quadrant B Data is divided into 100 sec bins |
 |
 |
| Module-wise count rates for Quadrant C Data is divided into 100 sec bins |
 |
 |
| Module-wise count rates for Quadrant D Data is divided into 100 sec bins |
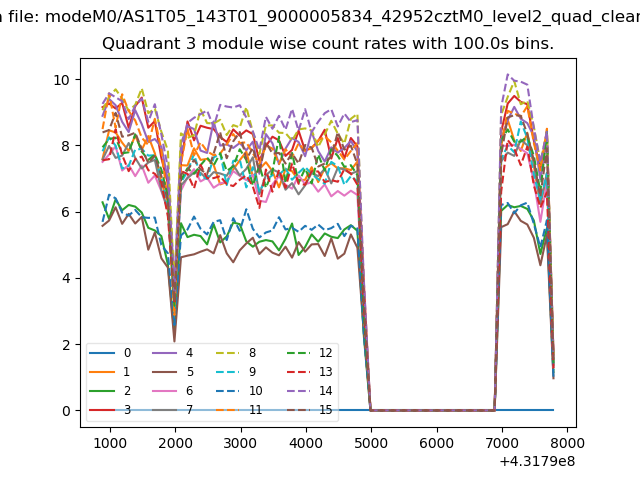 |
 |
| Parameter | Plot |
|---|---|
| CZT HV Monitor | 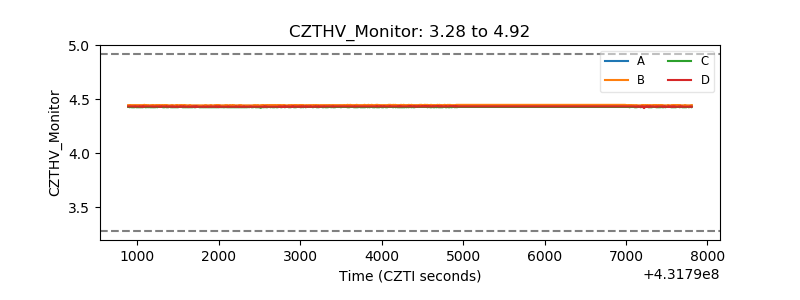 |
| D_VDD | 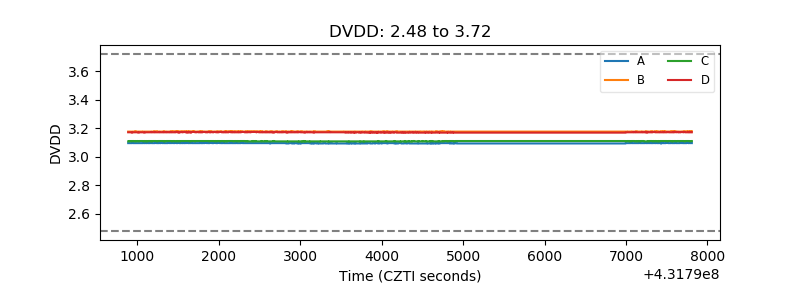 |
| Temperature 1 | 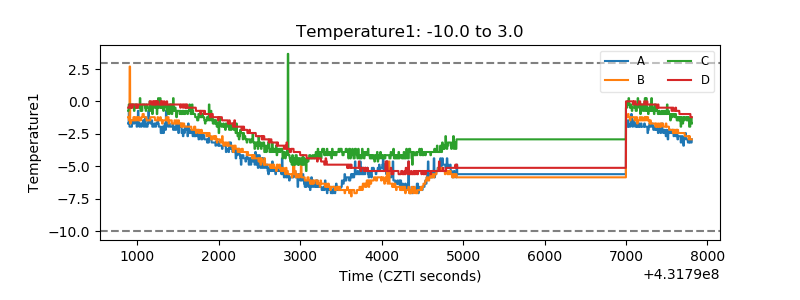 |
| Veto HV Monitor | 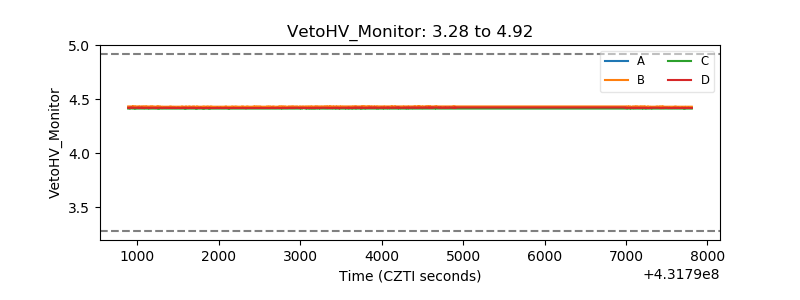 |
| Veto LLD | 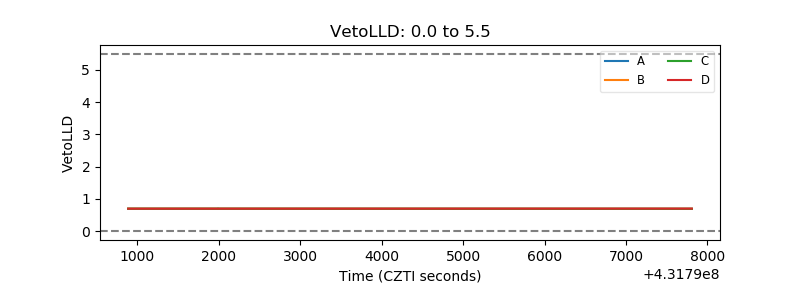 |
| Alpha Counter | 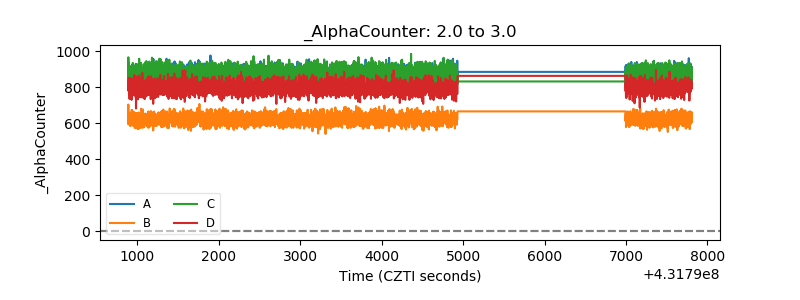 |
| _CPM_Rate | 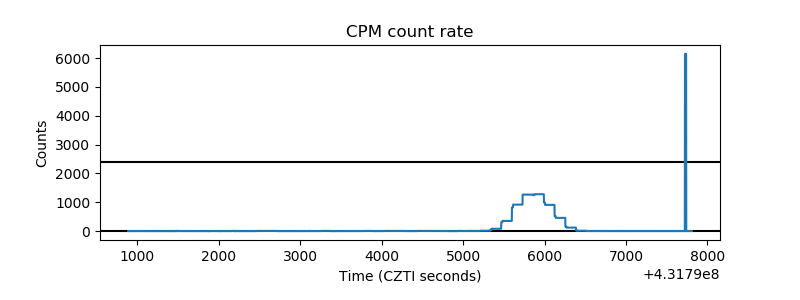 |
| CZT Counter | 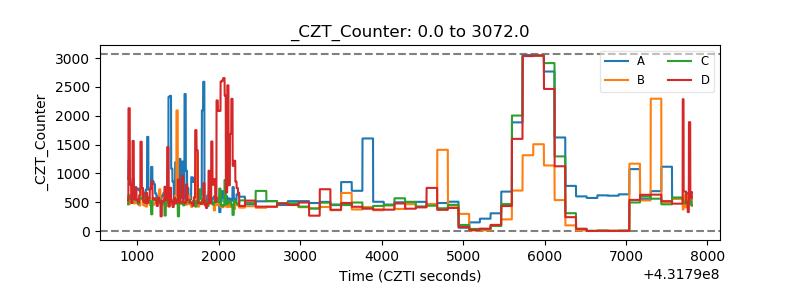 |
| +2.5 Volts monitor | 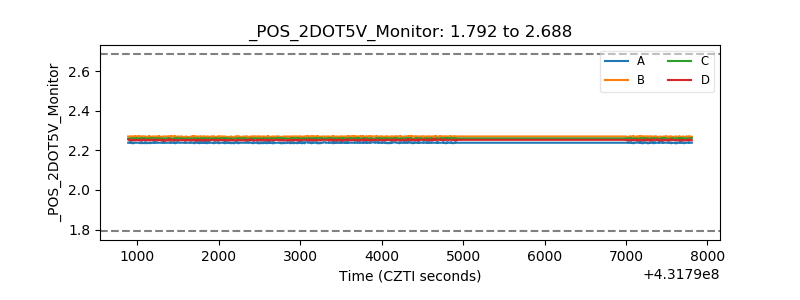 |
| +5 Volts monitor | 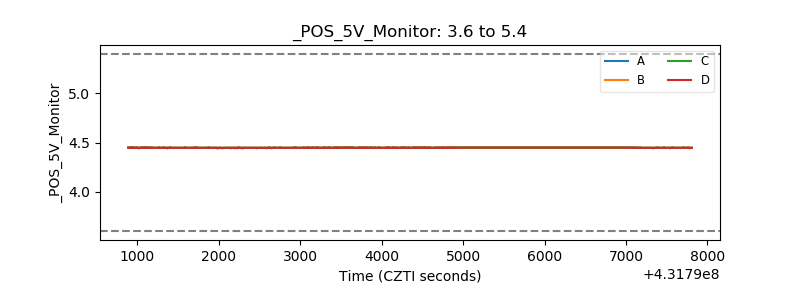 |
| _ROLL_ROT | 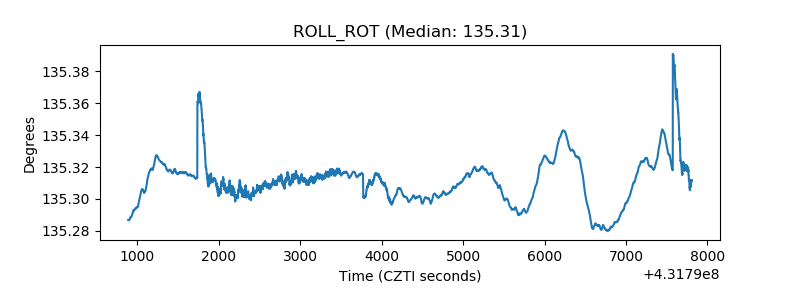 |
| _Roll_DEC |  |
| _Roll_RA | 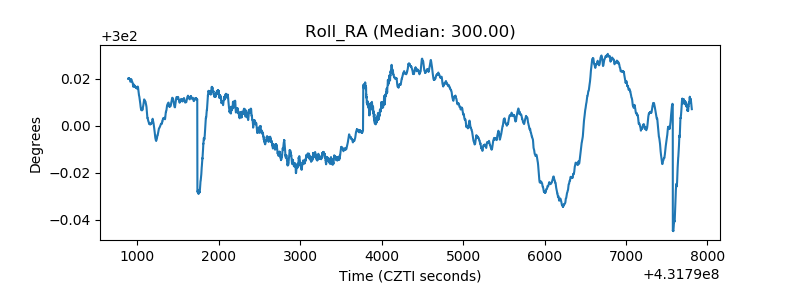 |
| Veto Counter | 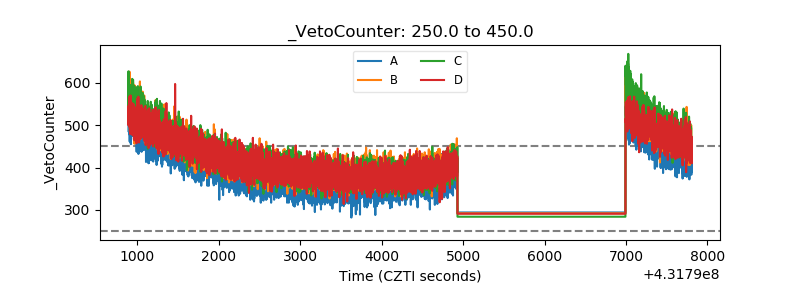 |