| Param | Original file | Final file |
|---|---|---|
| Filename | modeM0/AS1T05_143T01_9000005834_42953cztM0_level2.fits | modeM0/AS1T05_143T01_9000005834_42953cztM0_level2_quad_clean.evt |
| Size (bytes) | 328,227,840 | 87,514,560 |
| Size | 313.0 MB | 83.5 MB |
| Events in quadrant A | 3,116,747 | 598,960 |
| Events in quadrant B | 2,517,125 | 612,506 |
| Events in quadrant C | 2,486,377 | 586,890 |
| Events in quadrant D | 3,645,394 | 505,501 |
| Mode SS | |||
|---|---|---|---|
| Quadrant | BADHDUFLAG | Total packets | Discarded packets |
| A | 0 | 102 | 0 |
| B | 0 | 102 | 0 |
| C | 0 | 102 | 0 |
| D | 0 | 102 | 0 |
| Mode M0 | |||
|---|---|---|---|
| Quadrant | BADHDUFLAG | Total packets | Discarded packets |
| A | 0 | 12382 | 2 |
| B | 0 | 10829 | 2 |
| C | 0 | 10407 | 2 |
| D | 0 | 14221 | 2 |
| Mode M9 | |||
|---|---|---|---|
| Quadrant | BADHDUFLAG | Total packets | Discarded packets |
| A | 0 | 28 | 0 |
| B | 0 | 29 | 0 |
| C | 0 | 29 | 0 |
| D | 0 | 29 | 0 |
| Quadrant | Total seconds | Saturated seconds | Saturation percentage |
|---|---|---|---|
| A | 4931 | 92 | 1.865747% |
| B | 4931 | 45 | 0.912594% |
| C | 4931 | 29 | 0.588116% |
| D | 4931 | 430 | 8.720341% |
Noise dominated data is calculated using 1-second bins in cleaned event files. If a bin has >2000 counts, and if more than 50% of those come from <1% of pixels, then it is considered to be noise-dominated and hence unusable.
| Quadrant | # 1 sec bins | Bins with >0 counts | Bins with >2000 counts | High rate bins dominated by noise | Noise dominated (total time) | Noise dominated (detector-on time) | Marked lightcurve |
|---|---|---|---|---|---|---|---|
| A | 7054 | 4932 | 68 | 68 | 0.96% | 1.38% | 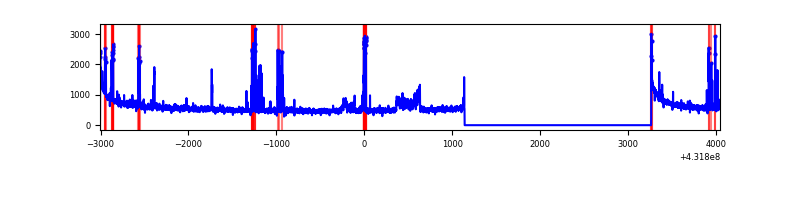 |
| B | 7053 | 4930 | 36 | 36 | 0.51% | 0.73% | 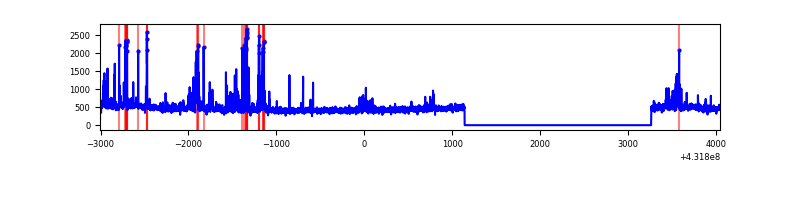 |
| C | 7053 | 4930 | 29 | 29 | 0.41% | 0.59% | 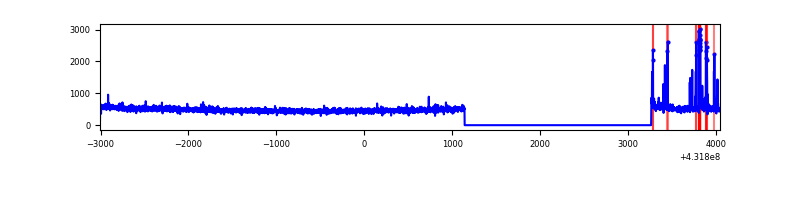 |
| D | 7053 | 4930 | 407 | 407 | 5.77% | 8.26% | 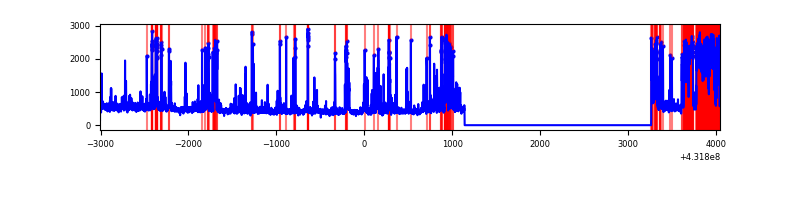 |
Top three noisy pixels from each quadrant. If the there are fewer than three noisy pixels in the level2.evt file, extra rows are filled as -1
| Pixel properties | Quadrant properties | ||||||
|---|---|---|---|---|---|---|---|
| Quadrant | DetID | PixID | Counts | Sigma | Mean | Median | Sigma |
| A | 10 | 83 | 571813 | 5104.09 | 550 | 539 | 111.9 |
| A | 15 | 237 | 342218 | 3052.75 | 550 | 539 | 111.9 |
| A | 7 | 3 | 26362 | 230.72 | 550 | 539 | 111.9 |
| B | 4 | 171 | 208455 | 1987.44 | 553 | 538 | 104.6 |
| B | 3 | 112 | 42000 | 396.33 | 553 | 538 | 104.6 |
| B | 5 | 255 | 35695 | 336.06 | 553 | 538 | 104.6 |
| C | 15 | 214 | 200471 | 1572.21 | 550 | 554 | 127.2 |
| C | 12 | 2 | 124268 | 972.92 | 550 | 554 | 127.2 |
| C | 3 | 233 | 7406 | 53.89 | 550 | 554 | 127.2 |
| D | 10 | 118 | 894324 | 7010.17 | 527 | 513 | 127.5 |
| D | 12 | 6 | 310922 | 2434.54 | 527 | 513 | 127.5 |
| D | 1 | 52 | 109261 | 852.91 | 527 | 513 | 127.5 |
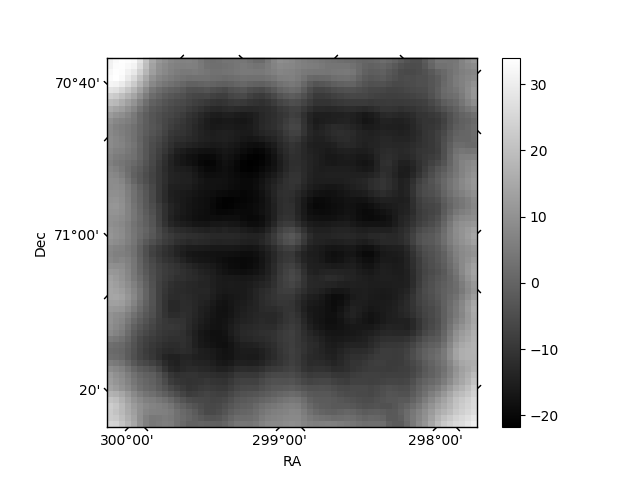
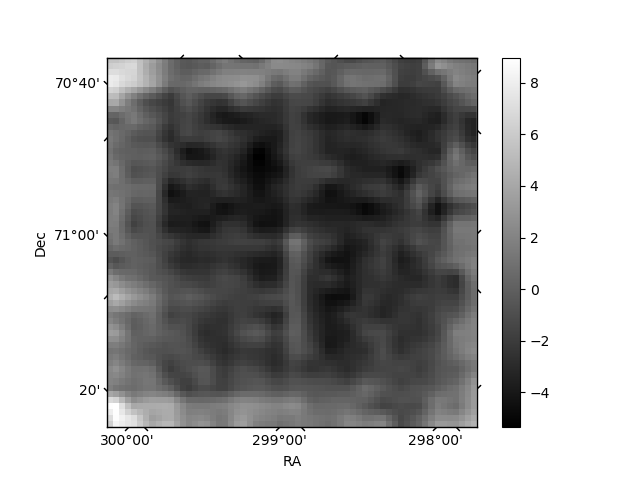
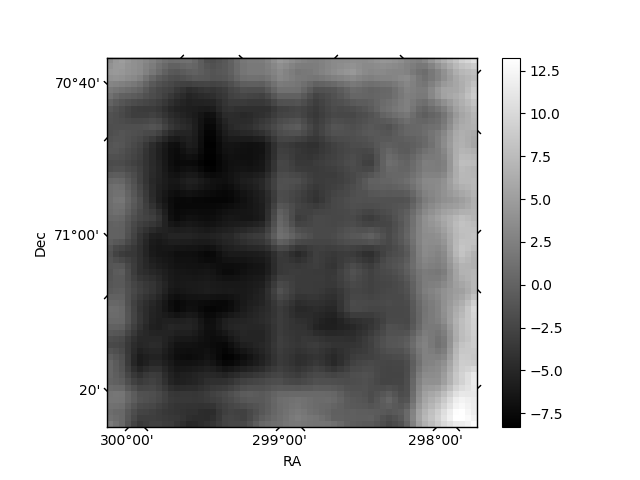
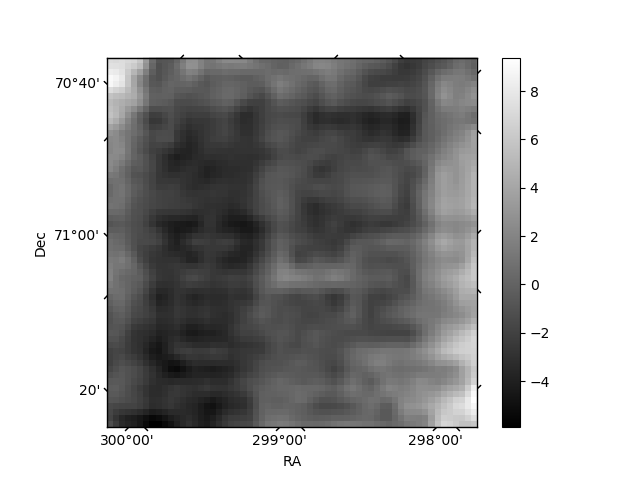
Histogram calculated using DETX and DETY for each event in the final _common_clean file
| Quadrant A | 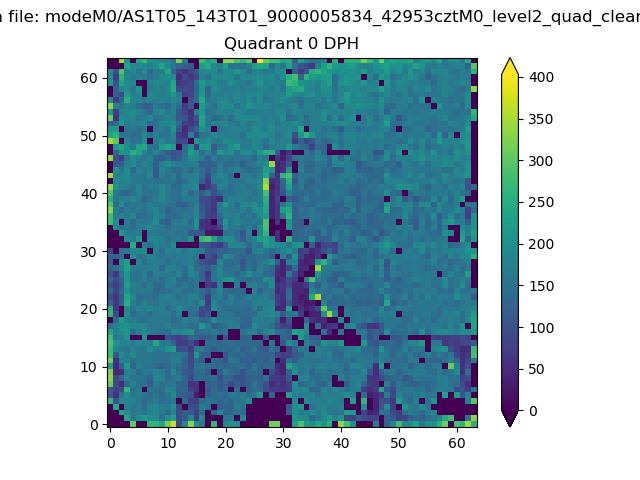 |
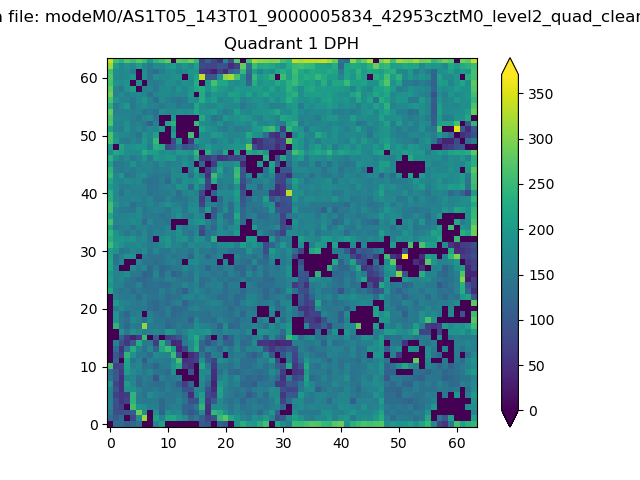 |
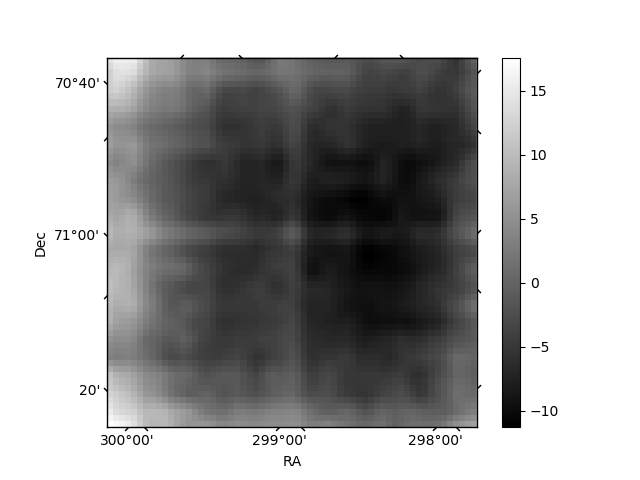
Quadrant B |
|---|---|---|---|
| Quadrant D | 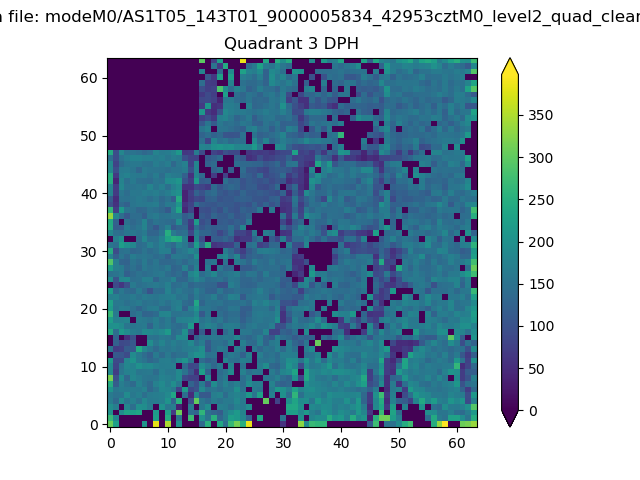 |
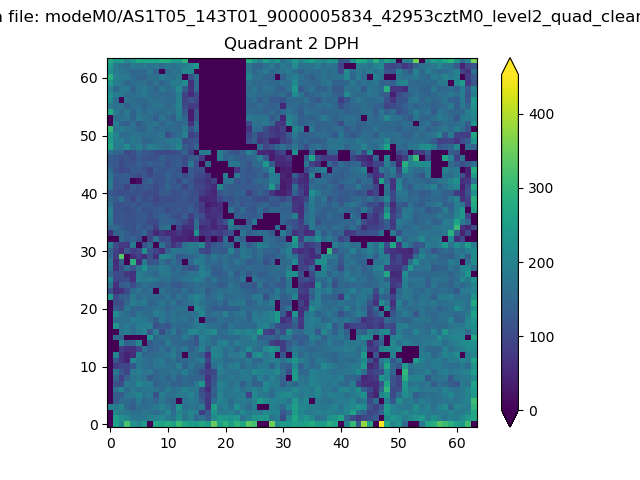 |
Quadrant C |
| Plot type | Count rate plots | Images |
|---|---|---|
| Comparison with Poisson distribution Blue bars denote a histogram of data divided into 1 sec bins. Red curve is a Poisson curve with rate = median count rate of data. |
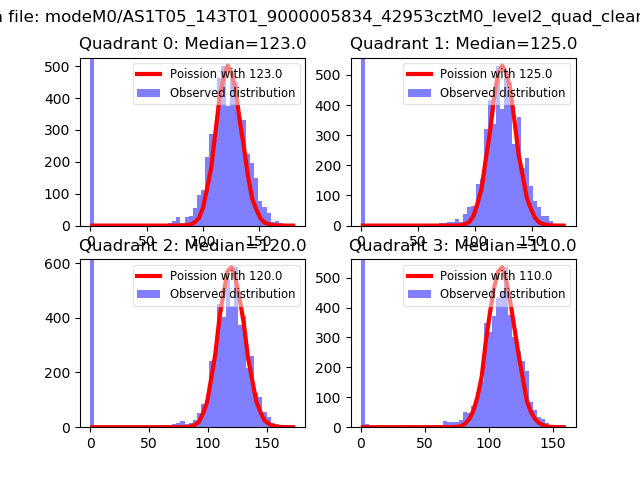 |
 |
| Quadrant-wise count rates Data is divided into 100 sec bins |
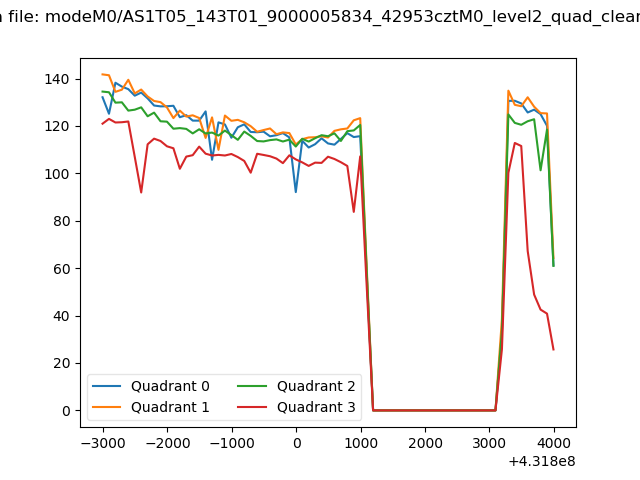 |
|
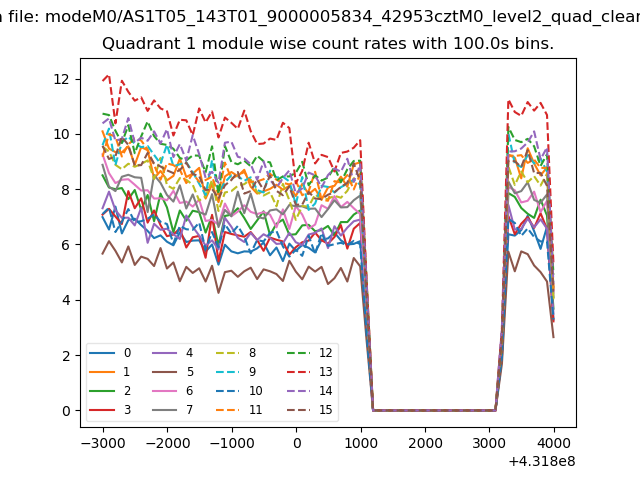
| Module-wise count rates for Quadrant A Data is divided into 100 sec bins |
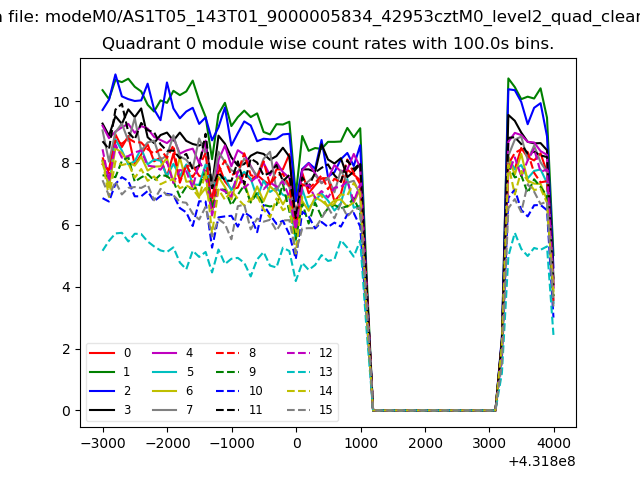 |
 |
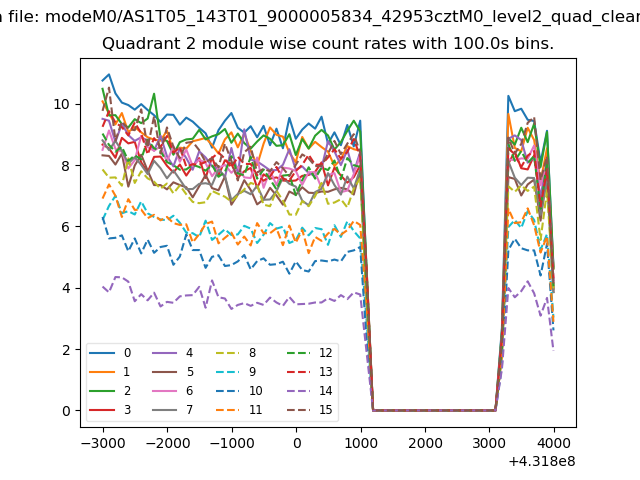
| Module-wise count rates for Quadrant B Data is divided into 100 sec bins |
 |
 |
| Module-wise count rates for Quadrant C Data is divided into 100 sec bins |
 |
 |
| Module-wise count rates for Quadrant D Data is divided into 100 sec bins |
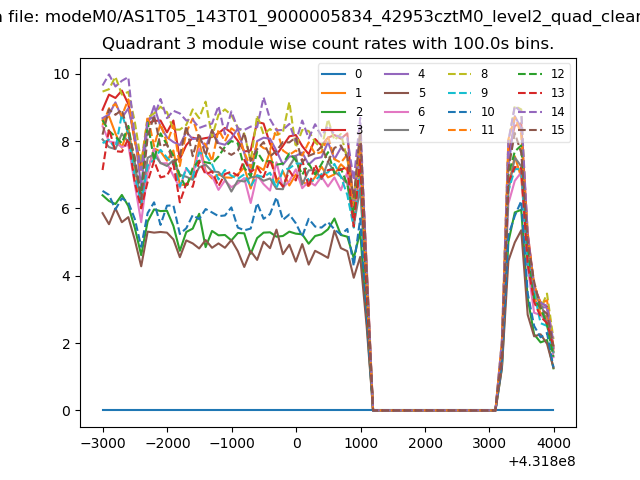 |
 |
| Parameter | Plot |
|---|---|
| CZT HV Monitor | 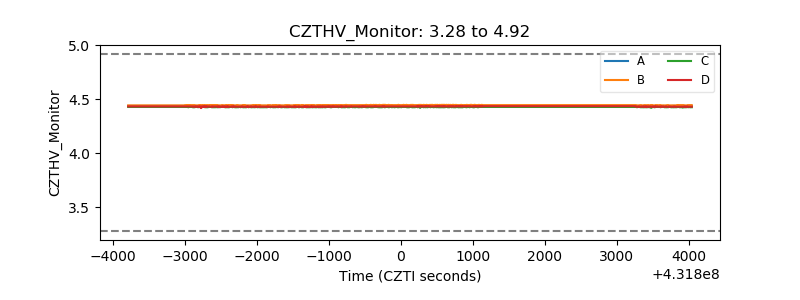 |
| D_VDD | 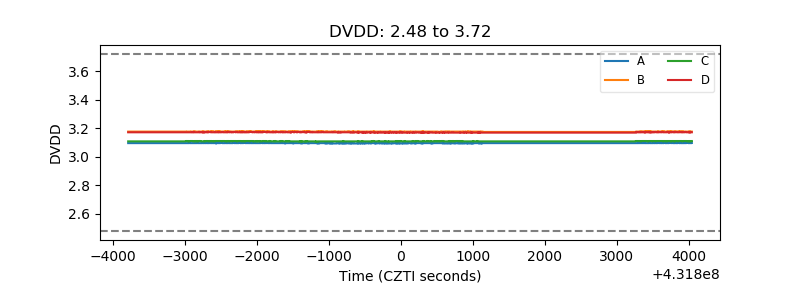 |
| Temperature 1 | 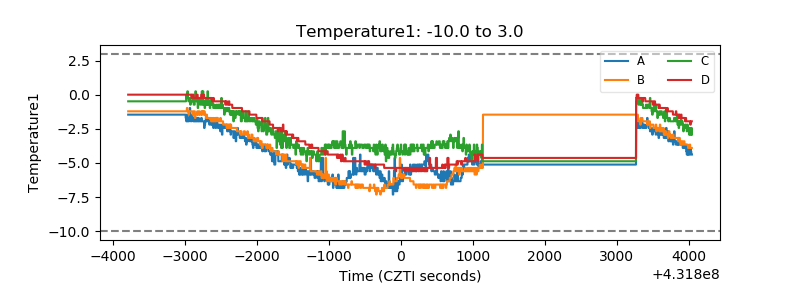 |
| Veto HV Monitor | 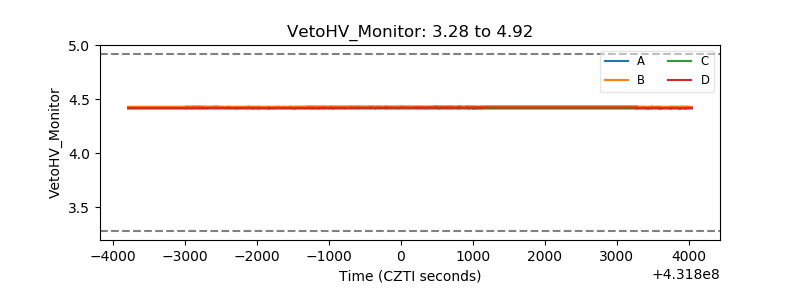 |
| Veto LLD | 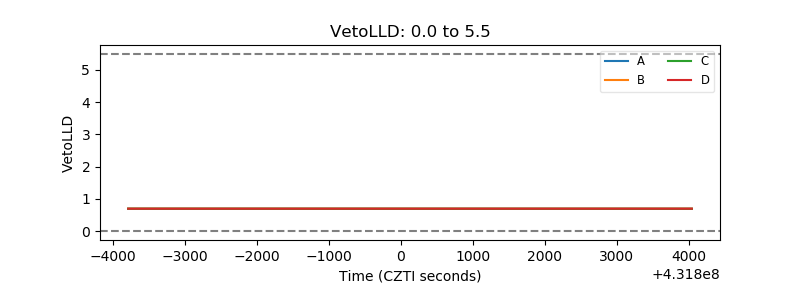 |
| Alpha Counter | 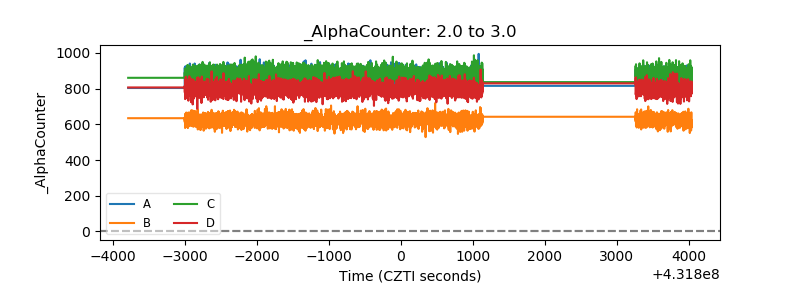 |
| _CPM_Rate | 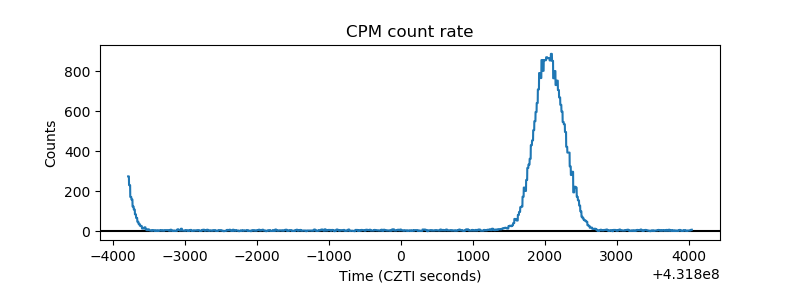 |
| CZT Counter | 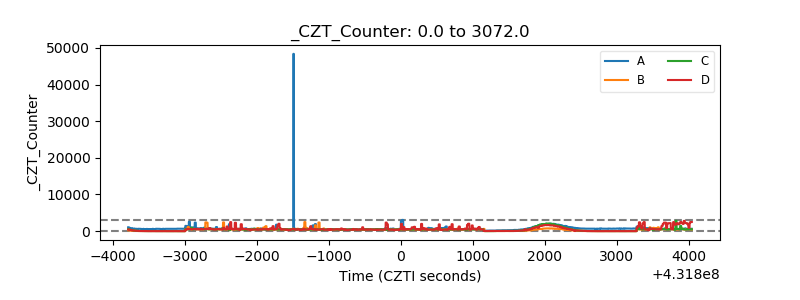 |
| +2.5 Volts monitor | 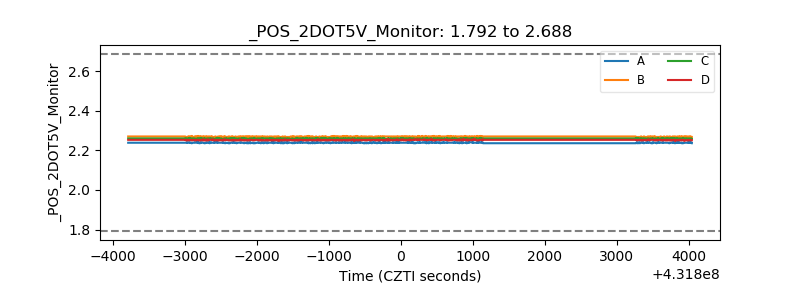 |
| +5 Volts monitor |  |
| _ROLL_ROT |  |
| _Roll_DEC | 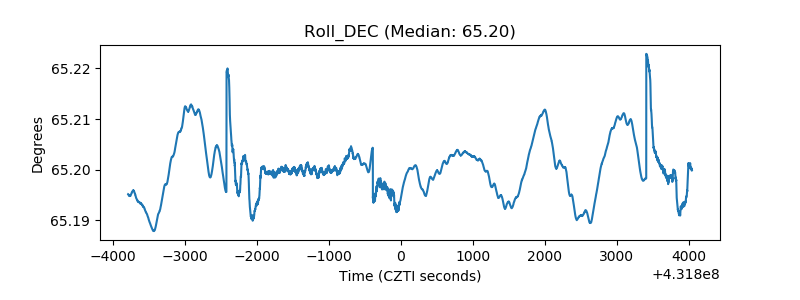 |
| _Roll_RA | 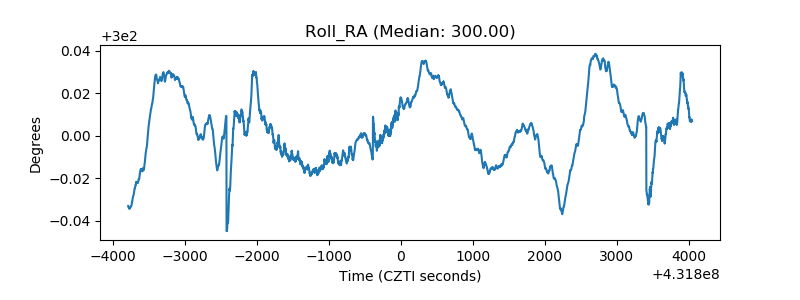 |
| Veto Counter |  |