| Param | Original file | Final file |
|---|---|---|
| Filename | modeM0/AS1T05_143T01_9000005834_42954cztM0_level2.fits | modeM0/AS1T05_143T01_9000005834_42954cztM0_level2_quad_clean.evt |
| Size (bytes) | 350,046,720 | 80,841,600 |
| Size | 333.8 MB | 77.1 MB |
| Events in quadrant A | 3,018,975 | 551,667 |
| Events in quadrant B | 2,653,841 | 568,693 |
| Events in quadrant C | 3,183,176 | 527,825 |
| Events in quadrant D | 3,725,066 | 460,273 |
| Mode SS | |||
|---|---|---|---|
| Quadrant | BADHDUFLAG | Total packets | Discarded packets |
| A | 0 | 100 | 0 |
| B | 0 | 100 | 0 |
| C | 0 | 100 | 0 |
| D | 0 | 100 | 0 |
| Mode M0 | |||
|---|---|---|---|
| Quadrant | BADHDUFLAG | Total packets | Discarded packets |
| A | 0 | 11991 | 2 |
| B | 0 | 11198 | 2 |
| C | 0 | 12589 | 2 |
| D | 0 | 14475 | 2 |
| Mode M9 | |||
|---|---|---|---|
| Quadrant | BADHDUFLAG | Total packets | Discarded packets |
| A | 0 | 28 | 0 |
| B | 0 | 29 | 0 |
| C | 0 | 29 | 0 |
| D | 0 | 29 | 0 |
| Quadrant | Total seconds | Saturated seconds | Saturation percentage |
|---|---|---|---|
| A | 4831 | 131 | 2.711654% |
| B | 4831 | 76 | 1.573173% |
| C | 4831 | 261 | 5.402608% |
| D | 4830 | 523 | 10.828157% |
Noise dominated data is calculated using 1-second bins in cleaned event files. If a bin has >2000 counts, and if more than 50% of those come from <1% of pixels, then it is considered to be noise-dominated and hence unusable.
| Quadrant | # 1 sec bins | Bins with >0 counts | Bins with >2000 counts | High rate bins dominated by noise | Noise dominated (total time) | Noise dominated (detector-on time) | Marked lightcurve |
|---|---|---|---|---|---|---|---|
| A | 6954 | 4832 | 100 | 100 | 1.44% | 2.07% | 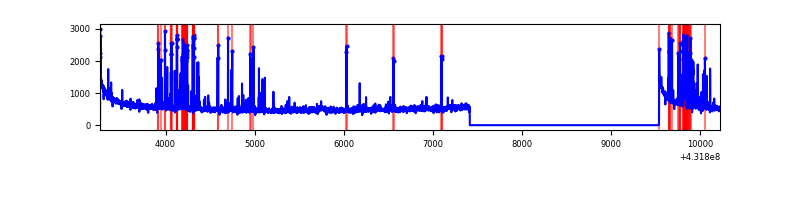 |
| B | 6953 | 4830 | 65 | 65 | 0.93% | 1.35% | 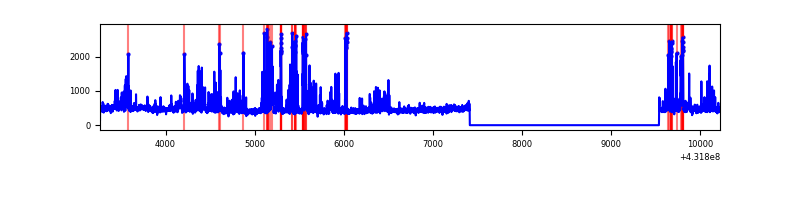 |
| C | 6953 | 4830 | 271 | 271 | 3.90% | 5.61% | 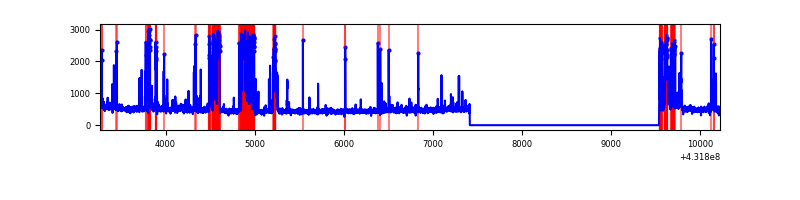 |
| D | 6952 | 4829 | 475 | 475 | 6.83% | 9.84% | 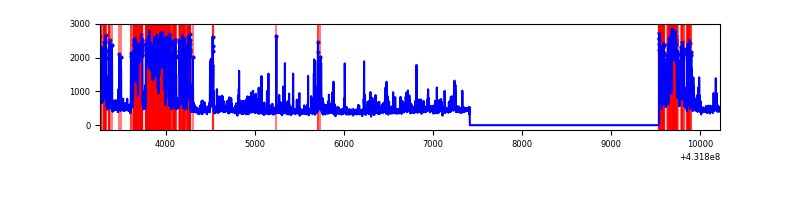 |
Top three noisy pixels from each quadrant. If the there are fewer than three noisy pixels in the level2.evt file, extra rows are filled as -1
| Pixel properties | Quadrant properties | ||||||
|---|---|---|---|---|---|---|---|
| Quadrant | DetID | PixID | Counts | Sigma | Mean | Median | Sigma |
| A | 10 | 83 | 546532 | 5158.19 | 516 | 506 | 105.9 |
| A | 15 | 237 | 434194 | 4096.96 | 516 | 506 | 105.9 |
| A | 15 | 222 | 18698 | 171.86 | 516 | 506 | 105.9 |
| B | 4 | 171 | 303207 | 3007.96 | 522 | 508 | 100.6 |
| B | 5 | 255 | 247458 | 2453.98 | 522 | 508 | 100.6 |
| B | 3 | 112 | 24877 | 242.16 | 522 | 508 | 100.6 |
| C | 12 | 2 | 942429 | 7928.06 | 511 | 514 | 118.8 |
| C | 15 | 214 | 194077 | 1629.21 | 511 | 514 | 118.8 |
| C | 14 | 254 | 49056 | 408.58 | 511 | 514 | 118.8 |
| D | 10 | 118 | 1248732 | 10334.32 | 493 | 480 | 120.8 |
| D | 12 | 233 | 134744 | 1111.58 | 493 | 480 | 120.8 |
| D | 12 | 6 | 115765 | 954.45 | 493 | 480 | 120.8 |
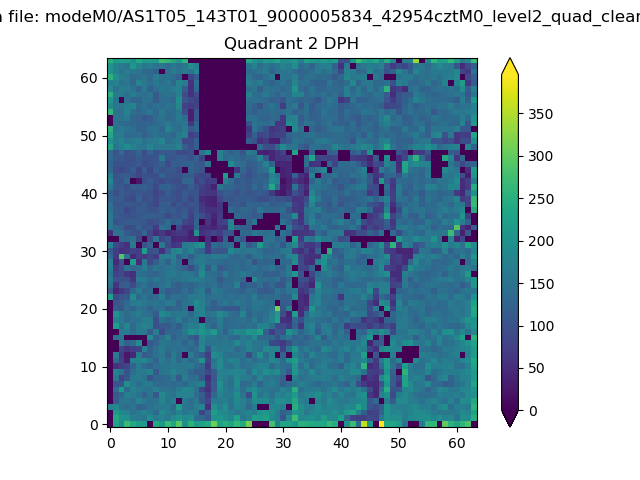
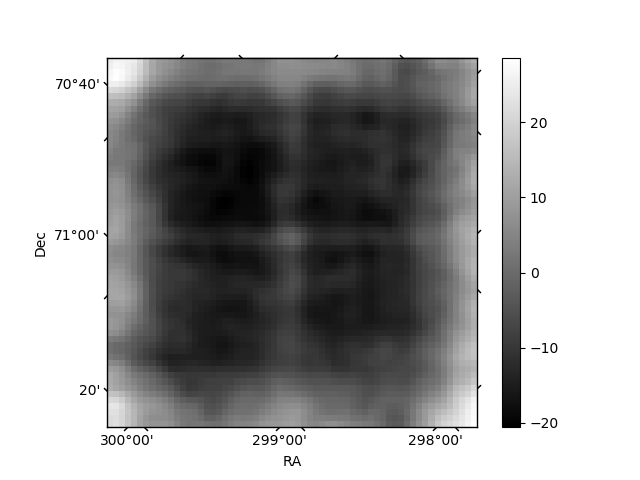
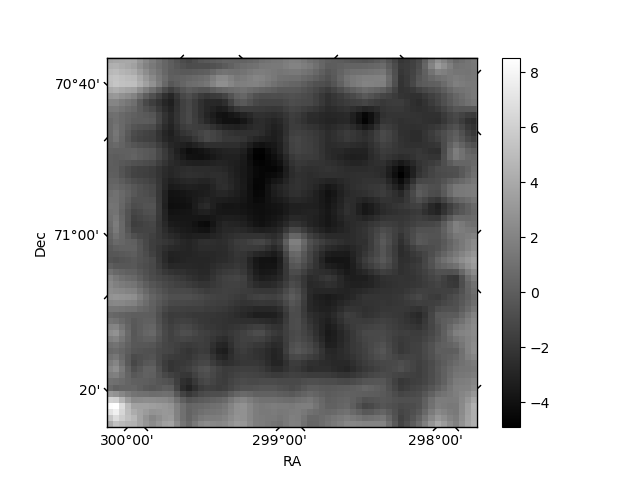
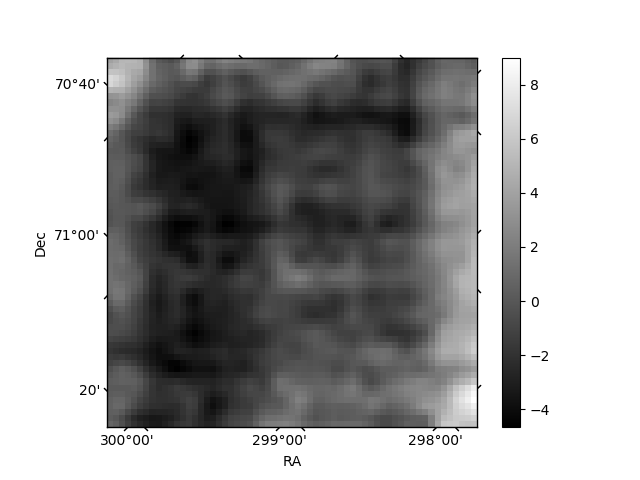
Histogram calculated using DETX and DETY for each event in the final _common_clean file
| Quadrant A | 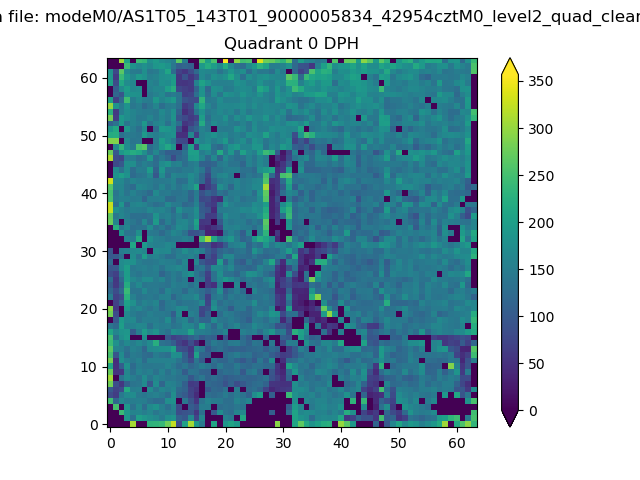 |
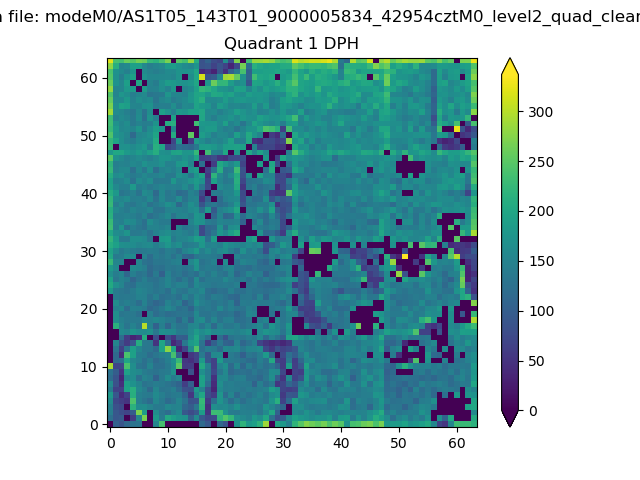 |
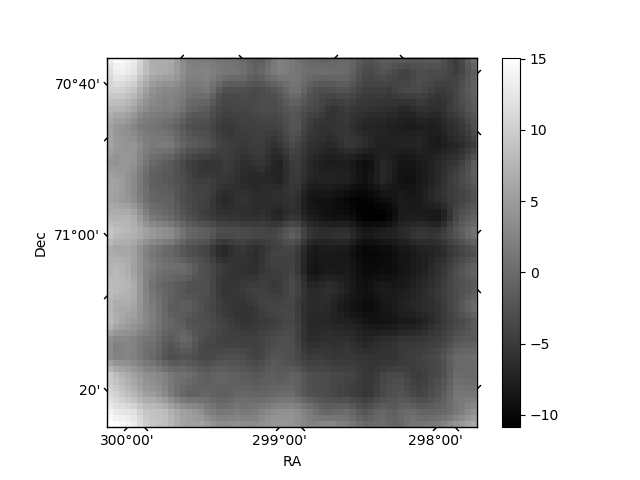
Quadrant B |
|---|---|---|---|
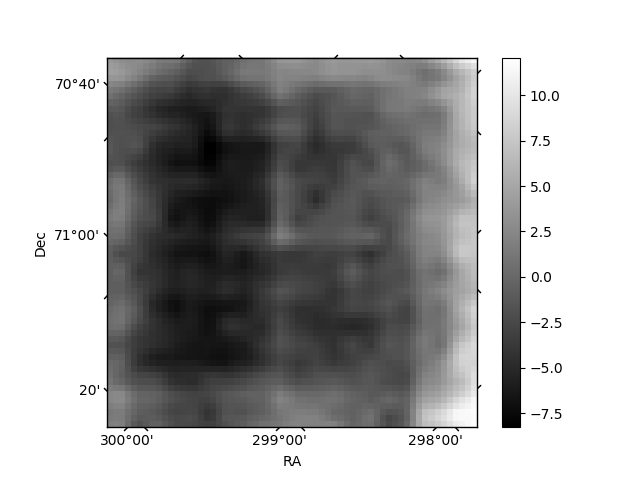
| Quadrant D | 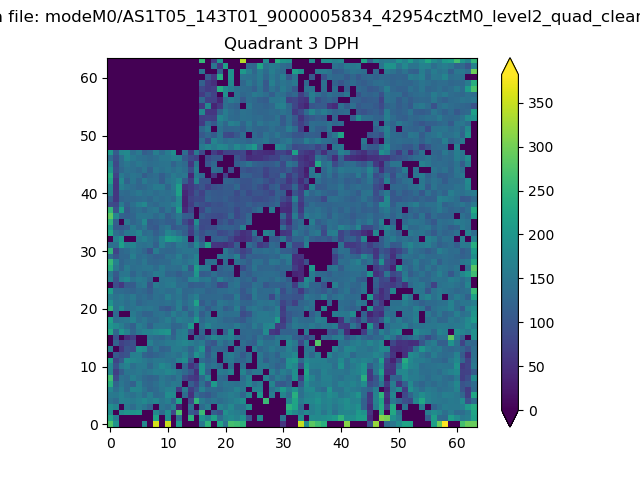 |
 |
Quadrant C |
| Plot type | Count rate plots | Images |
|---|---|---|
| Comparison with Poisson distribution Blue bars denote a histogram of data divided into 1 sec bins. Red curve is a Poisson curve with rate = median count rate of data. |
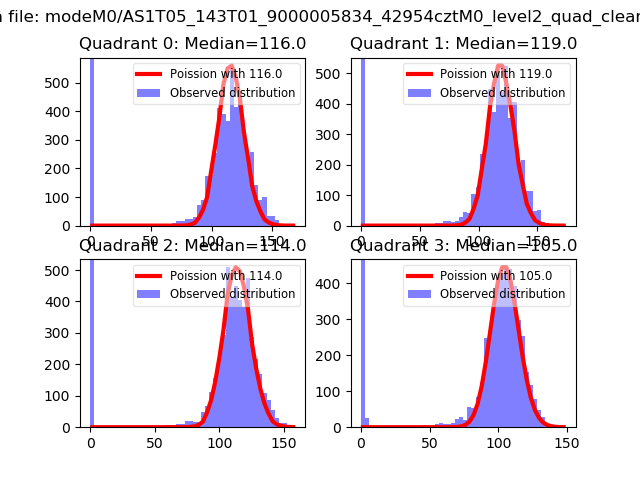 |
 |
| Quadrant-wise count rates Data is divided into 100 sec bins |
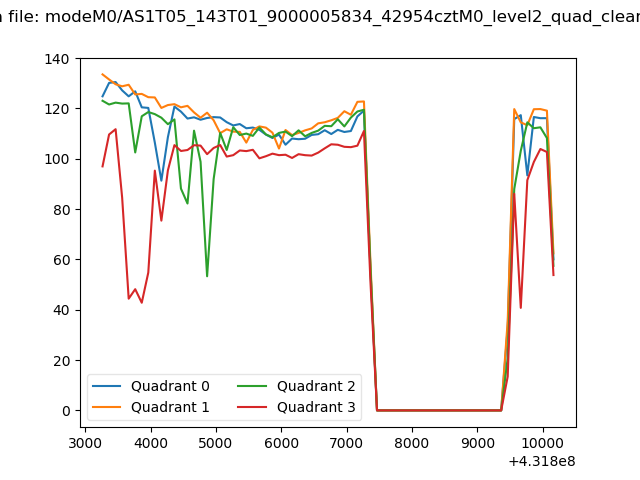 |
|
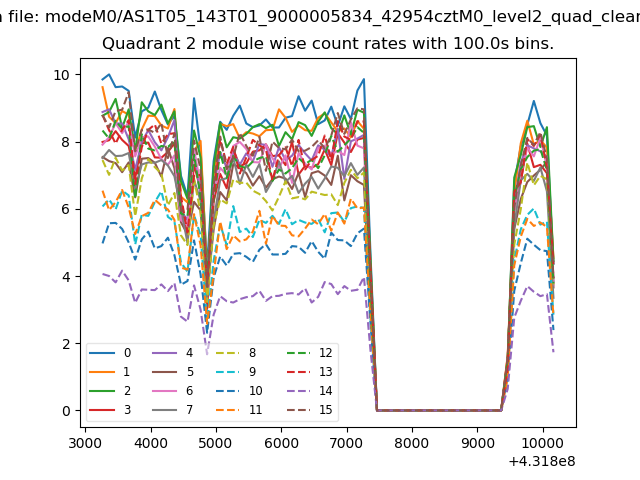
| Module-wise count rates for Quadrant A Data is divided into 100 sec bins |
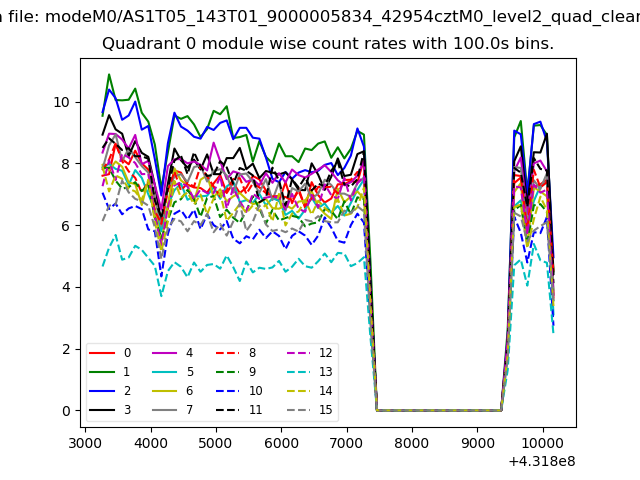 |
 |
| Module-wise count rates for Quadrant B Data is divided into 100 sec bins |
 |
 |
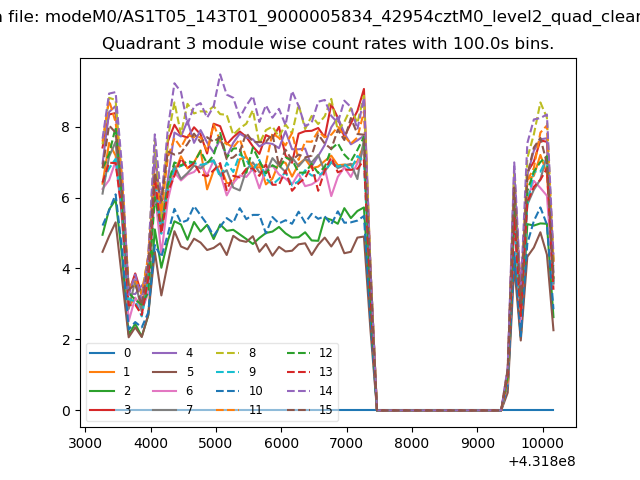
| Module-wise count rates for Quadrant C Data is divided into 100 sec bins |
 |
 |
| Module-wise count rates for Quadrant D Data is divided into 100 sec bins |
 |
 |
| Parameter | Plot |
|---|---|
| CZT HV Monitor |  |
| D_VDD | 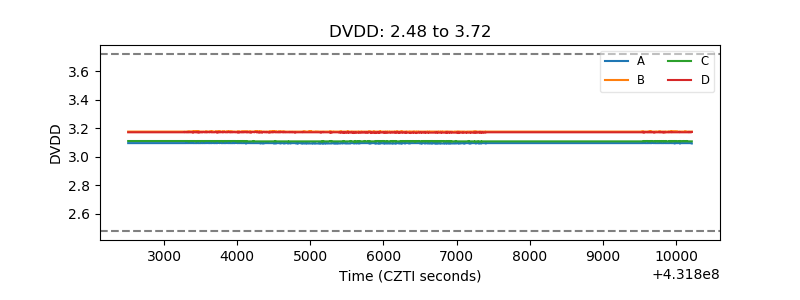 |
| Temperature 1 | 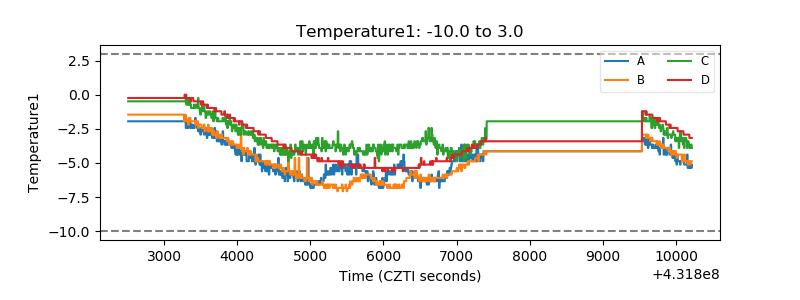 |
| Veto HV Monitor | 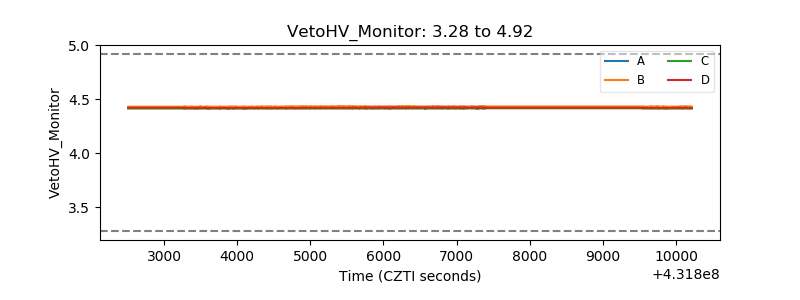 |
| Veto LLD | 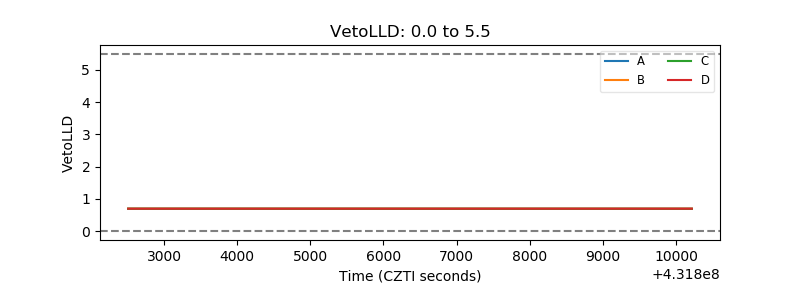 |
| Alpha Counter | 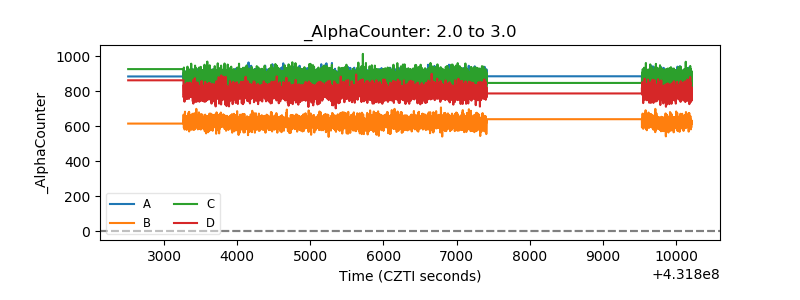 |
| _CPM_Rate | 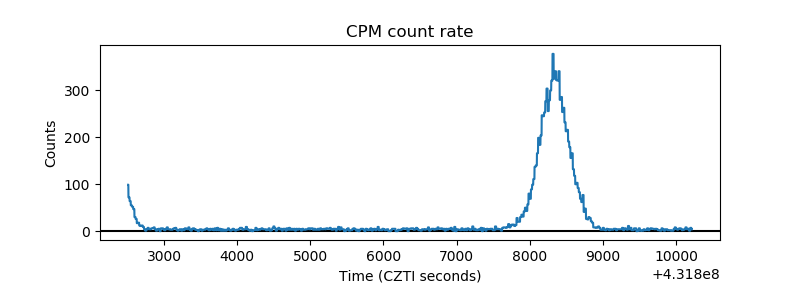 |
| CZT Counter | 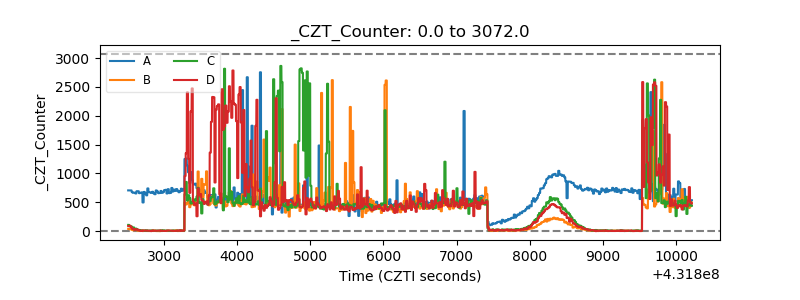 |
| +2.5 Volts monitor | 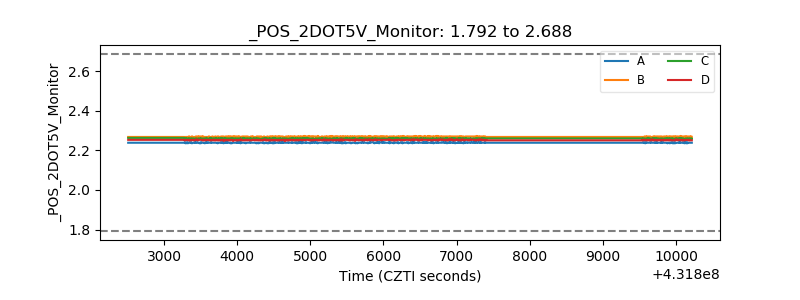 |
| +5 Volts monitor | 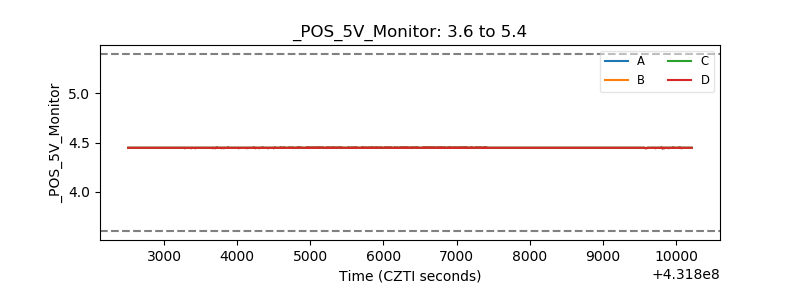 |
| _ROLL_ROT | 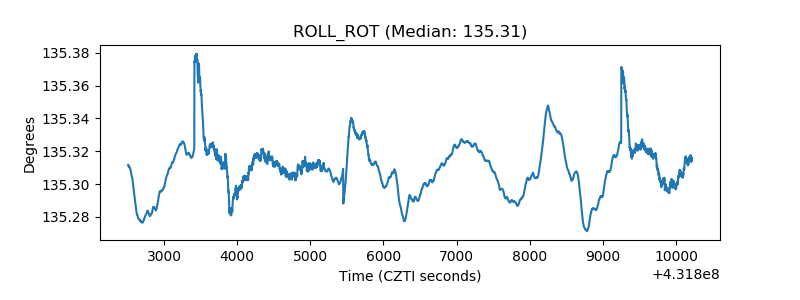 |
| _Roll_DEC |  |
| _Roll_RA | 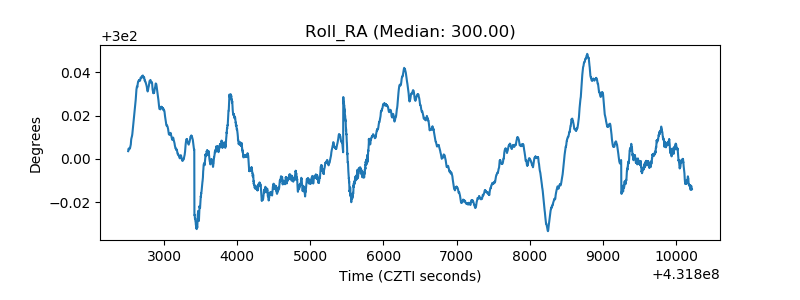 |
| Veto Counter | 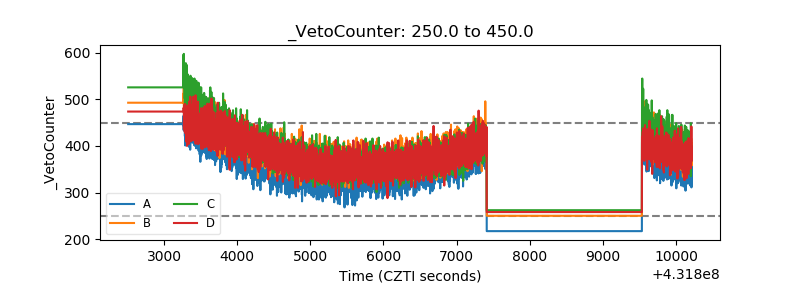 |