| Param | Original file | Final file |
|---|---|---|
| Filename | modeM0/AS1T05_143T01_9000005834_42956cztM0_level2.fits | modeM0/AS1T05_143T01_9000005834_42956cztM0_level2_quad_clean.evt |
| Size (bytes) | 316,304,640 | 89,452,800 |
| Size | 301.7 MB | 85.3 MB |
| Events in quadrant A | 3,101,784 | 590,517 |
| Events in quadrant B | 2,730,866 | 608,457 |
| Events in quadrant C | 2,537,886 | 586,809 |
| Events in quadrant D | 2,910,199 | 538,597 |
| Mode SS | |||
|---|---|---|---|
| Quadrant | BADHDUFLAG | Total packets | Discarded packets |
| A | 0 | 112 | 0 |
| B | 0 | 112 | 0 |
| C | 0 | 112 | 0 |
| D | 0 | 112 | 0 |
| Mode M0 | |||
|---|---|---|---|
| Quadrant | BADHDUFLAG | Total packets | Discarded packets |
| A | 0 | 12668 | 2 |
| B | 0 | 12172 | 2 |
| C | 0 | 11210 | 2 |
| D | 0 | 12648 | 2 |
| Mode M9 | |||
|---|---|---|---|
| Quadrant | BADHDUFLAG | Total packets | Discarded packets |
| A | 0 | 24 | 0 |
| B | 0 | 25 | 0 |
| C | 0 | 25 | 0 |
| D | 0 | 25 | 0 |
| Quadrant | Total seconds | Saturated seconds | Saturation percentage |
|---|---|---|---|
| A | 5488 | 102 | 1.858601% |
| B | 5488 | 87 | 1.585277% |
| C | 5488 | 23 | 0.419096% |
| D | 5488 | 68 | 1.239067% |
Noise dominated data is calculated using 1-second bins in cleaned event files. If a bin has >2000 counts, and if more than 50% of those come from <1% of pixels, then it is considered to be noise-dominated and hence unusable.
| Quadrant | # 1 sec bins | Bins with >0 counts | Bins with >2000 counts | High rate bins dominated by noise | Noise dominated (total time) | Noise dominated (detector-on time) | Marked lightcurve |
|---|---|---|---|---|---|---|---|
| A | 7101 | 5489 | 65 | 65 | 0.92% | 1.18% | 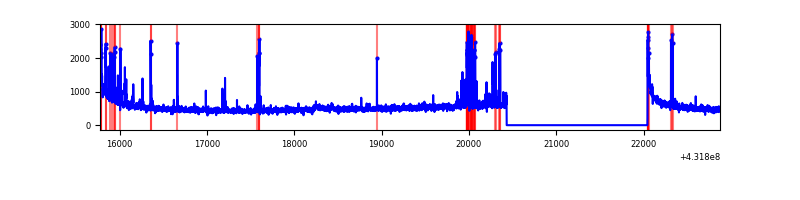 |
| B | 7100 | 5487 | 60 | 60 | 0.85% | 1.09% | 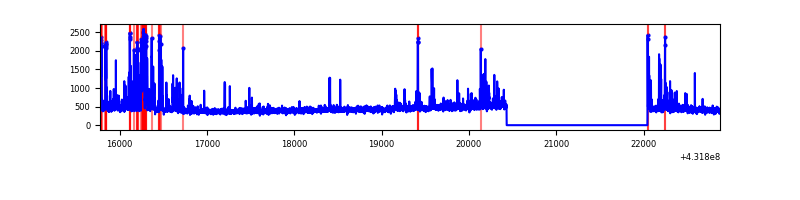 |
| C | 7100 | 5487 | 18 | 18 | 0.25% | 0.33% | 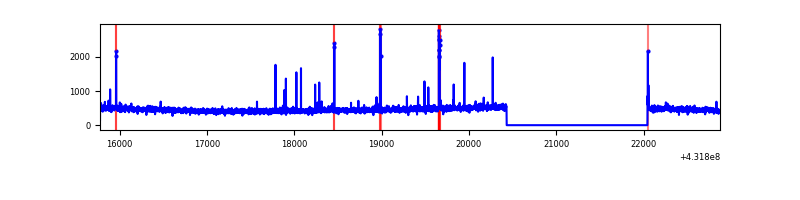 |
| D | 7100 | 5487 | 53 | 53 | 0.75% | 0.97% | 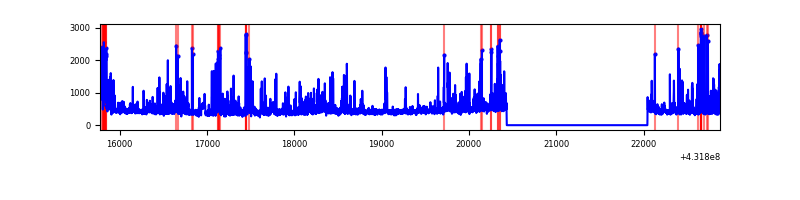 |
Top three noisy pixels from each quadrant. If the there are fewer than three noisy pixels in the level2.evt file, extra rows are filled as -1
| Pixel properties | Quadrant properties | ||||||
|---|---|---|---|---|---|---|---|
| Quadrant | DetID | PixID | Counts | Sigma | Mean | Median | Sigma |
| A | 10 | 83 | 565330 | 4781.36 | 576 | 563 | 118.1 |
| A | 15 | 237 | 261659 | 2210.46 | 576 | 563 | 118.1 |
| A | 15 | 222 | 21255 | 175.18 | 576 | 563 | 118.1 |
| B | 4 | 171 | 355036 | 3160.88 | 578 | 562 | 112.1 |
| B | 4 | 81 | 58619 | 517.7 | 578 | 562 | 112.1 |
| B | 5 | 255 | 26978 | 235.55 | 578 | 562 | 112.1 |
| C | 15 | 214 | 221626 | 1679.82 | 571 | 573 | 131.6 |
| C | 12 | 2 | 45306 | 339.93 | 571 | 573 | 131.6 |
| C | 14 | 254 | 32790 | 244.82 | 571 | 573 | 131.6 |
| D | 2 | 249 | 174218 | 1279.58 | 564 | 548 | 135.7 |
| D | 13 | 249 | 162031 | 1189.78 | 564 | 548 | 135.7 |
| D | 12 | 6 | 77996 | 570.63 | 564 | 548 | 135.7 |
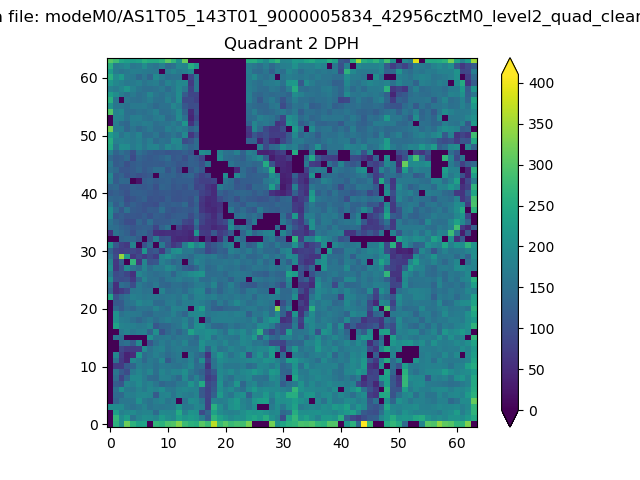
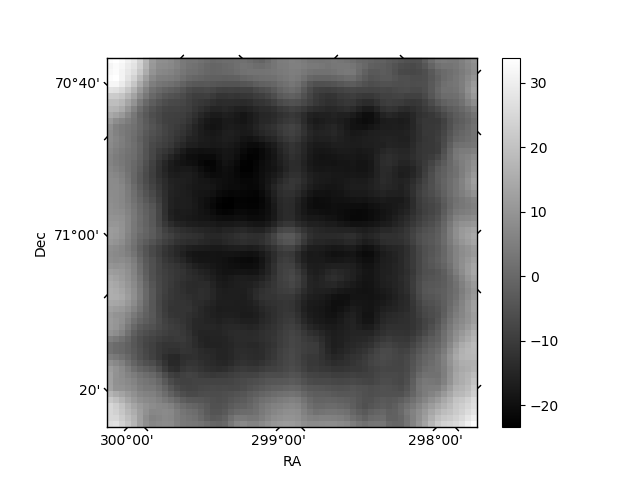
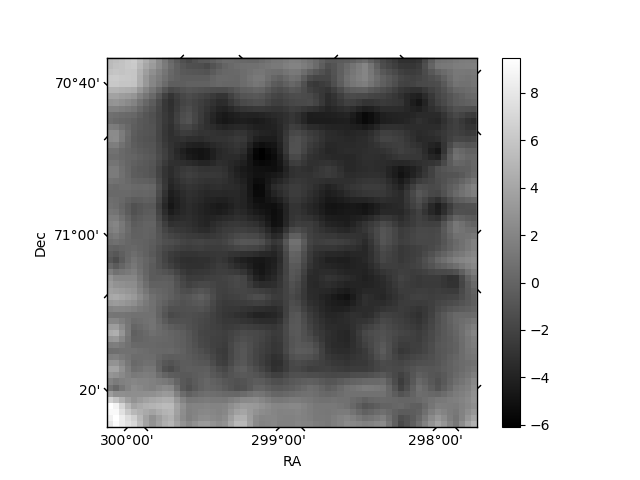
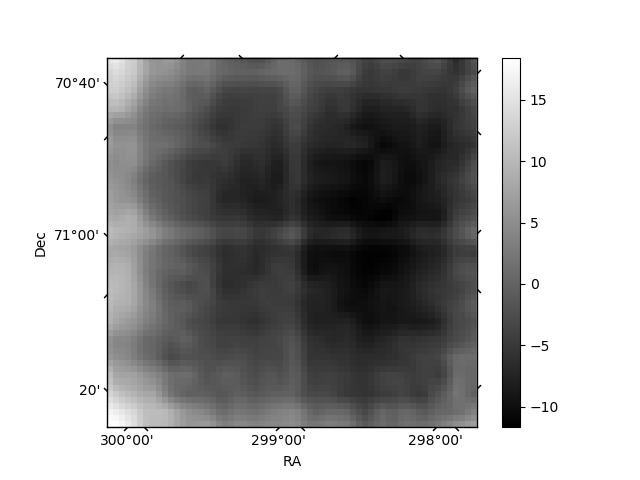
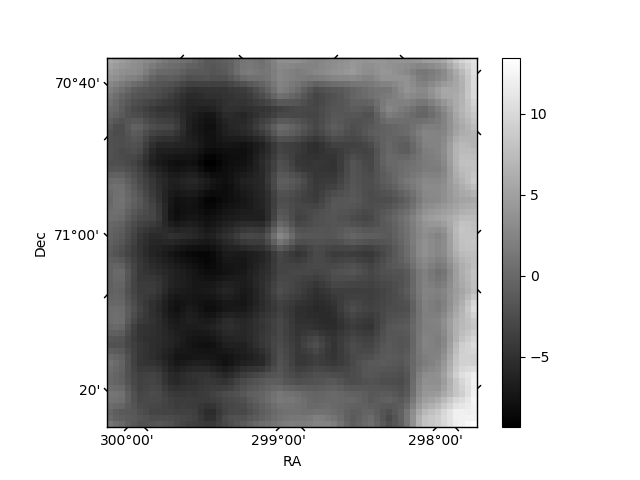
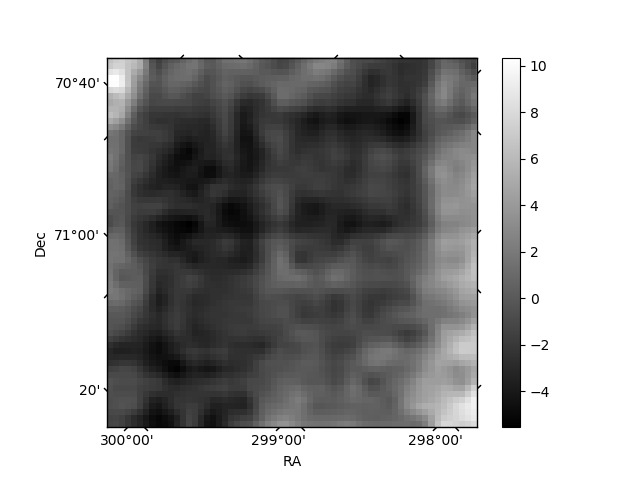
Histogram calculated using DETX and DETY for each event in the final _common_clean file
| Quadrant A | 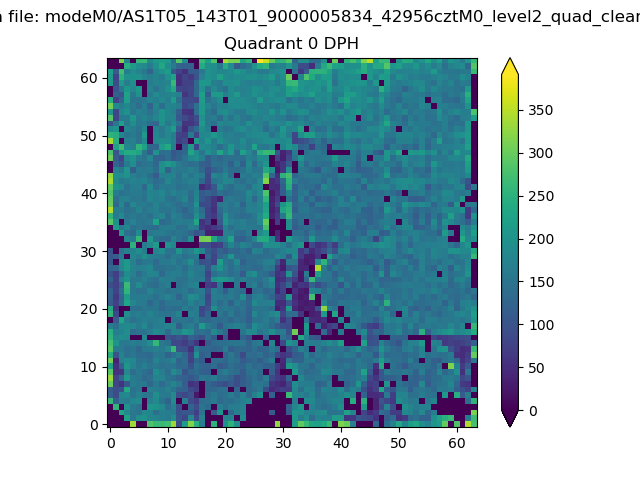 |
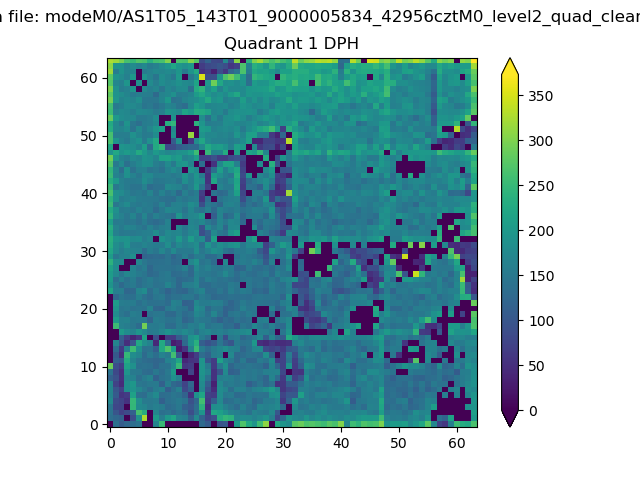 |
Quadrant B |
|---|---|---|---|
| Quadrant D | 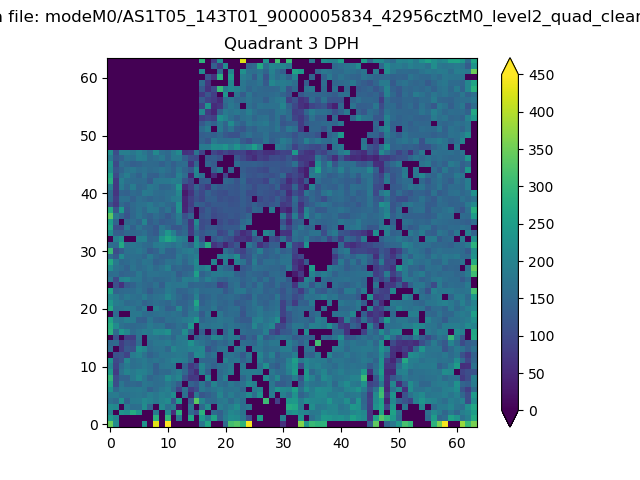 |
 |
Quadrant C |
| Plot type | Count rate plots | Images |
|---|---|---|
| Comparison with Poisson distribution Blue bars denote a histogram of data divided into 1 sec bins. Red curve is a Poisson curve with rate = median count rate of data. |
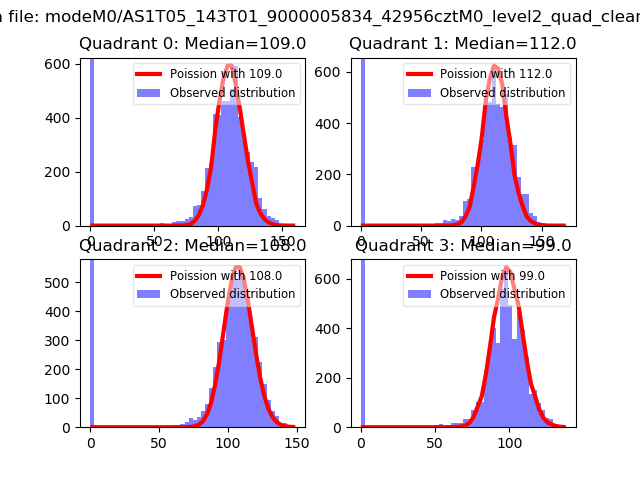 |
 |
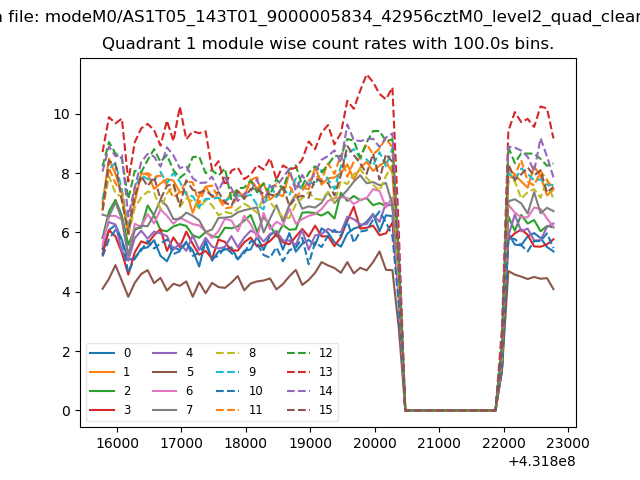
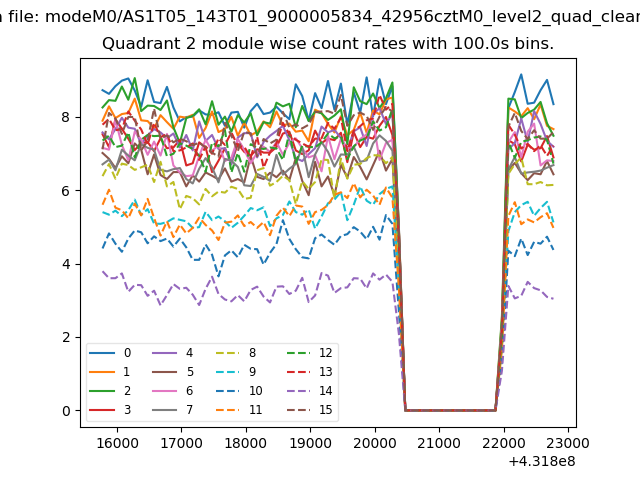
| Quadrant-wise count rates Data is divided into 100 sec bins |
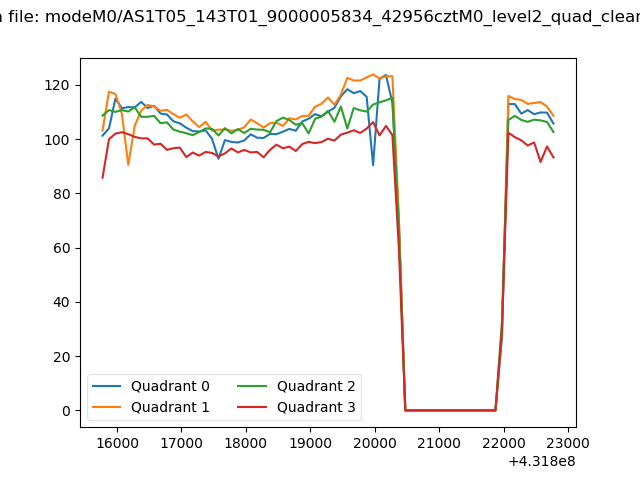 |
|
| Module-wise count rates for Quadrant A Data is divided into 100 sec bins |
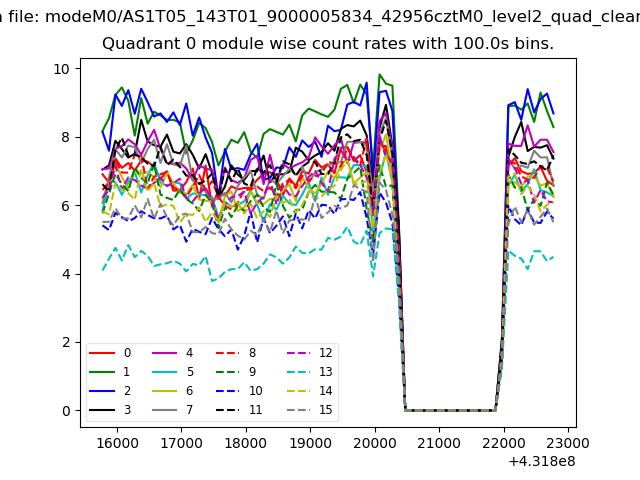 |
 |
| Module-wise count rates for Quadrant B Data is divided into 100 sec bins |
 |
 |
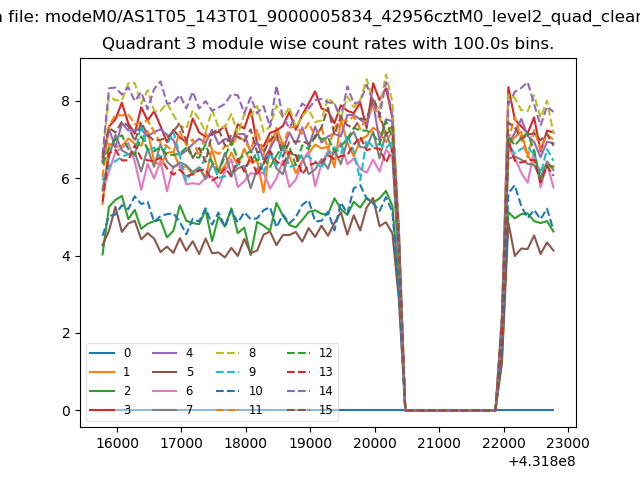
| Module-wise count rates for Quadrant C Data is divided into 100 sec bins |
 |
 |
| Module-wise count rates for Quadrant D Data is divided into 100 sec bins |
 |
 |
| Parameter | Plot |
|---|---|
| CZT HV Monitor | 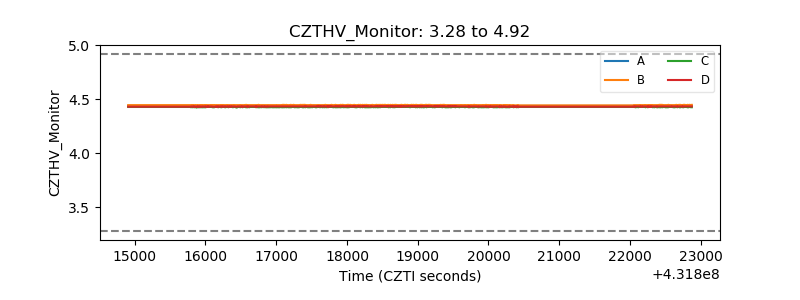 |
| D_VDD | 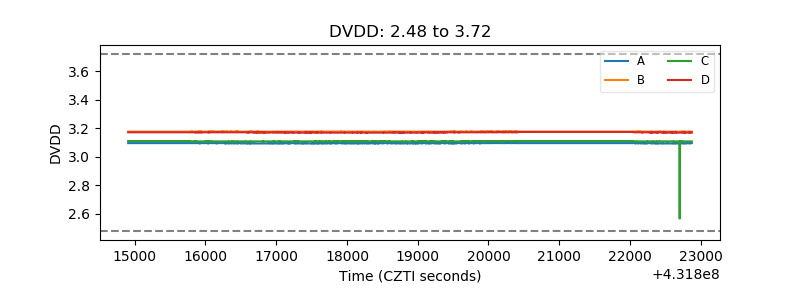 |
| Temperature 1 | 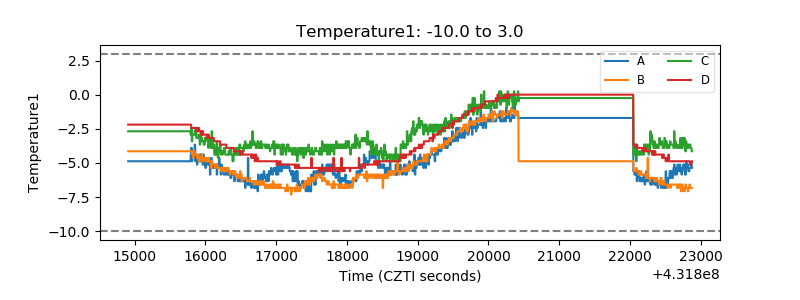 |
| Veto HV Monitor | 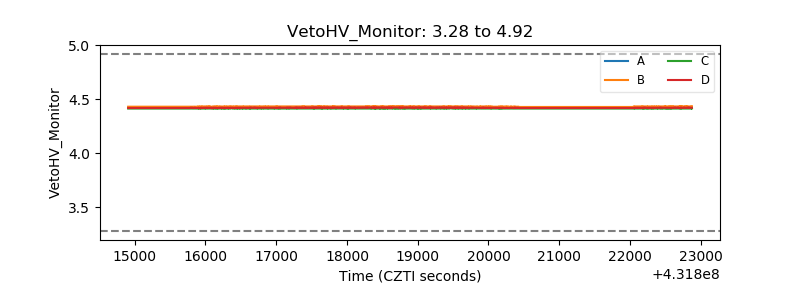 |
| Veto LLD | 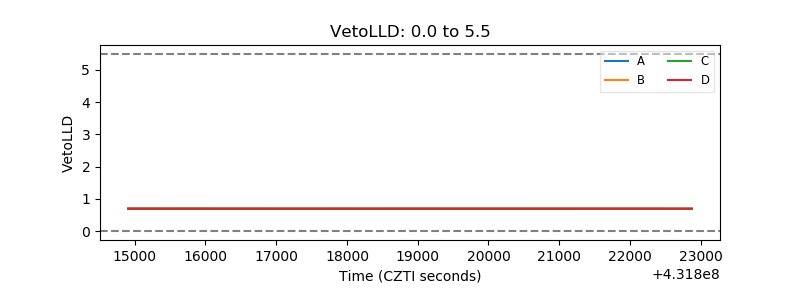 |
| Alpha Counter | 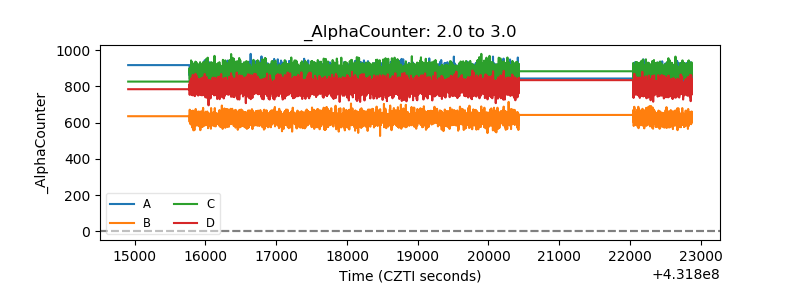 |
| _CPM_Rate | 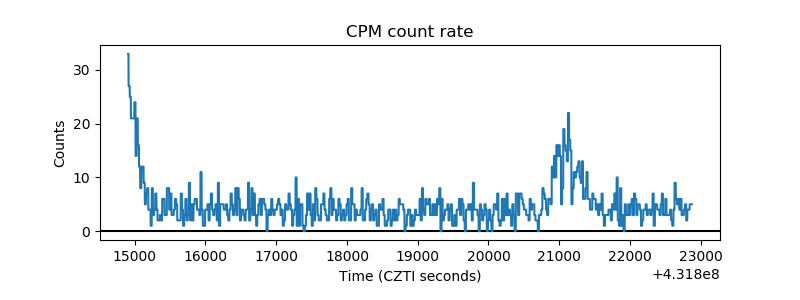 |
| CZT Counter | 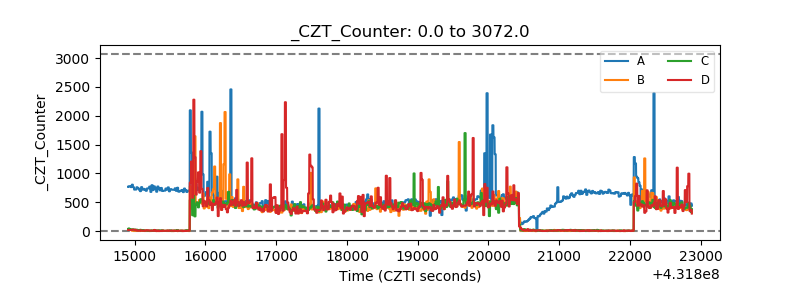 |
| +2.5 Volts monitor | 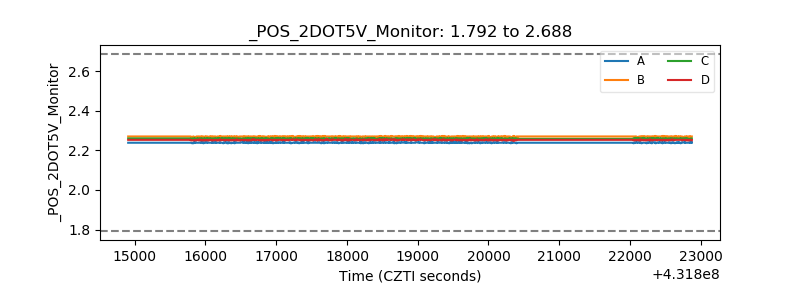 |
| +5 Volts monitor | 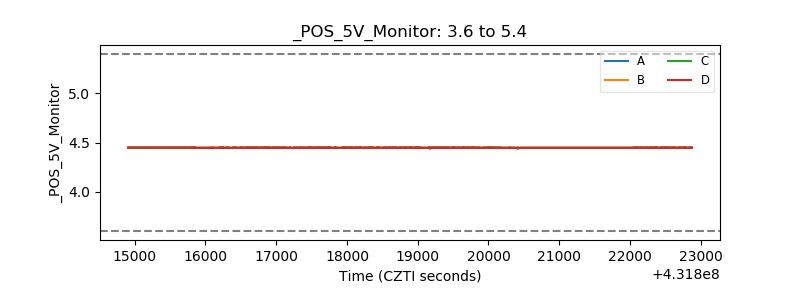 |
| _ROLL_ROT |  |
| _Roll_DEC | 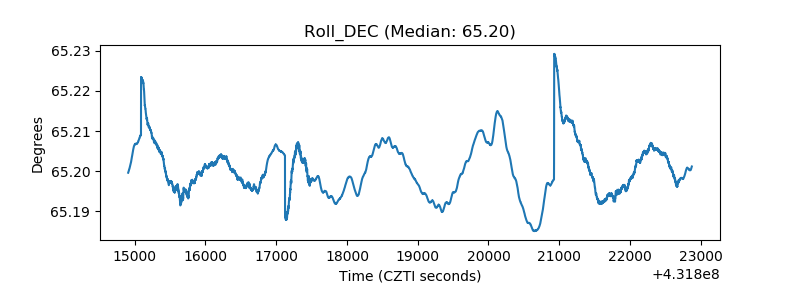 |
| _Roll_RA | 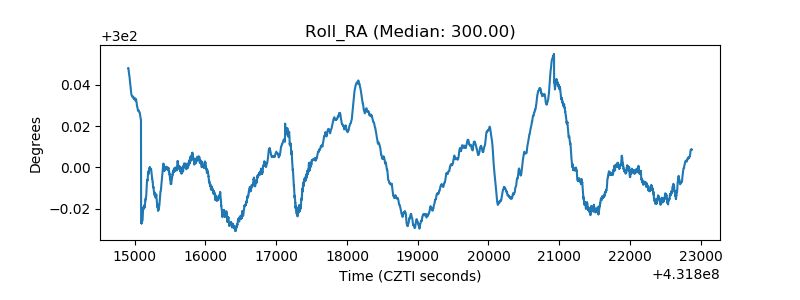 |
| Veto Counter | 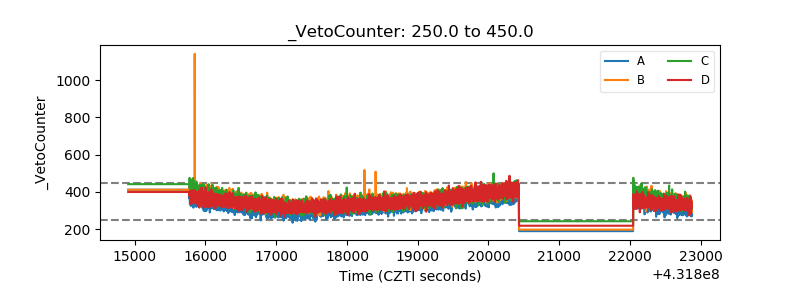 |