| Param | Original file | Final file |
|---|---|---|
| Filename | modeM0/AS1T05_143T01_9000005834_42958cztM0_level2.fits | modeM0/AS1T05_143T01_9000005834_42958cztM0_level2_quad_clean.evt |
| Size (bytes) | 354,199,680 | 91,177,920 |
| Size | 337.8 MB | 87.0 MB |
| Events in quadrant A | 3,240,229 | 609,788 |
| Events in quadrant B | 2,657,014 | 629,662 |
| Events in quadrant C | 2,947,063 | 596,007 |
| Events in quadrant D | 3,827,923 | 531,088 |
| Mode SS | |||
|---|---|---|---|
| Quadrant | BADHDUFLAG | Total packets | Discarded packets |
| A | 0 | 116 | 0 |
| B | 0 | 116 | 0 |
| C | 0 | 116 | 0 |
| D | 0 | 116 | 0 |
| Mode M0 | |||
|---|---|---|---|
| Quadrant | BADHDUFLAG | Total packets | Discarded packets |
| A | 0 | 13223 | 2 |
| B | 0 | 11959 | 2 |
| C | 0 | 12427 | 2 |
| D | 0 | 15388 | 2 |
| Mode M9 | |||
|---|---|---|---|
| Quadrant | BADHDUFLAG | Total packets | Discarded packets |
| A | 0 | 30 | 0 |
| B | 0 | 30 | 0 |
| C | 0 | 30 | 0 |
| D | 0 | 30 | 0 |
| Quadrant | Total seconds | Saturated seconds | Saturation percentage |
|---|---|---|---|
| A | 5638 | 85 | 1.507627% |
| B | 5639 | 15 | 0.266005% |
| C | 5639 | 61 | 1.081752% |
| D | 5639 | 329 | 5.834368% |
Noise dominated data is calculated using 1-second bins in cleaned event files. If a bin has >2000 counts, and if more than 50% of those come from <1% of pixels, then it is considered to be noise-dominated and hence unusable.
| Quadrant | # 1 sec bins | Bins with >0 counts | Bins with >2000 counts | High rate bins dominated by noise | Noise dominated (total time) | Noise dominated (detector-on time) | Marked lightcurve |
|---|---|---|---|---|---|---|---|
| A | 8624 | 5640 | 56 | 56 | 0.65% | 0.99% | 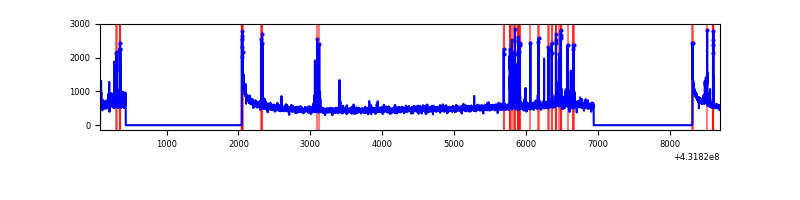 |
| B | 8625 | 5640 | 5 | 5 | 0.06% | 0.09% | 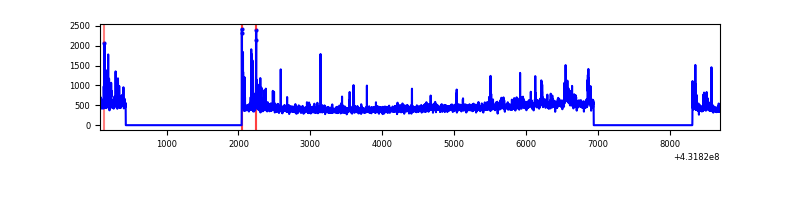 |
| C | 8625 | 5640 | 64 | 64 | 0.74% | 1.13% | 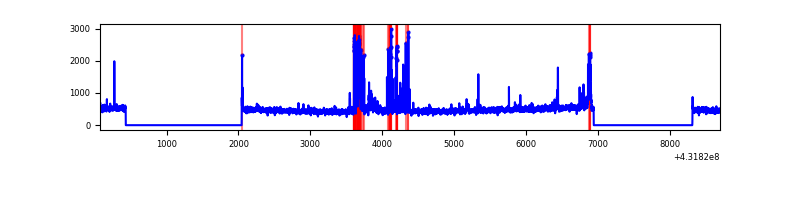 |
| D | 8625 | 5640 | 351 | 351 | 4.07% | 6.22% | 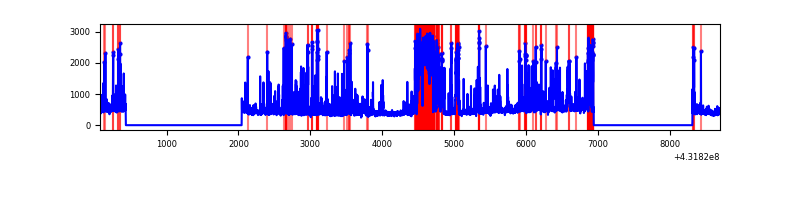 |
Top three noisy pixels from each quadrant. If the there are fewer than three noisy pixels in the level2.evt file, extra rows are filled as -1
| Pixel properties | Quadrant properties | ||||||
|---|---|---|---|---|---|---|---|
| Quadrant | DetID | PixID | Counts | Sigma | Mean | Median | Sigma |
| A | 10 | 83 | 580872 | 4625.48 | 609 | 598 | 125.5 |
| A | 15 | 237 | 263053 | 2092.08 | 609 | 598 | 125.5 |
| A | 13 | 6 | 14874 | 113.8 | 609 | 598 | 125.5 |
| B | 4 | 171 | 104565 | 878.04 | 609 | 593 | 118.4 |
| B | 4 | 81 | 81269 | 681.31 | 609 | 593 | 118.4 |
| B | 4 | 249 | 42017 | 349.82 | 609 | 593 | 118.4 |
| C | 12 | 2 | 270175 | 1930.11 | 598 | 600 | 139.7 |
| C | 15 | 214 | 224228 | 1601.14 | 598 | 600 | 139.7 |
| C | 5 | 250 | 87291 | 620.69 | 598 | 600 | 139.7 |
| D | 12 | 6 | 719824 | 5083.2 | 584 | 568 | 141.5 |
| D | 13 | 249 | 361341 | 2549.69 | 584 | 568 | 141.5 |
| D | 12 | 2 | 118581 | 834.03 | 584 | 568 | 141.5 |
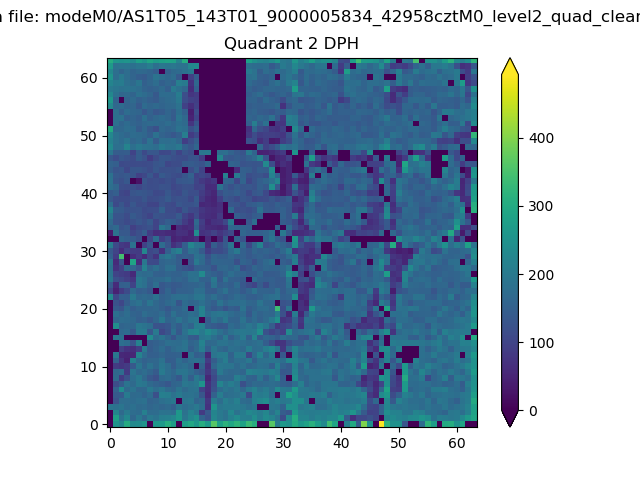
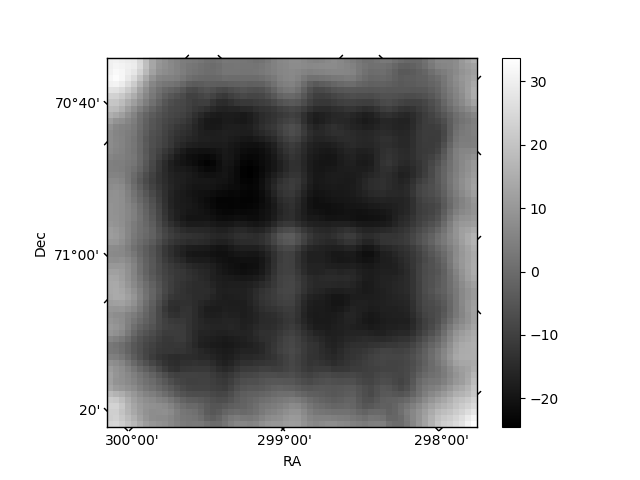
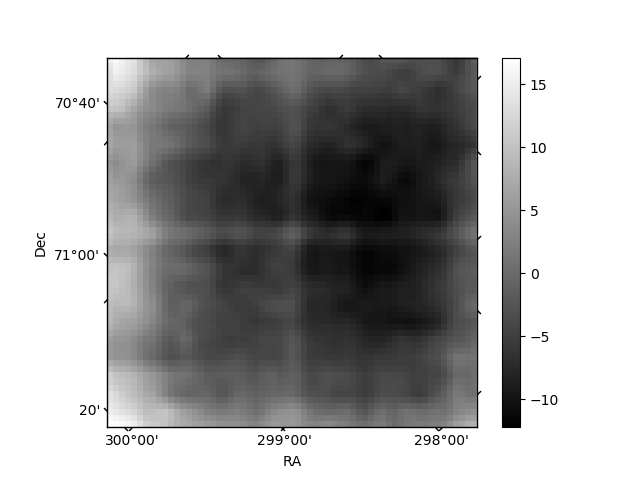
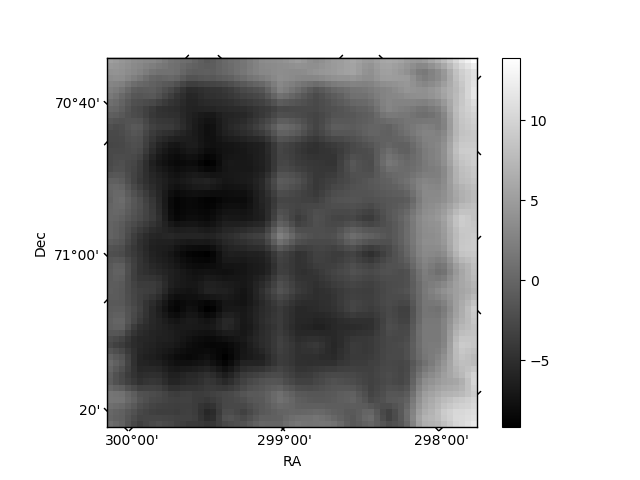
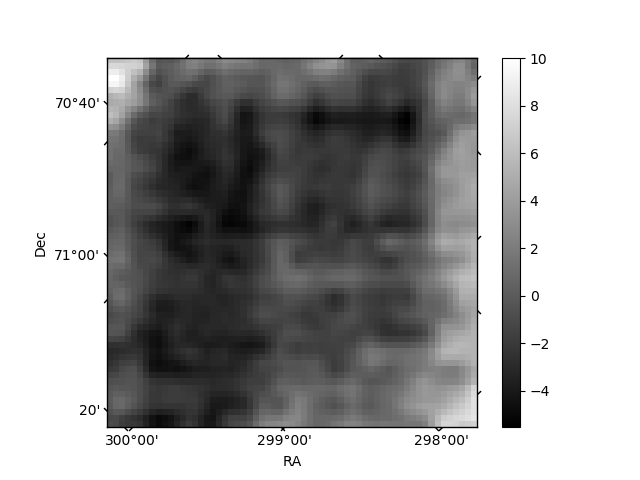
Histogram calculated using DETX and DETY for each event in the final _common_clean file
| Quadrant A | 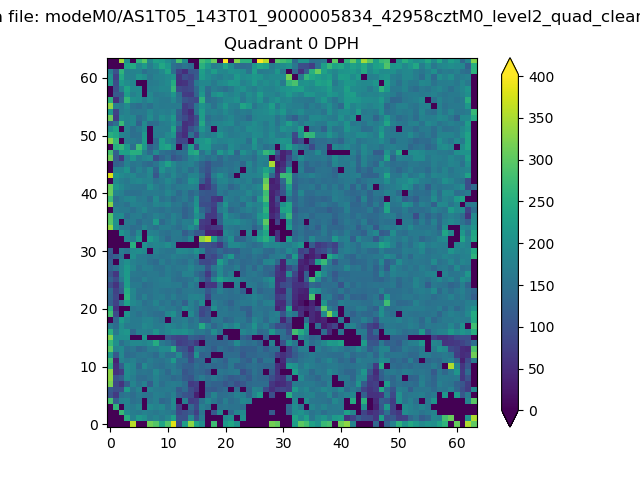 |
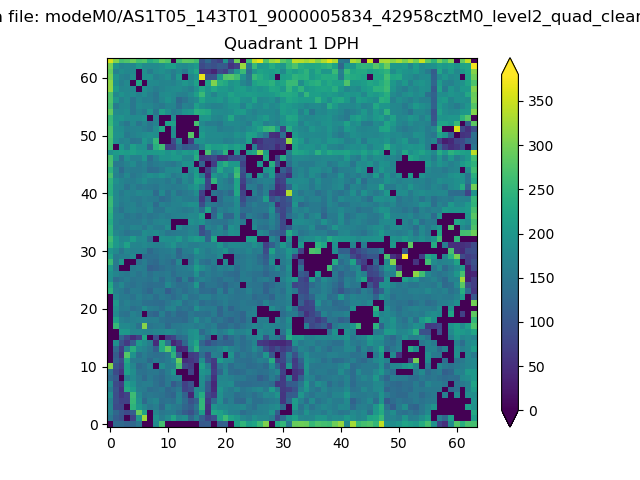 |
Quadrant B |
|---|---|---|---|
| Quadrant D | 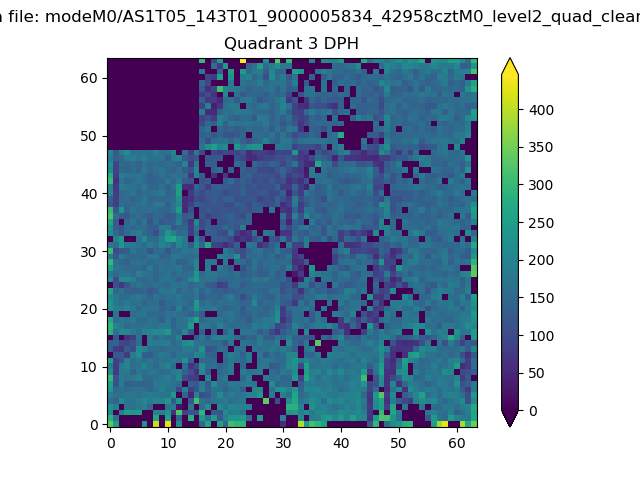 |
 |
Quadrant C |
| Plot type | Count rate plots | Images |
|---|---|---|
| Comparison with Poisson distribution Blue bars denote a histogram of data divided into 1 sec bins. Red curve is a Poisson curve with rate = median count rate of data. |
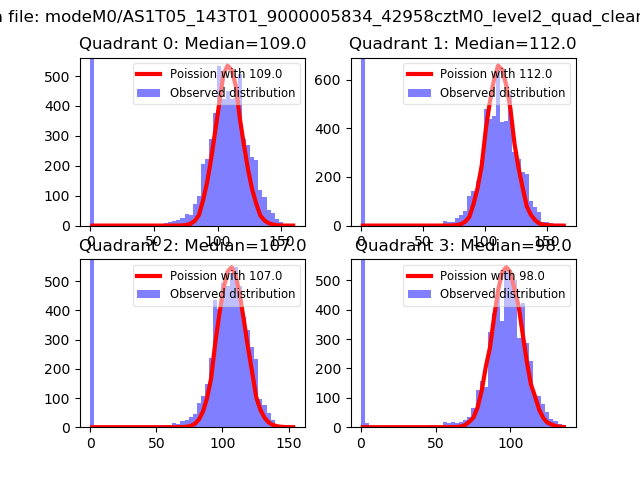 |
 |
| Quadrant-wise count rates Data is divided into 100 sec bins |
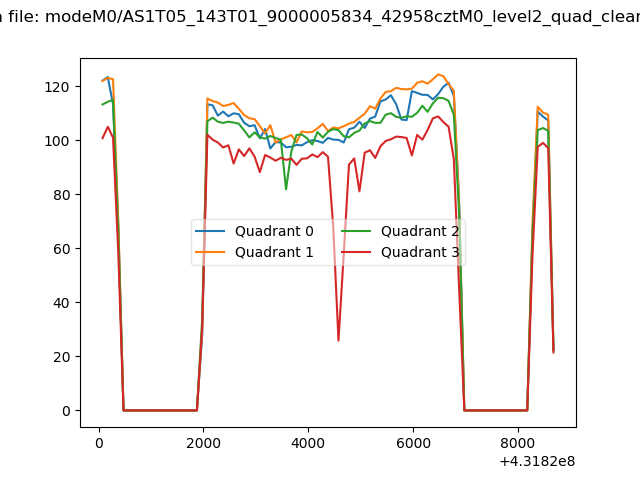 |
|
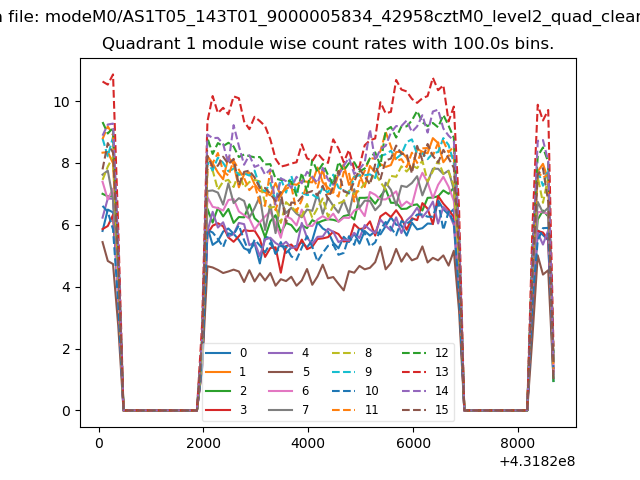
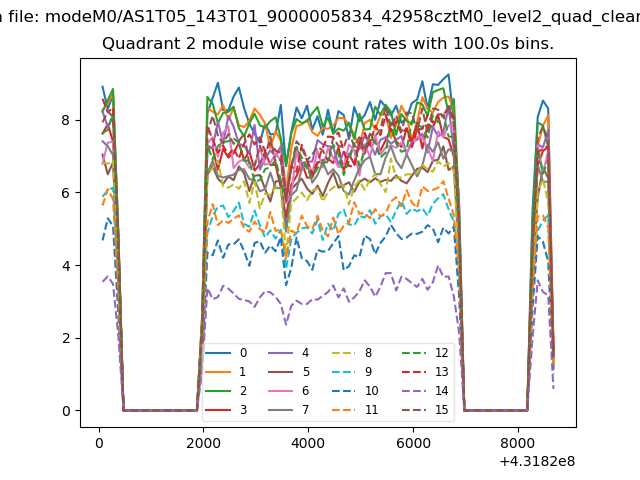
| Module-wise count rates for Quadrant A Data is divided into 100 sec bins |
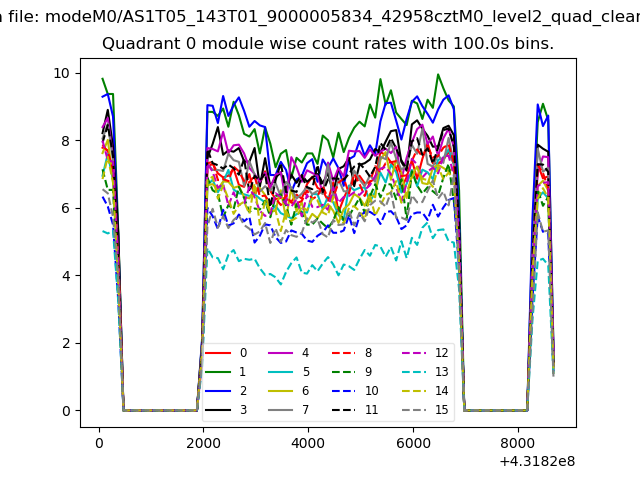 |
 |
| Module-wise count rates for Quadrant B Data is divided into 100 sec bins |
 |
 |
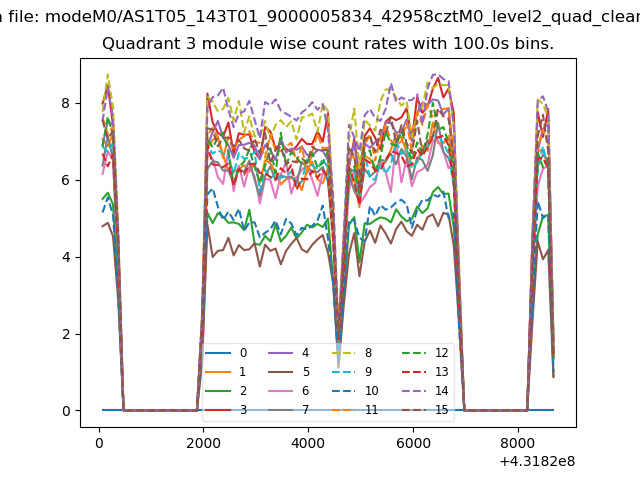
| Module-wise count rates for Quadrant C Data is divided into 100 sec bins |
 |
 |
| Module-wise count rates for Quadrant D Data is divided into 100 sec bins |
 |
 |
| Parameter | Plot |
|---|---|
| CZT HV Monitor | 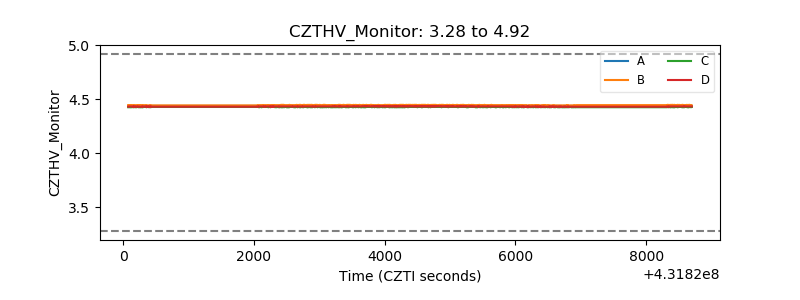 |
| D_VDD | 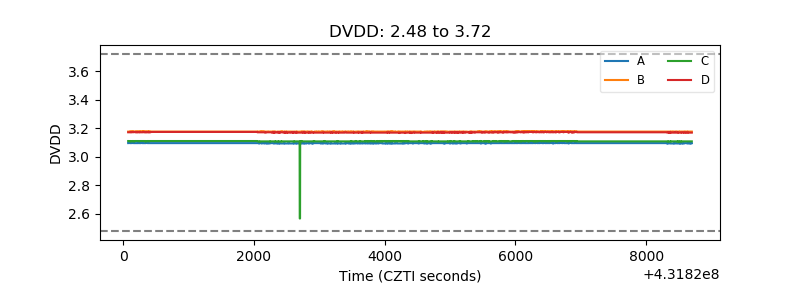 |
| Temperature 1 | 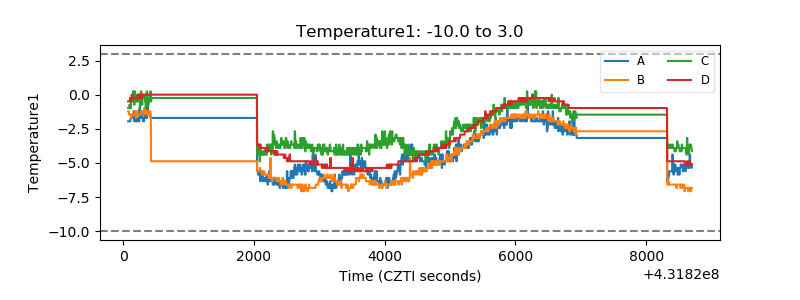 |
| Veto HV Monitor |  |
| Veto LLD | 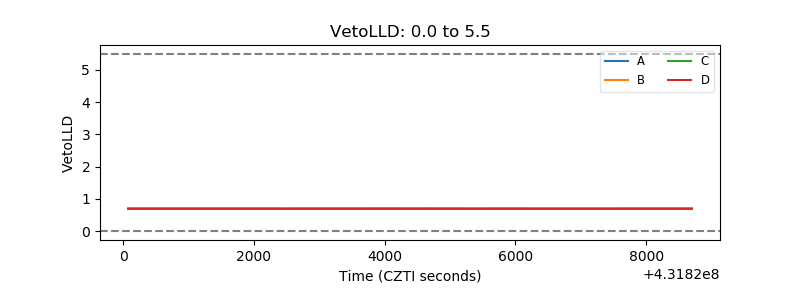 |
| Alpha Counter | 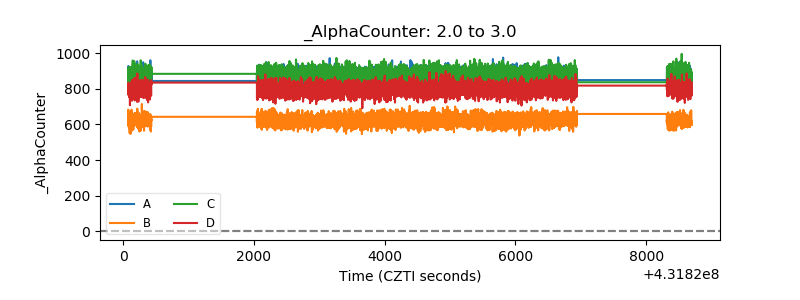 |
| _CPM_Rate | 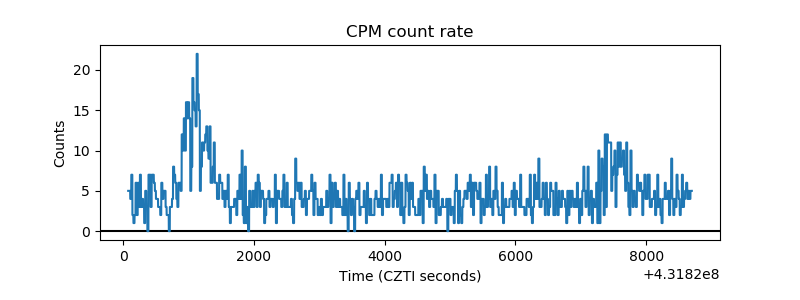 |
| CZT Counter | 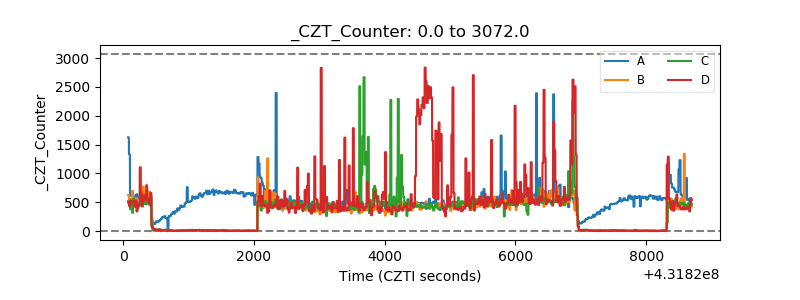 |
| +2.5 Volts monitor | 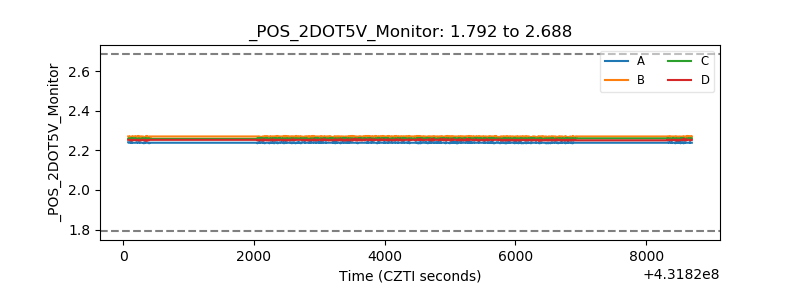 |
| +5 Volts monitor | 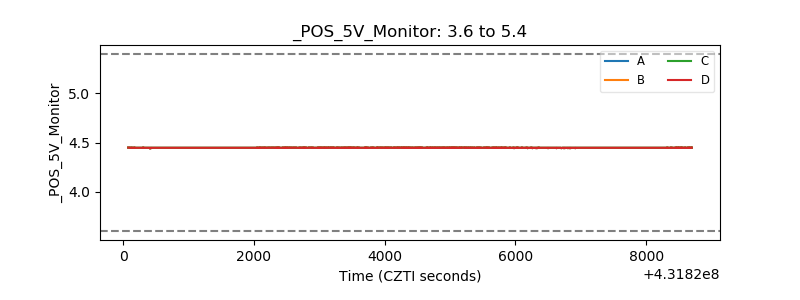 |
| _ROLL_ROT | 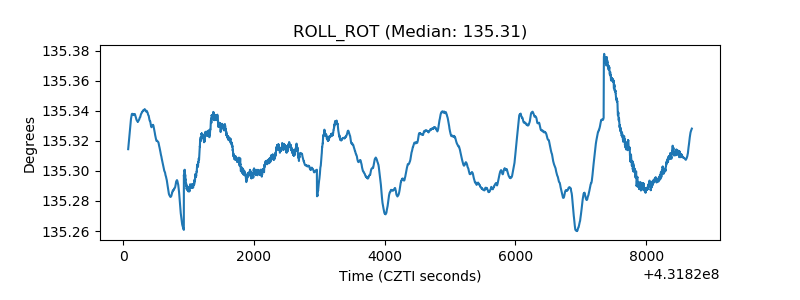 |
| _Roll_DEC | 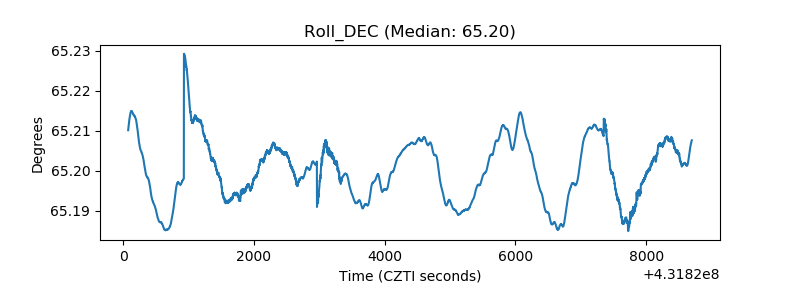 |
| _Roll_RA |  |
| Veto Counter | 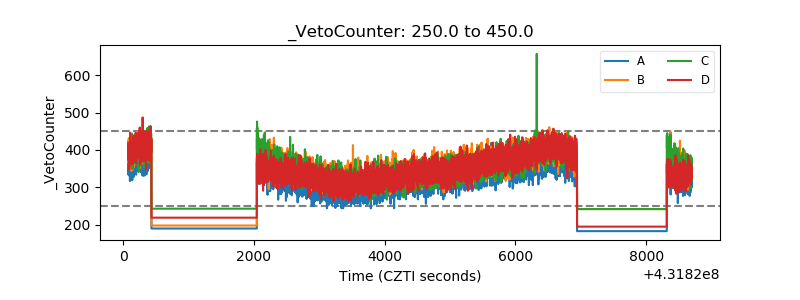 |