| Param | Original file | Final file |
|---|---|---|
| Filename | modeM0/AS1T05_145T01_9000005836_42961cztM0_level2.fits | modeM0/AS1T05_145T01_9000005836_42961cztM0_level2_quad_clean.evt |
| Size (bytes) | 1,590,350,400 | 272,145,600 |
| Size | 1.5 GB | 259.5 MB |
| Events in quadrant A | 9,883,669 | 2,253,358 |
| Events in quadrant B | 27,748,115 | 807,398 |
| Events in quadrant C | 8,092,097 | 2,196,413 |
| Events in quadrant D | 11,937,089 | 1,905,312 |
| Mode M0 | |||
|---|---|---|---|
| Quadrant | BADHDUFLAG | Total packets | Discarded packets |
| A | 0 | 39898 | 4 |
| B | 0 | 93007 | 4 |
| C | 0 | 32346 | 4 |
| D | 0 | 45872 | 4 |
| Mode M9 | |||
|---|---|---|---|
| Quadrant | BADHDUFLAG | Total packets | Discarded packets |
| A | 0 | 55 | 0 |
| B | 0 | 55 | 0 |
| C | 0 | 55 | 0 |
| D | 0 | 55 | 0 |
| Mode SS | |||
|---|---|---|---|
| Quadrant | BADHDUFLAG | Total packets | Discarded packets |
| A | 0 | 322 | 0 |
| B | 0 | 322 | 0 |
| C | 0 | 322 | 0 |
| D | 0 | 322 | 0 |
| Quadrant | Total seconds | Saturated seconds | Saturation percentage |
|---|---|---|---|
| A | 15624 | 194 | 1.241679% |
| B | 15624 | 10053 | 64.343318% |
| C | 15624 | 10 | 0.064004% |
| D | 15625 | 711 | 4.550400% |
Noise dominated data is calculated using 1-second bins in cleaned event files. If a bin has >2000 counts, and if more than 50% of those come from <1% of pixels, then it is considered to be noise-dominated and hence unusable.
| Quadrant | # 1 sec bins | Bins with >0 counts | Bins with >2000 counts | High rate bins dominated by noise | Noise dominated (total time) | Noise dominated (detector-on time) | Marked lightcurve |
|---|---|---|---|---|---|---|---|
| A | 21173 | 15628 | 115 | 115 | 0.54% | 0.74% | 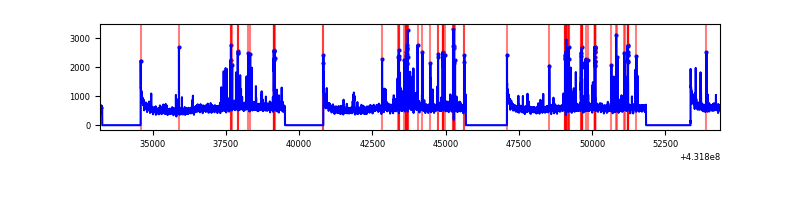 |
| B | 21173 | 15628 | 9160 | 9160 | 43.26% | 58.61% | 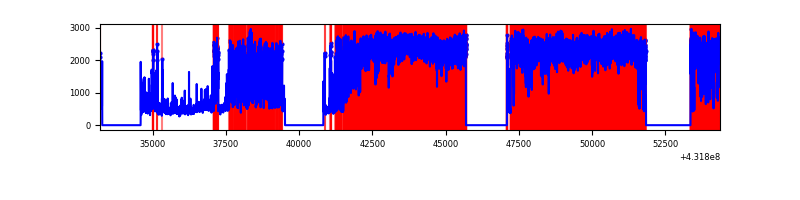 |
| C | 21173 | 15628 | 1 | 1 | 0.00% | 0.01% | 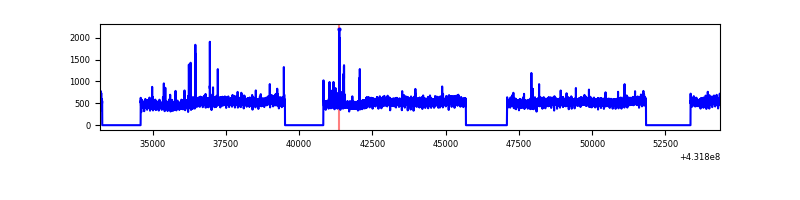 |
| D | 21174 | 15629 | 757 | 757 | 3.58% | 4.84% | 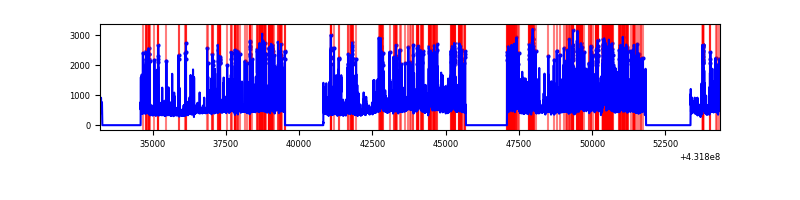 |
Top three noisy pixels from each quadrant. If the there are fewer than three noisy pixels in the level2.evt file, extra rows are filled as -1
| Pixel properties | Quadrant properties | ||||||
|---|---|---|---|---|---|---|---|
| Quadrant | DetID | PixID | Counts | Sigma | Mean | Median | Sigma |
| A | 10 | 83 | 1540656 | 3446.9 | 1937 | 1887 | 446.4 |
| A | 15 | 237 | 670146 | 1496.93 | 1937 | 1887 | 446.4 |
| A | 13 | 248 | 84934 | 186.03 | 1937 | 1887 | 446.4 |
| B | 4 | 81 | 22500339 | 95108.98 | 1151 | 1123 | 236.6 |
| B | 4 | 171 | 544533 | 2297.11 | 1151 | 1123 | 236.6 |
| B | 3 | 112 | 74055 | 308.3 | 1151 | 1123 | 236.6 |
| C | 15 | 214 | 637289 | 1353.76 | 1886 | 1913 | 469.3 |
| C | 14 | 254 | 65868 | 136.27 | 1886 | 1913 | 469.3 |
| C | 12 | 249 | 22979 | 44.88 | 1886 | 1913 | 469.3 |
| D | 12 | 2 | 1498019 | 3034.37 | 1843 | 1779 | 493.1 |
| D | 12 | 6 | 811957 | 1643.04 | 1843 | 1779 | 493.1 |
| D | 1 | 52 | 677348 | 1370.05 | 1843 | 1779 | 493.1 |
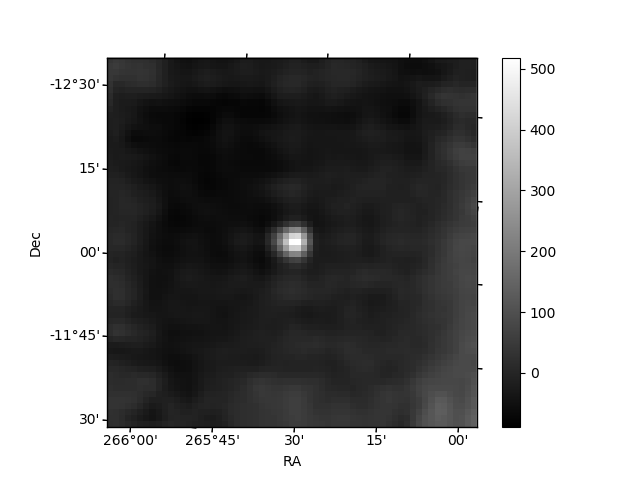
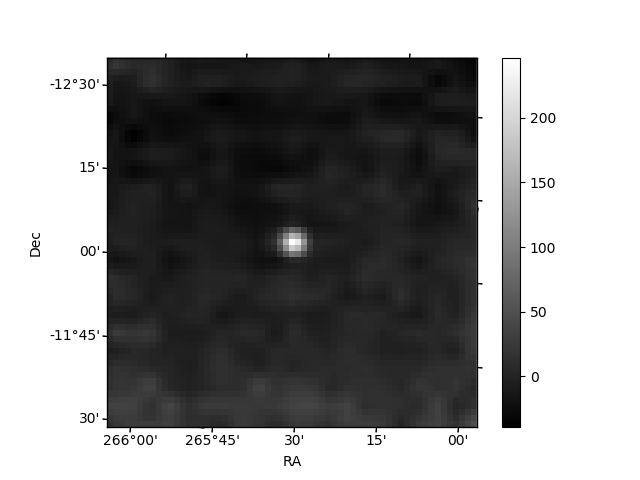
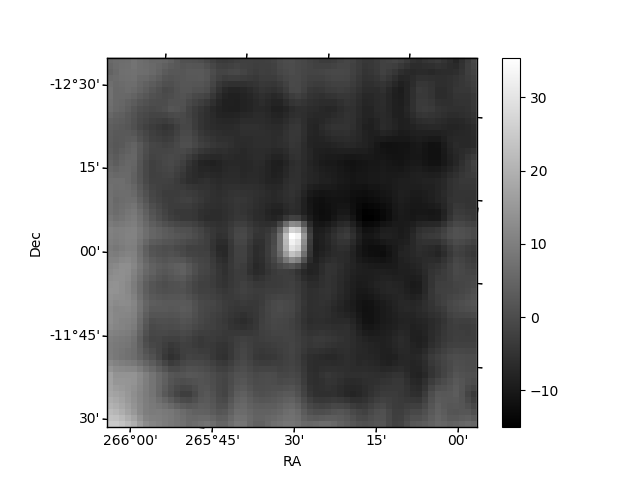
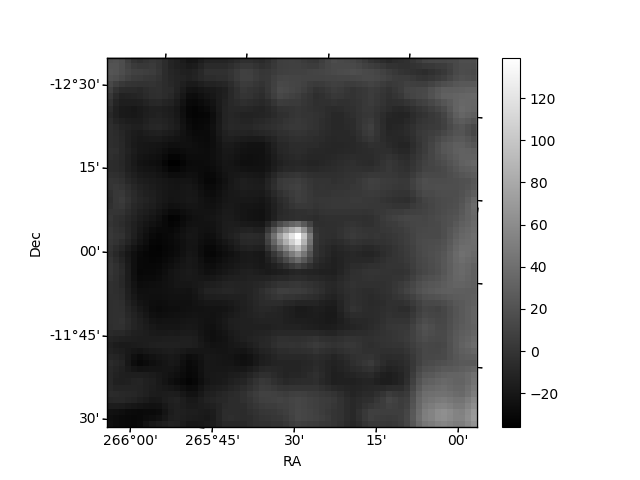
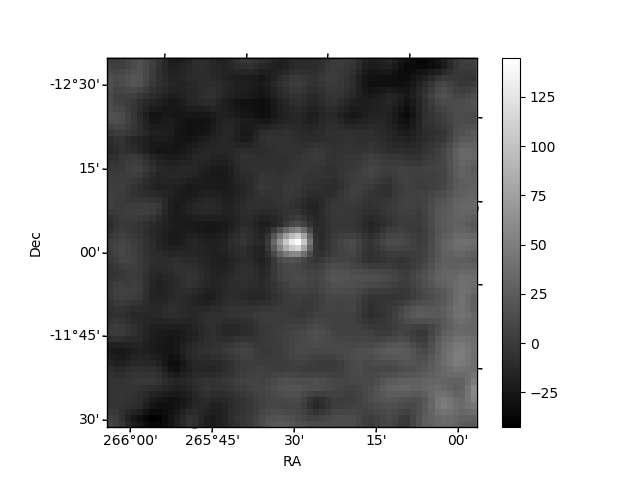
Histogram calculated using DETX and DETY for each event in the final _common_clean file
| Quadrant A | 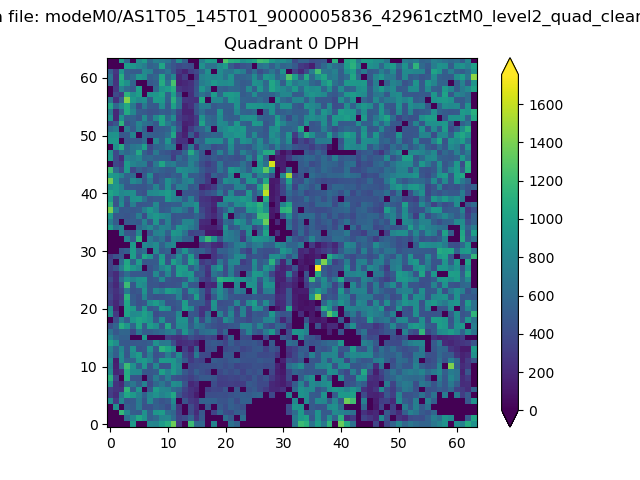 |
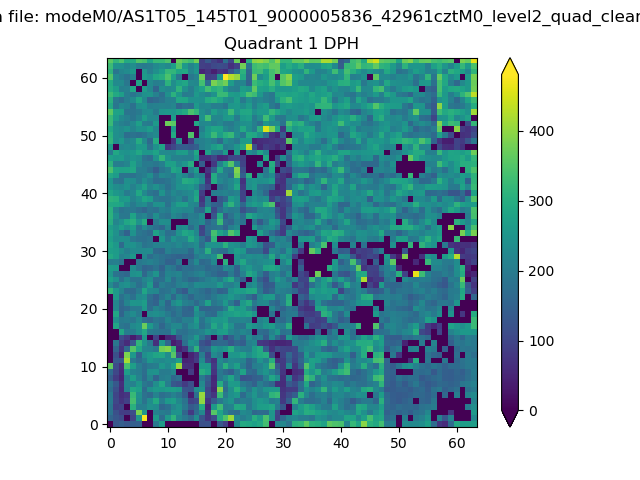 |
Quadrant B |
|---|---|---|---|
| Quadrant D | 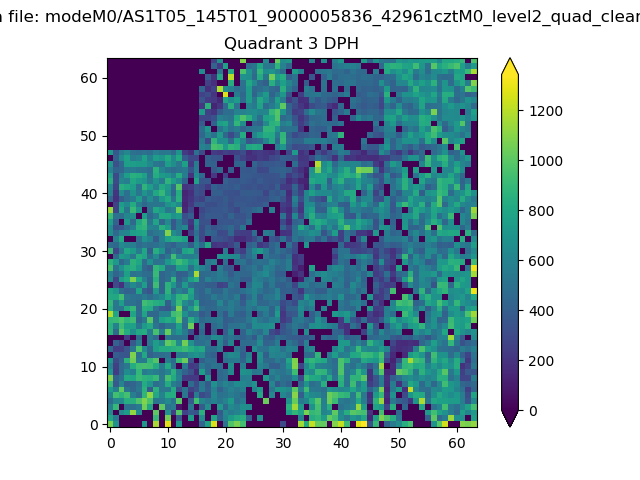 |
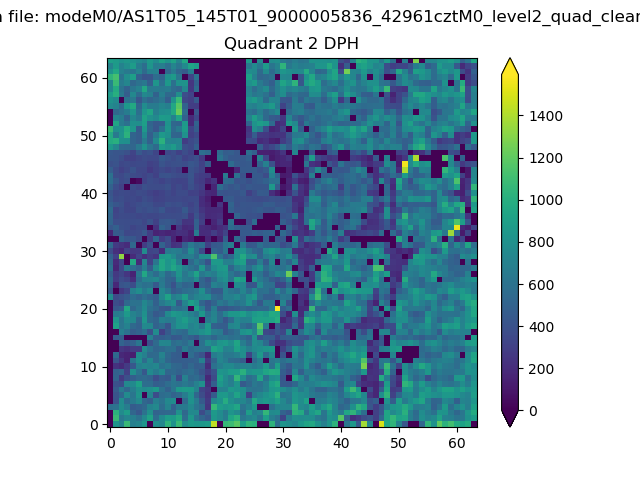 |
Quadrant C |
| Plot type | Count rate plots | Images |
|---|---|---|
| Comparison with Poisson distribution Blue bars denote a histogram of data divided into 1 sec bins. Red curve is a Poisson curve with rate = median count rate of data. |
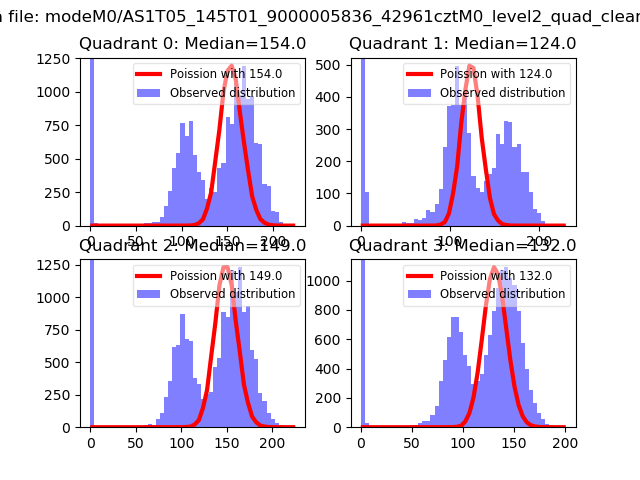 |
 |
| Quadrant-wise count rates Data is divided into 100 sec bins |
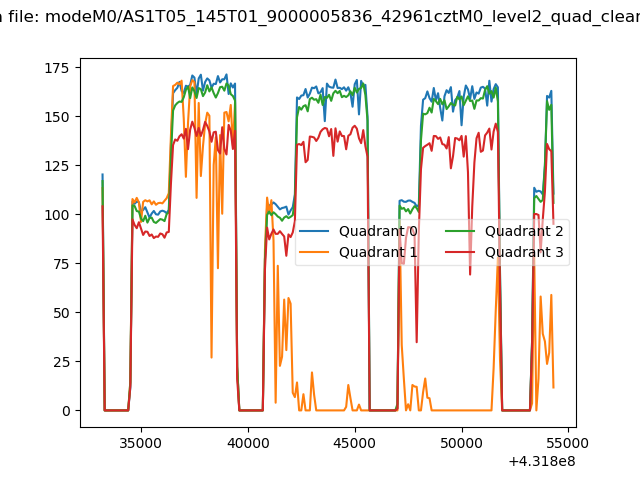 |
|
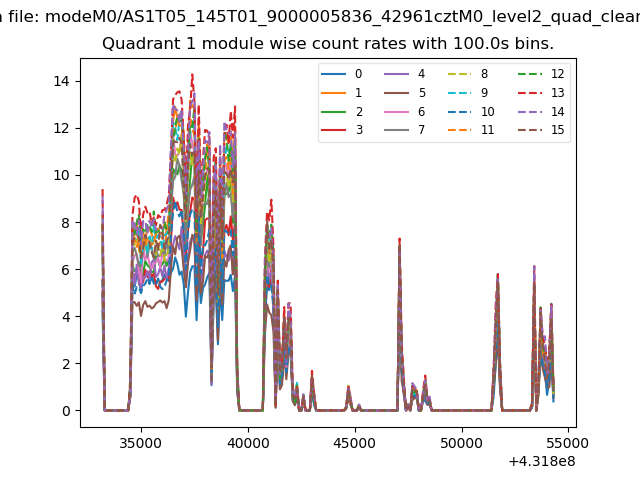
| Module-wise count rates for Quadrant A Data is divided into 100 sec bins |
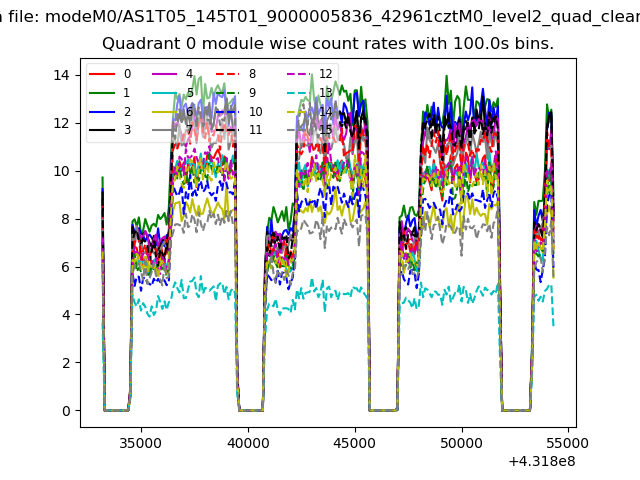 |
 |
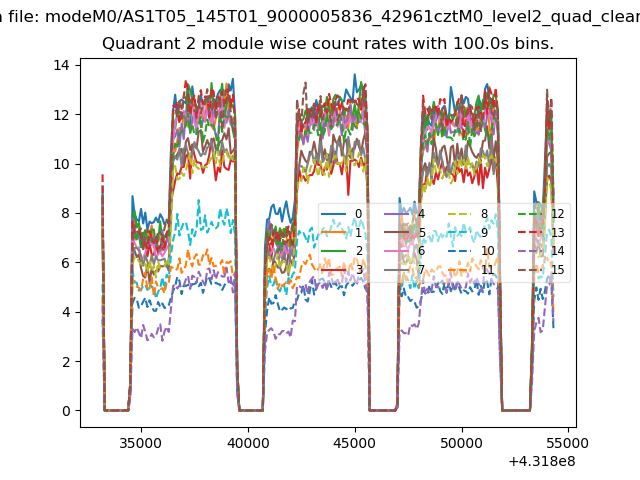
| Module-wise count rates for Quadrant B Data is divided into 100 sec bins |
 |
 |
| Module-wise count rates for Quadrant C Data is divided into 100 sec bins |
 |
 |
| Module-wise count rates for Quadrant D Data is divided into 100 sec bins |
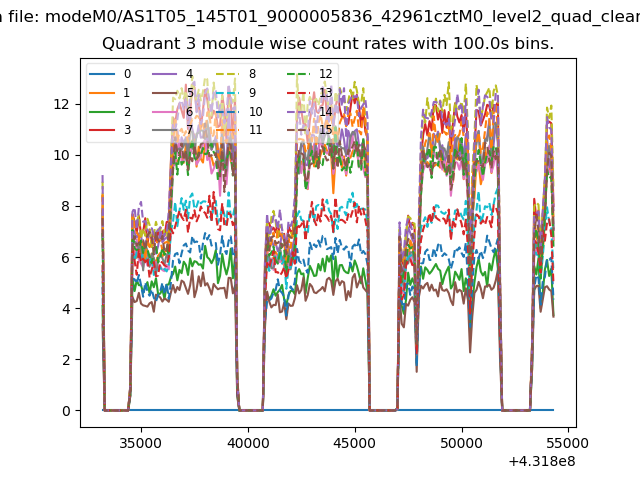 |
 |
| Parameter | Plot |
|---|---|
| CZT HV Monitor | 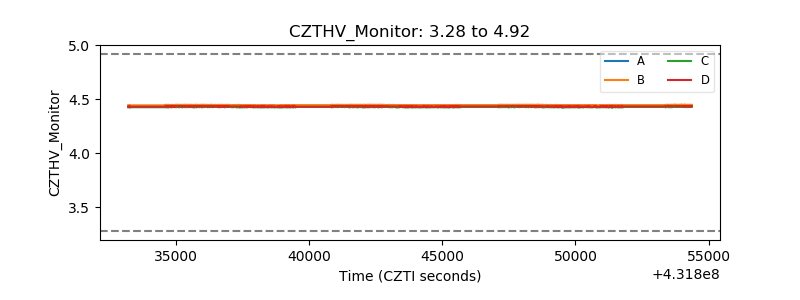 |
| D_VDD | 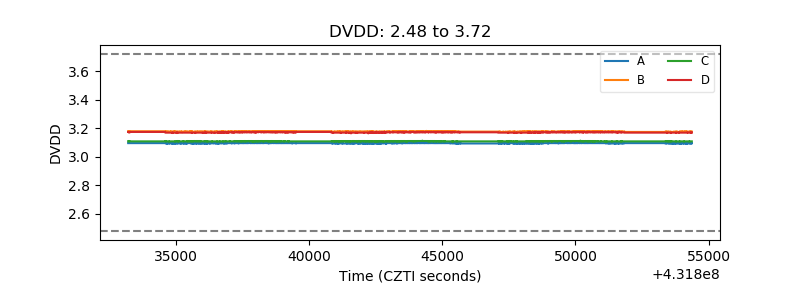 |
| Temperature 1 | 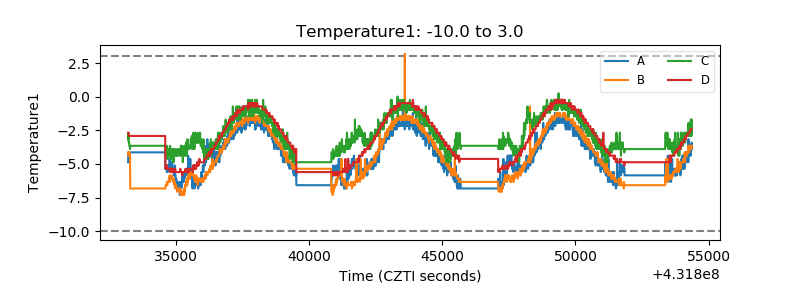 |
| Veto HV Monitor | 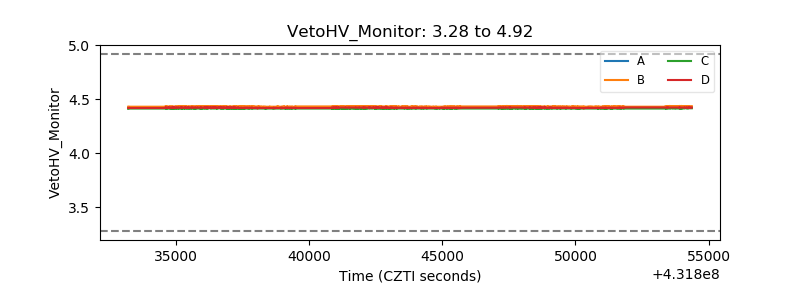 |
| Veto LLD | 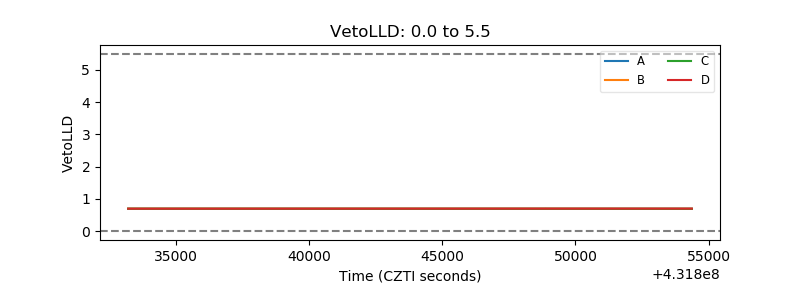 |
| Alpha Counter | 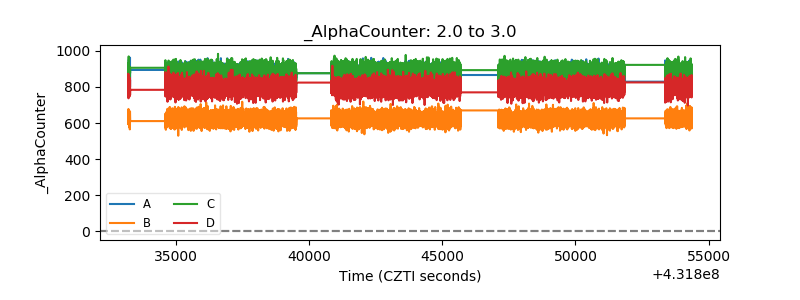 |
| _CPM_Rate | 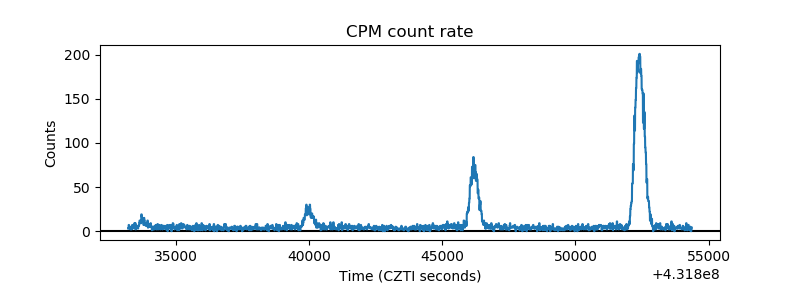 |
| CZT Counter | 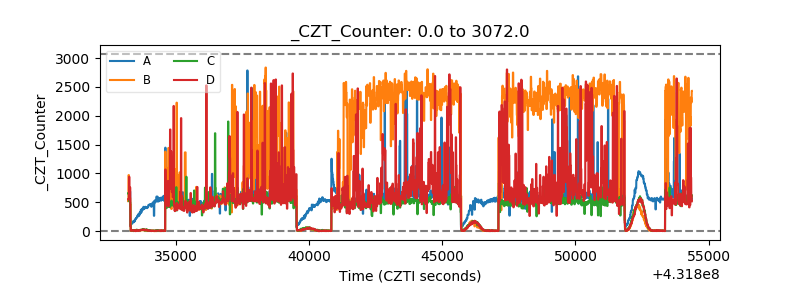 |
| +2.5 Volts monitor | 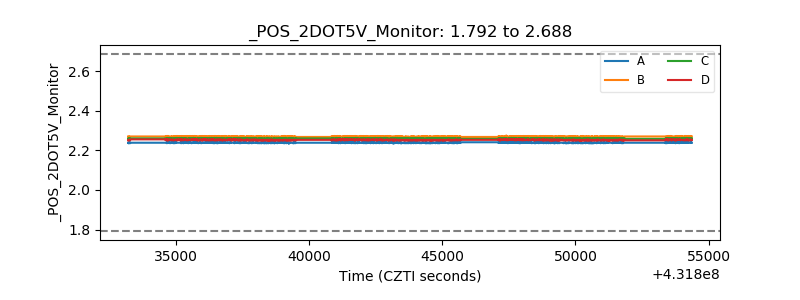 |
| +5 Volts monitor |  |
| _ROLL_ROT | 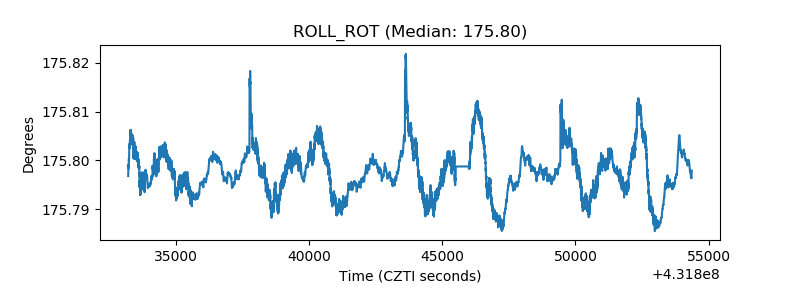 |
| _Roll_DEC | 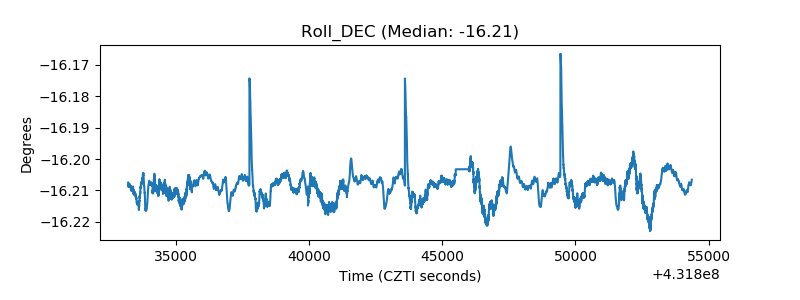 |
| _Roll_RA | 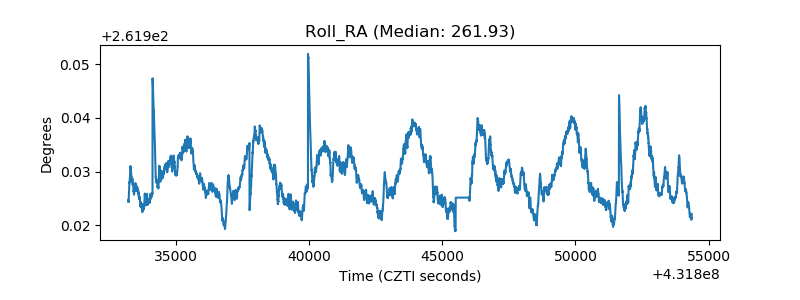 |
| Veto Counter | 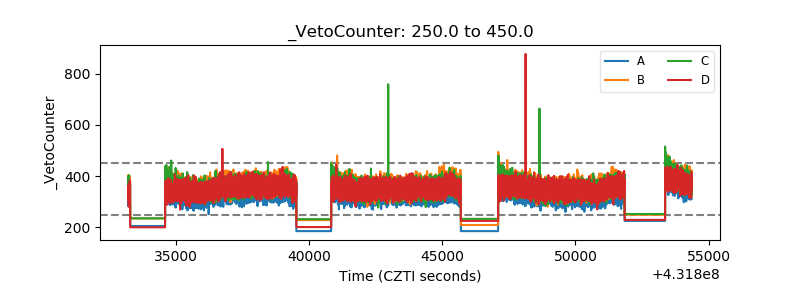 |