| Param | Original file | Final file |
|---|---|---|
| Filename | modeM0/AS1T05_145T01_9000005836_42962cztM0_level2.fits | modeM0/AS1T05_145T01_9000005836_42962cztM0_level2_quad_clean.evt |
| Size (bytes) | 561,084,480 | 106,113,600 |
| Size | 535.1 MB | 101.2 MB |
| Events in quadrant A | 3,676,153 | 849,993 |
| Events in quadrant B | 8,632,965 | 445,601 |
| Events in quadrant C | 3,001,882 | 824,020 |
| Events in quadrant D | 5,028,085 | 706,384 |
| Mode M0 | |||
|---|---|---|---|
| Quadrant | BADHDUFLAG | Total packets | Discarded packets |
| A | 0 | 14642 | 2 |
| B | 0 | 29448 | 7 |
| C | 0 | 11870 | 2 |
| D | 0 | 18646 | 2 |
| Mode M9 | |||
|---|---|---|---|
| Quadrant | BADHDUFLAG | Total packets | Discarded packets |
| A | 0 | 21 | 0 |
| B | 0 | 22 | 0 |
| C | 0 | 22 | 0 |
| D | 0 | 22 | 0 |
| Mode SS | |||
|---|---|---|---|
| Quadrant | BADHDUFLAG | Total packets | Discarded packets |
| A | 0 | 112 | 0 |
| B | 0 | 112 | 0 |
| C | 0 | 112 | 0 |
| D | 0 | 112 | 0 |
| Quadrant | Total seconds | Saturated seconds | Saturation percentage |
|---|---|---|---|
| A | 5542 | 85 | 1.533742% |
| B | 5541 | 2769 | 49.972929% |
| C | 5541 | 10 | 0.180473% |
| D | 5541 | 373 | 6.731637% |
Noise dominated data is calculated using 1-second bins in cleaned event files. If a bin has >2000 counts, and if more than 50% of those come from <1% of pixels, then it is considered to be noise-dominated and hence unusable.
| Quadrant | # 1 sec bins | Bins with >0 counts | Bins with >2000 counts | High rate bins dominated by noise | Noise dominated (total time) | Noise dominated (detector-on time) | Marked lightcurve |
|---|---|---|---|---|---|---|---|
| A | 7185 | 5543 | 54 | 54 | 0.75% | 0.97% | 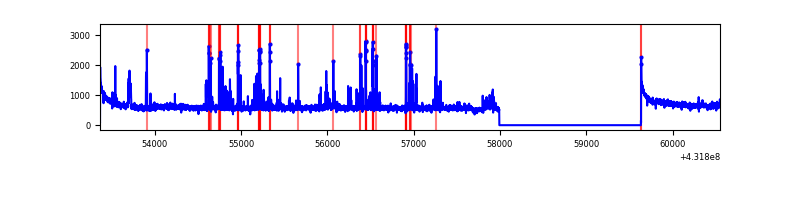 |
| B | 7184 | 5542 | 2532 | 2532 | 35.24% | 45.69% | 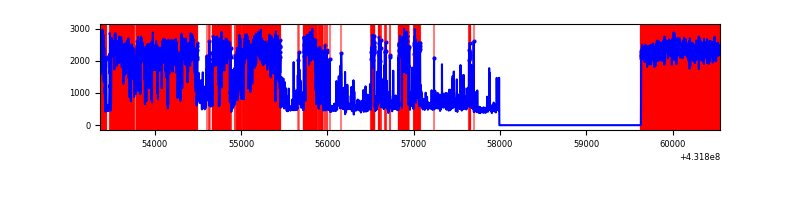 |
| C | 7184 | 5542 | 10 | 10 | 0.14% | 0.18% | 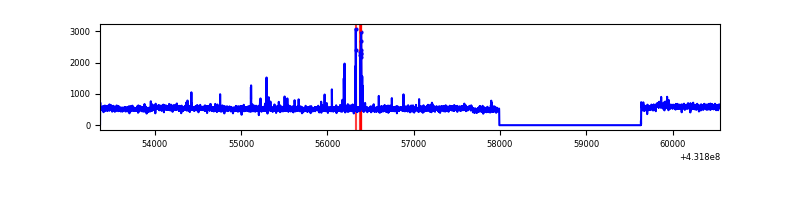 |
| D | 7184 | 5542 | 414 | 414 | 5.76% | 7.47% | 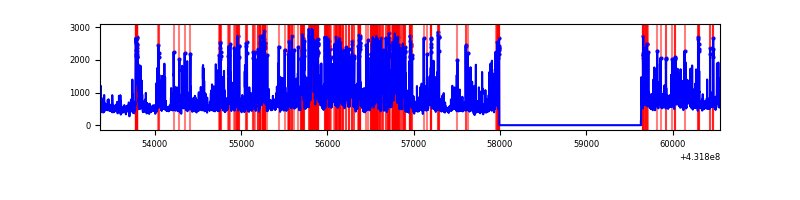 |
Top three noisy pixels from each quadrant. If the there are fewer than three noisy pixels in the level2.evt file, extra rows are filled as -1
| Pixel properties | Quadrant properties | ||||||
|---|---|---|---|---|---|---|---|
| Quadrant | DetID | PixID | Counts | Sigma | Mean | Median | Sigma |
| A | 10 | 83 | 594169 | 3548.12 | 710 | 691 | 167.3 |
| A | 15 | 237 | 317625 | 1894.8 | 710 | 691 | 167.3 |
| A | 15 | 222 | 16980 | 97.38 | 710 | 691 | 167.3 |
| B | 4 | 81 | 5943232 | 57592.69 | 473 | 462 | 103.2 |
| B | 4 | 171 | 791268 | 7663.88 | 473 | 462 | 103.2 |
| B | 15 | 85 | 16486 | 155.29 | 473 | 462 | 103.2 |
| C | 15 | 214 | 227288 | 1285.29 | 690 | 699 | 176.3 |
| C | 14 | 254 | 72047 | 404.71 | 690 | 699 | 176.3 |
| C | 3 | 233 | 9958 | 52.52 | 690 | 699 | 176.3 |
| D | 12 | 2 | 839026 | 4549.42 | 673 | 648 | 184.3 |
| D | 12 | 233 | 627621 | 3402.24 | 673 | 648 | 184.3 |
| D | 1 | 52 | 523282 | 2836.05 | 673 | 648 | 184.3 |
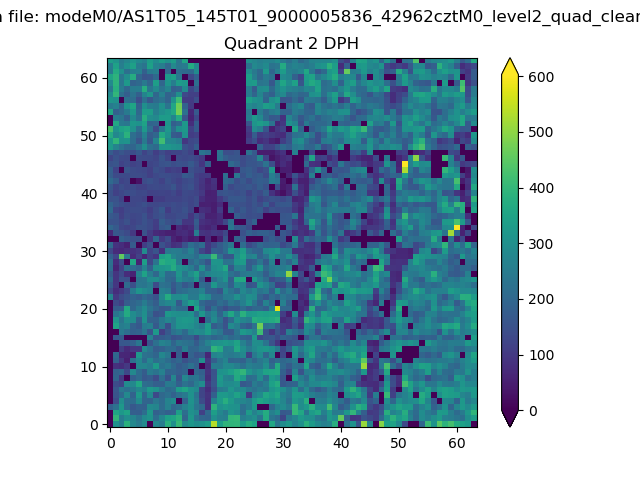
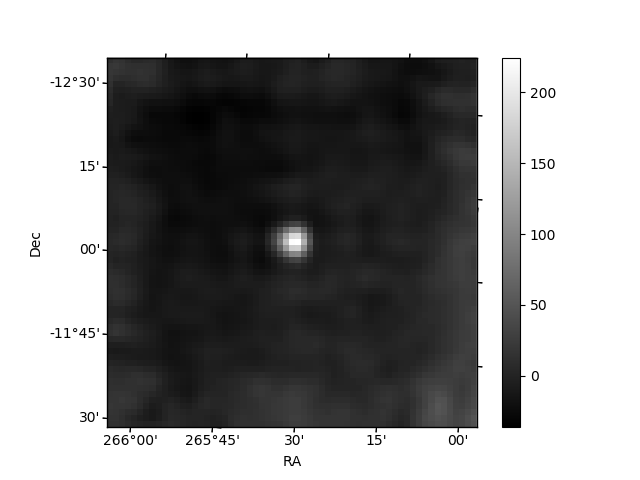
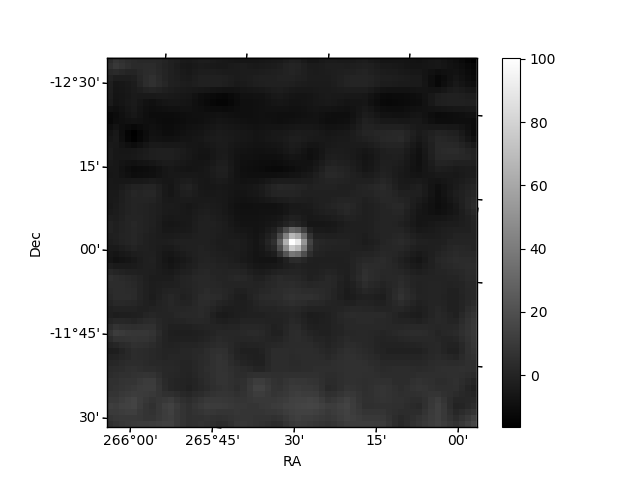
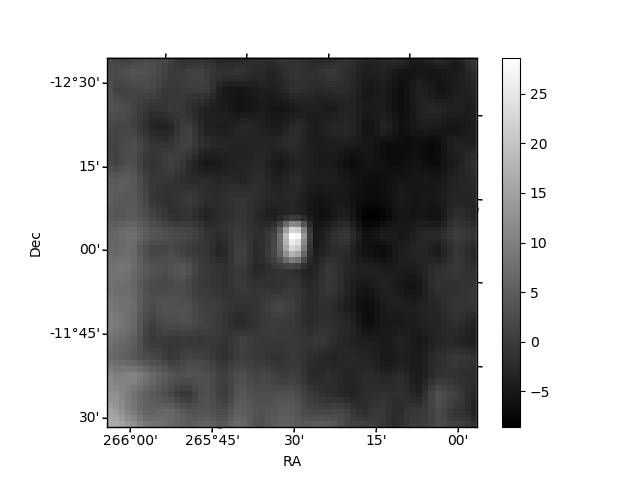
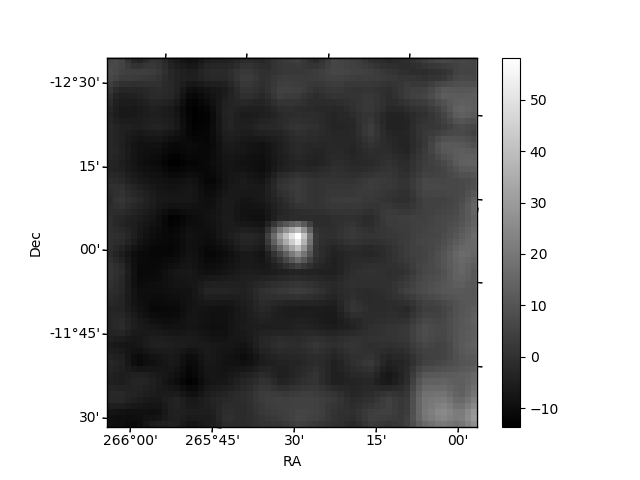
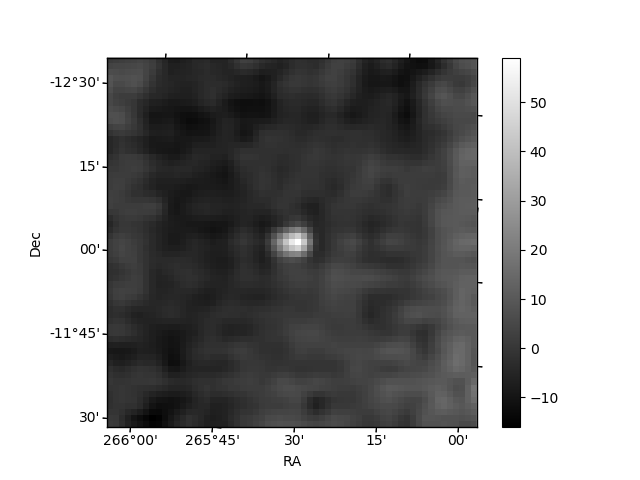
Histogram calculated using DETX and DETY for each event in the final _common_clean file
| Quadrant A | 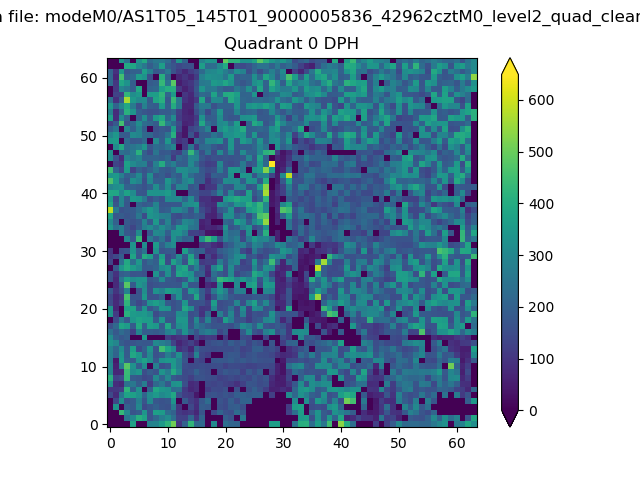 |
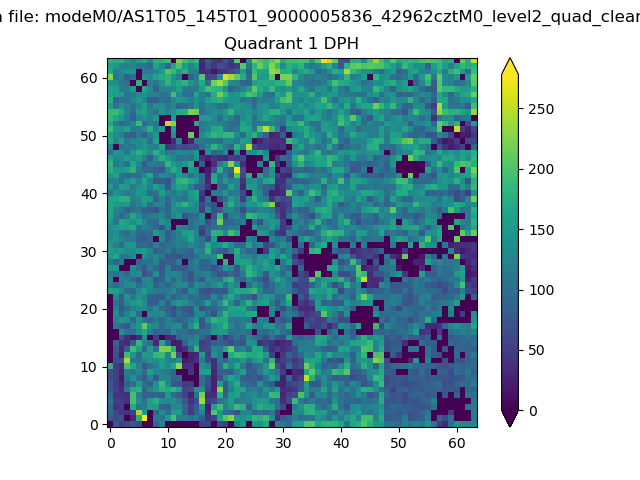 |
Quadrant B |
|---|---|---|---|
| Quadrant D | 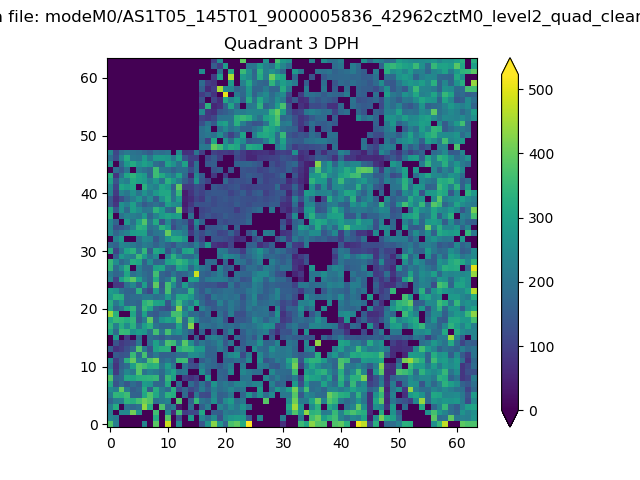 |
 |
Quadrant C |
| Plot type | Count rate plots | Images |
|---|---|---|
| Comparison with Poisson distribution Blue bars denote a histogram of data divided into 1 sec bins. Red curve is a Poisson curve with rate = median count rate of data. |
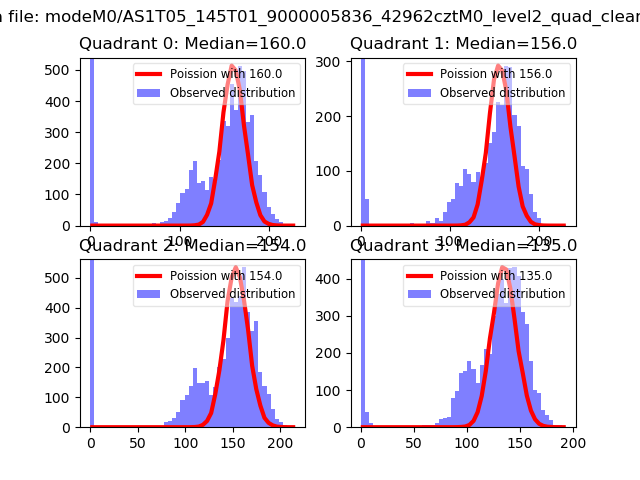 |
 |
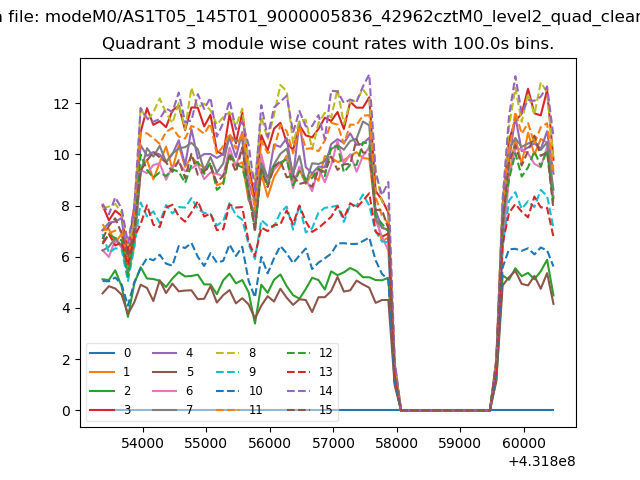
| Quadrant-wise count rates Data is divided into 100 sec bins |
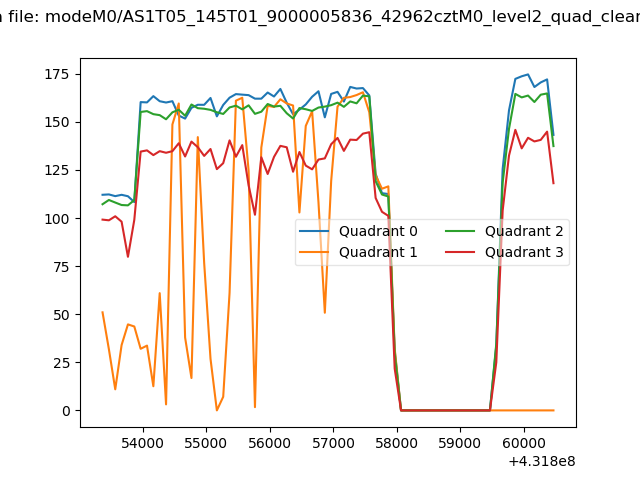 |
|
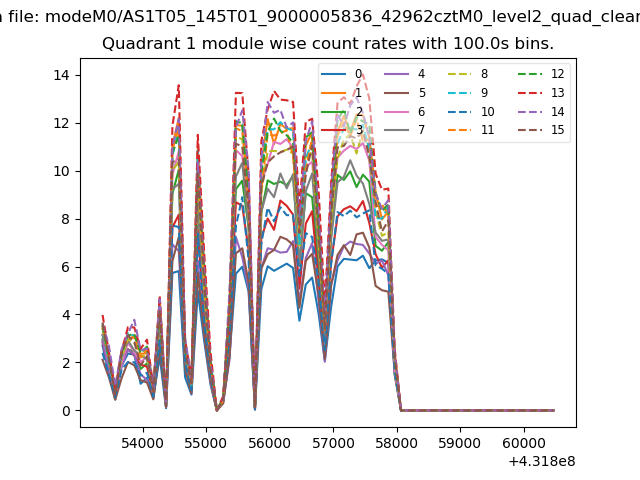
| Module-wise count rates for Quadrant A Data is divided into 100 sec bins |
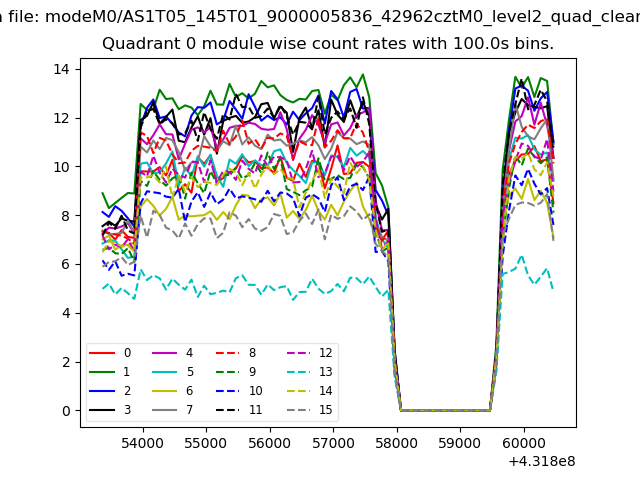 |
 |
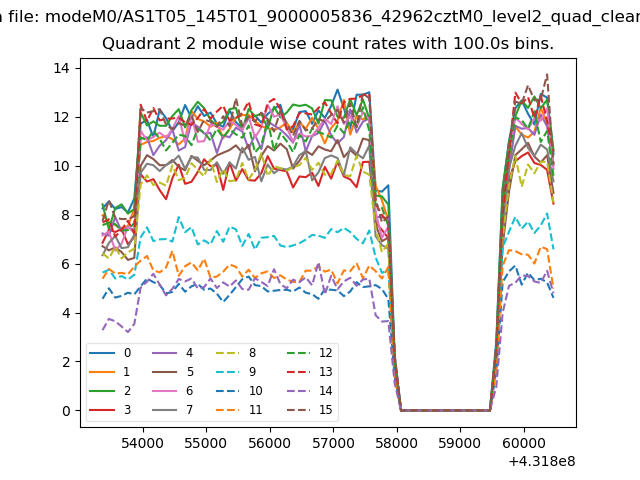
| Module-wise count rates for Quadrant B Data is divided into 100 sec bins |
 |
 |
| Module-wise count rates for Quadrant C Data is divided into 100 sec bins |
 |
 |
| Module-wise count rates for Quadrant D Data is divided into 100 sec bins |
 |
 |
| Parameter | Plot |
|---|---|
| CZT HV Monitor | 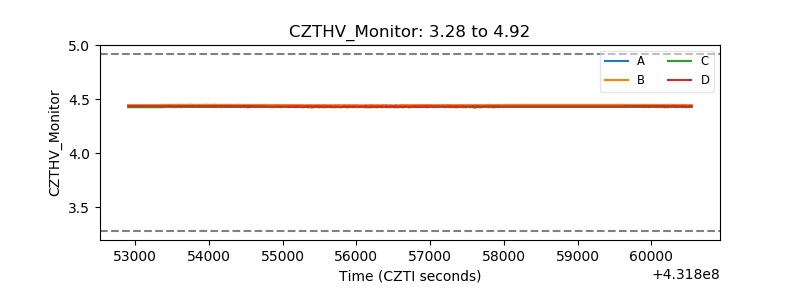 |
| D_VDD | 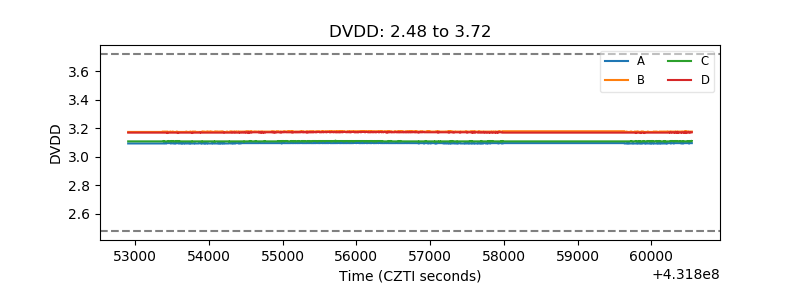 |
| Temperature 1 | 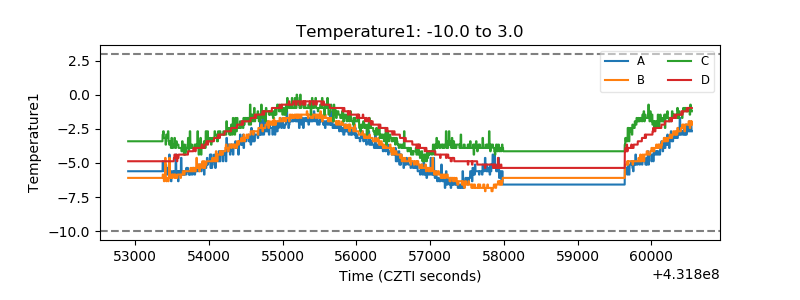 |
| Veto HV Monitor | 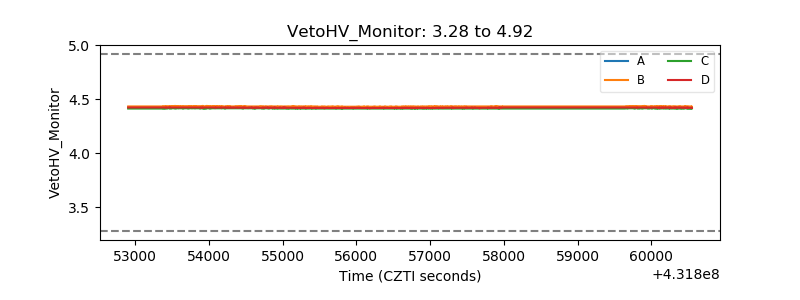 |
| Veto LLD | 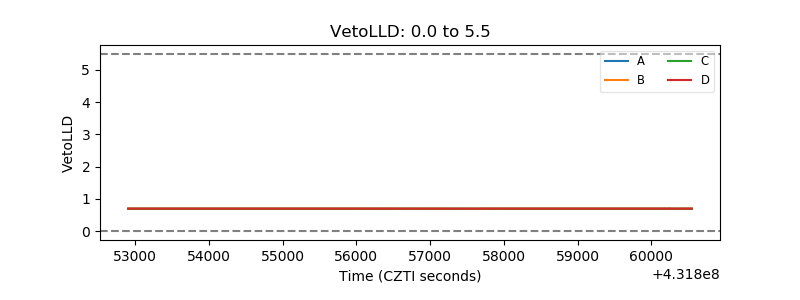 |
| Alpha Counter | 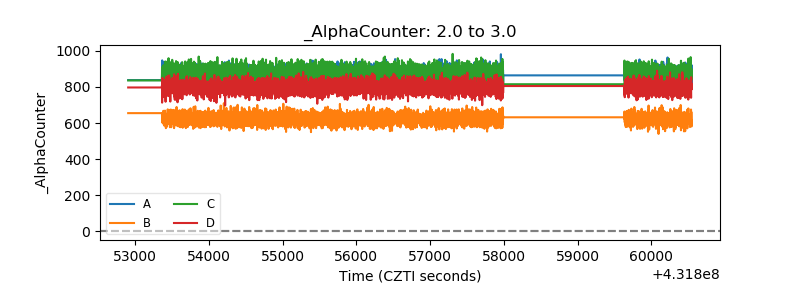 |
| _CPM_Rate | 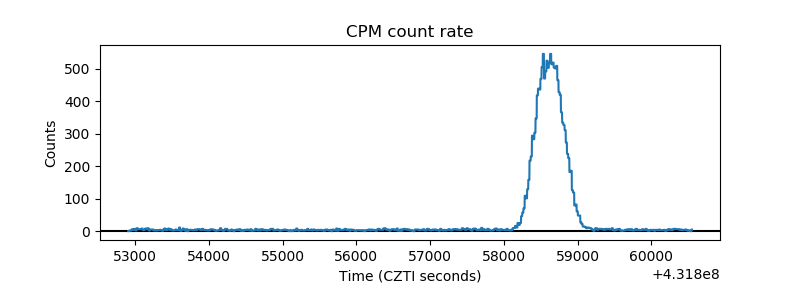 |
| CZT Counter | 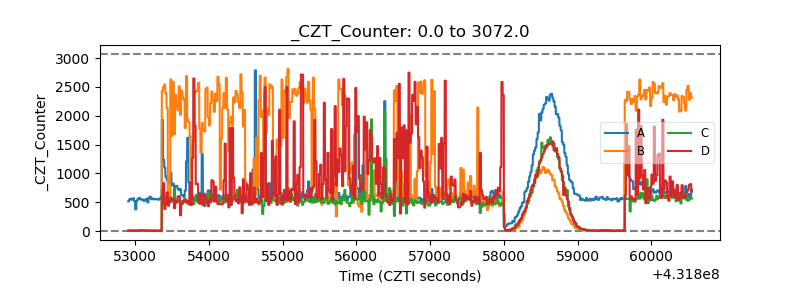 |
| +2.5 Volts monitor | 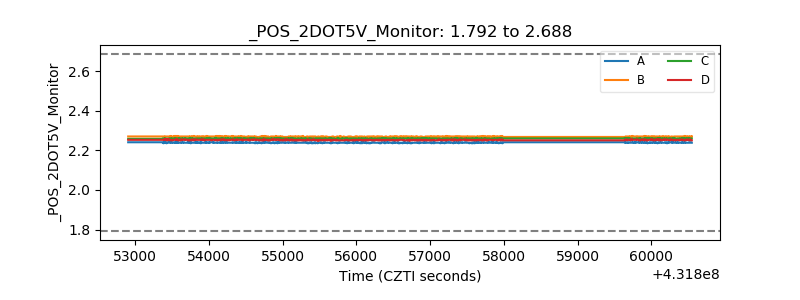 |
| +5 Volts monitor |  |
| _ROLL_ROT | 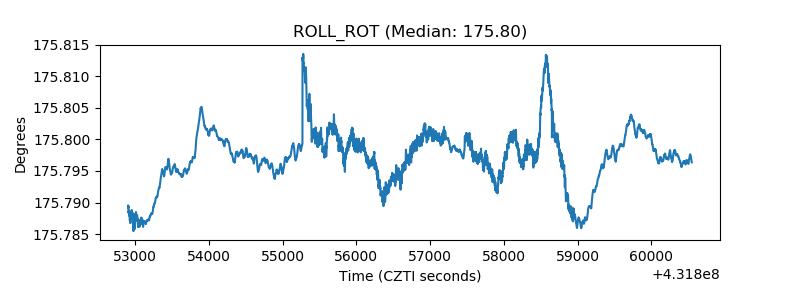 |
| _Roll_DEC | 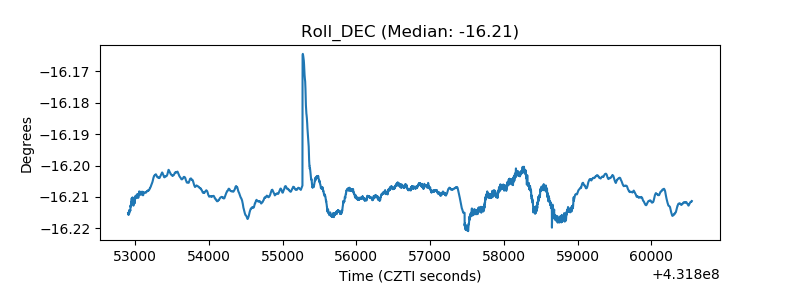 |
| _Roll_RA | 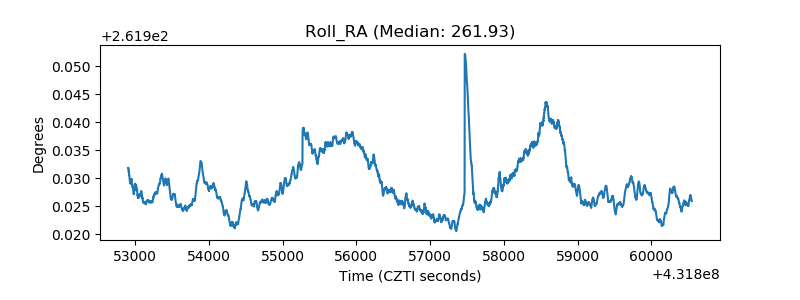 |
| Veto Counter | 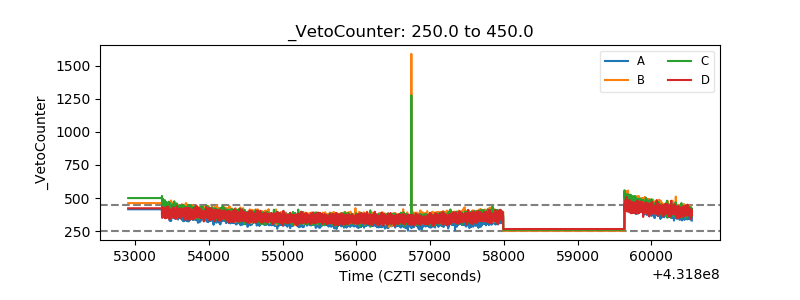 |