| Param | Original file | Final file |
|---|---|---|
| Filename | modeM0/AS1T05_145T01_9000005836_42964cztM0_level2.fits | modeM0/AS1T05_145T01_9000005836_42964cztM0_level2_quad_clean.evt |
| Size (bytes) | 639,264,960 | 93,260,160 |
| Size | 609.7 MB | 88.9 MB |
| Events in quadrant A | 3,889,655 | 851,964 |
| Events in quadrant B | 11,830,872 | 48,059 |
| Events in quadrant C | 2,918,064 | 837,093 |
| Events in quadrant D | 4,610,642 | 713,901 |
| Mode M0 | |||
|---|---|---|---|
| Quadrant | BADHDUFLAG | Total packets | Discarded packets |
| A | 0 | 15320 | 2 |
| B | 0 | 38932 | 2 |
| C | 0 | 11777 | 2 |
| D | 0 | 17370 | 2 |
| Mode M9 | |||
|---|---|---|---|
| Quadrant | BADHDUFLAG | Total packets | Discarded packets |
| A | 0 | 18 | 0 |
| B | 0 | 19 | 0 |
| C | 0 | 19 | 0 |
| D | 0 | 19 | 0 |
| Mode SS | |||
|---|---|---|---|
| Quadrant | BADHDUFLAG | Total packets | Discarded packets |
| A | 0 | 110 | 0 |
| B | 0 | 110 | 0 |
| C | 0 | 110 | 0 |
| D | 0 | 110 | 0 |
| Quadrant | Total seconds | Saturated seconds | Saturation percentage |
|---|---|---|---|
| A | 5324 | 174 | 3.268219% |
| B | 5324 | 4940 | 92.787378% |
| C | 5324 | 2 | 0.037566% |
| D | 5324 | 365 | 6.855748% |
Noise dominated data is calculated using 1-second bins in cleaned event files. If a bin has >2000 counts, and if more than 50% of those come from <1% of pixels, then it is considered to be noise-dominated and hence unusable.
| Quadrant | # 1 sec bins | Bins with >0 counts | Bins with >2000 counts | High rate bins dominated by noise | Noise dominated (total time) | Noise dominated (detector-on time) | Marked lightcurve |
|---|---|---|---|---|---|---|---|
| A | 7117 | 5325 | 127 | 127 | 1.78% | 2.38% | 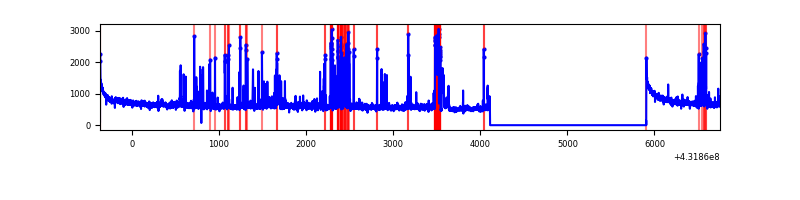 |
| B | 7117 | 5325 | 4771 | 4771 | 67.04% | 89.60% | 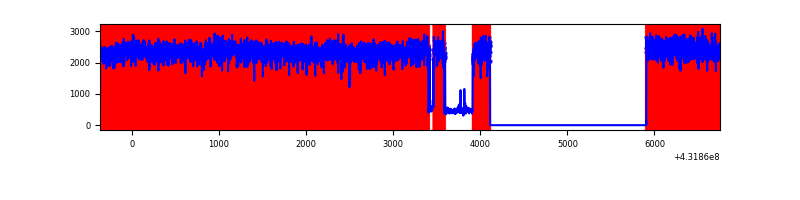 |
| C | 7117 | 5325 | 0 | 0 | 0.00% | 0.00% | 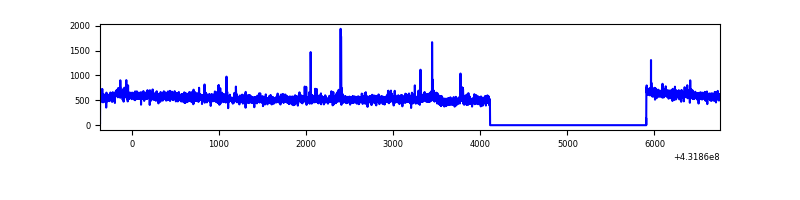 |
| D | 7117 | 5324 | 336 | 336 | 4.72% | 6.31% | 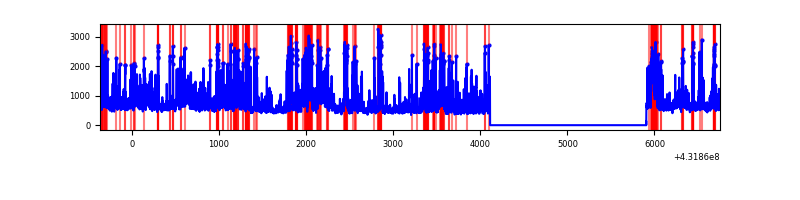 |
Top three noisy pixels from each quadrant. If the there are fewer than three noisy pixels in the level2.evt file, extra rows are filled as -1
| Pixel properties | Quadrant properties | ||||||
|---|---|---|---|---|---|---|---|
| Quadrant | DetID | PixID | Counts | Sigma | Mean | Median | Sigma |
| A | 10 | 83 | 586123 | 3511.14 | 693 | 672 | 166.7 |
| A | 15 | 237 | 582689 | 3490.54 | 693 | 672 | 166.7 |
| A | 15 | 222 | 23495 | 136.88 | 693 | 672 | 166.7 |
| B | 4 | 81 | 11173662 | 358096.12 | 142 | 139 | 31.2 |
| B | 4 | 171 | 84505 | 2703.81 | 142 | 139 | 31.2 |
| B | 3 | 112 | 5317 | 165.95 | 142 | 139 | 31.2 |
| C | 15 | 214 | 221044 | 1278.8 | 676 | 684 | 172.3 |
| C | 14 | 254 | 36524 | 207.99 | 676 | 684 | 172.3 |
| C | 3 | 233 | 12637 | 69.37 | 676 | 684 | 172.3 |
| D | 1 | 52 | 802524 | 4448.65 | 656 | 630 | 180.3 |
| D | 13 | 249 | 523472 | 2900.56 | 656 | 630 | 180.3 |
| D | 12 | 233 | 290707 | 1609.25 | 656 | 630 | 180.3 |
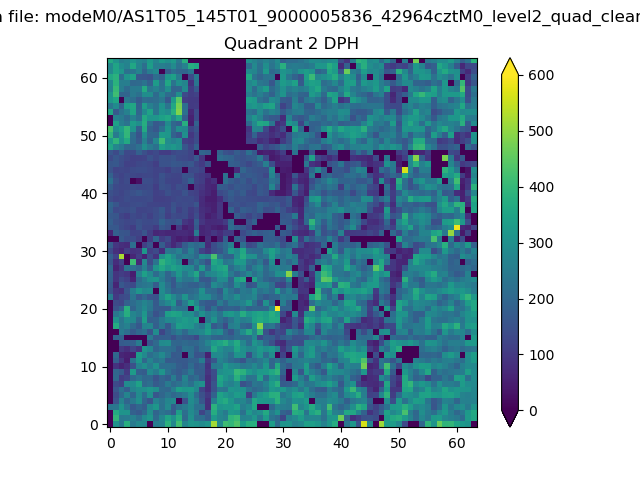
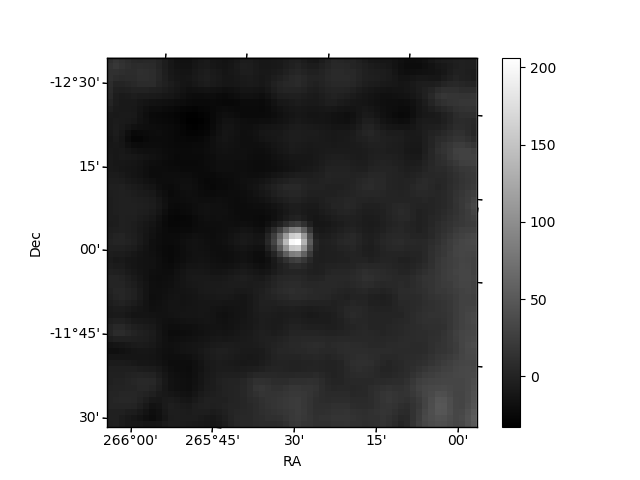
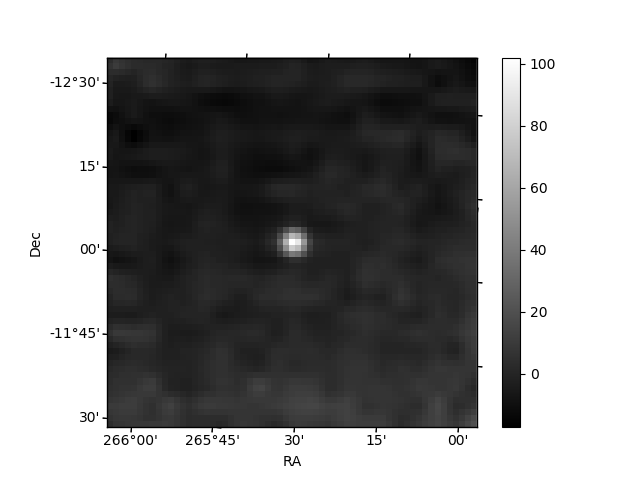
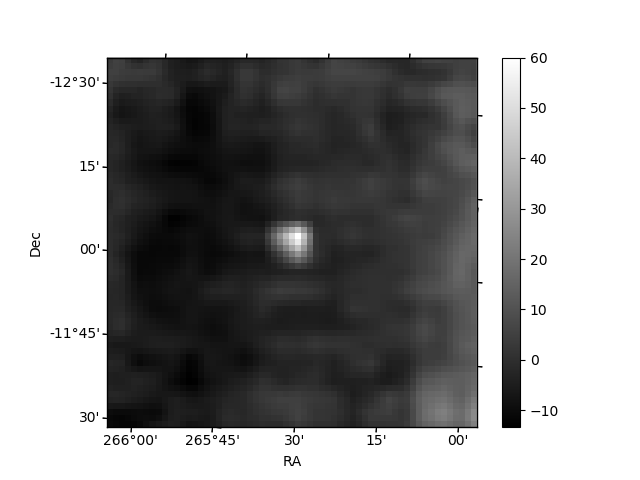
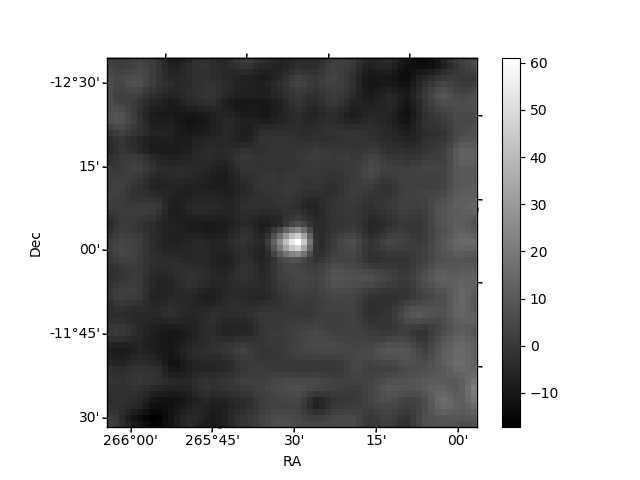
Histogram calculated using DETX and DETY for each event in the final _common_clean file
| Quadrant A | 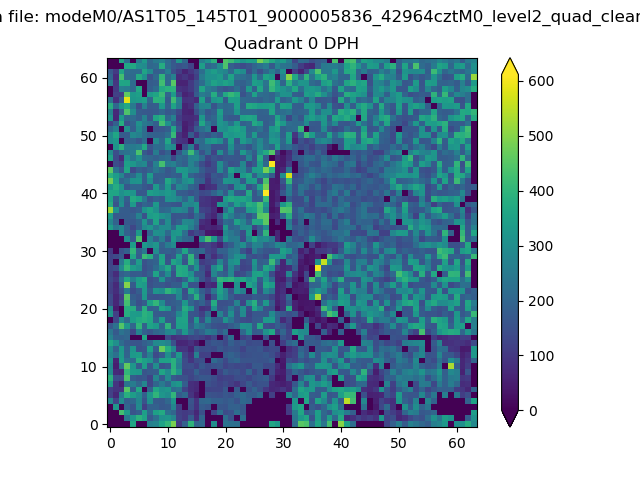 |
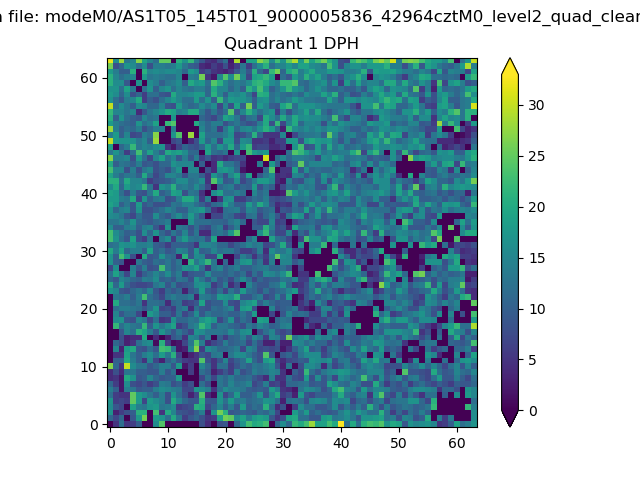 |
Quadrant B |
|---|---|---|---|
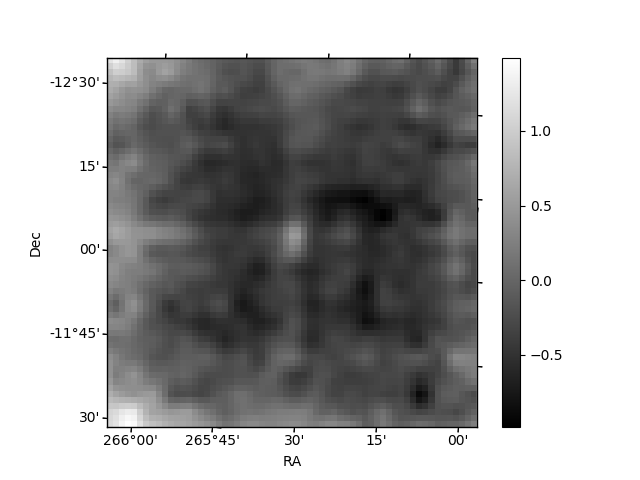
| Quadrant D | 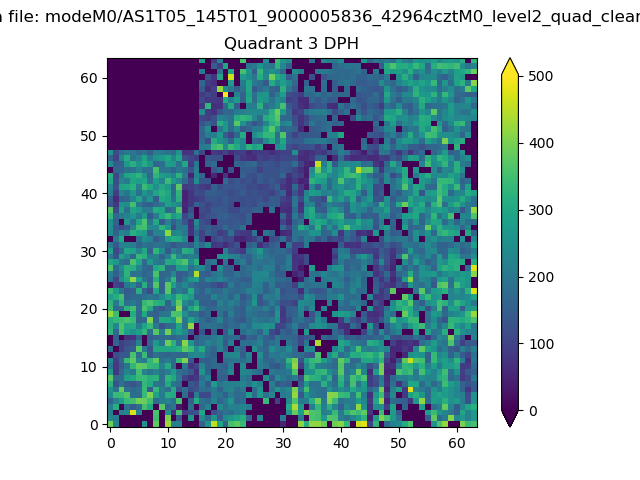 |
 |
Quadrant C |
| Plot type | Count rate plots | Images |
|---|---|---|
| Comparison with Poisson distribution Blue bars denote a histogram of data divided into 1 sec bins. Red curve is a Poisson curve with rate = median count rate of data. |
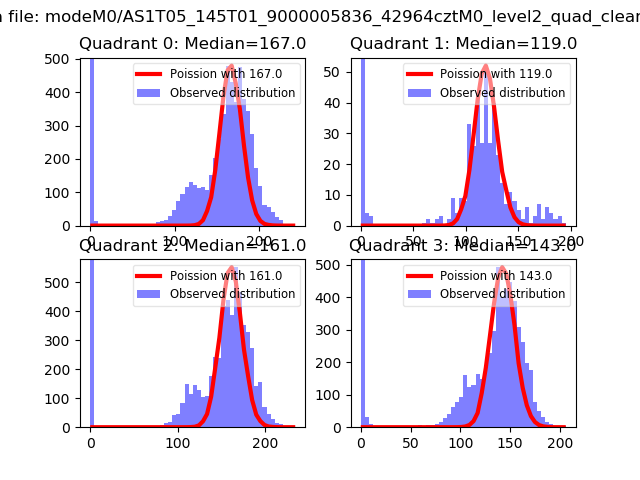 |
 |
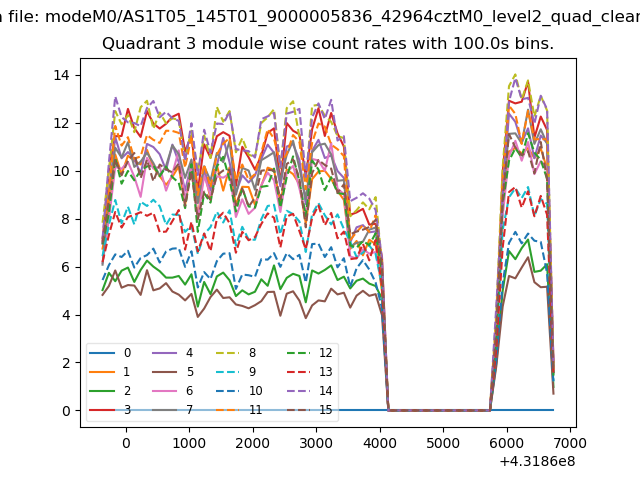
| Quadrant-wise count rates Data is divided into 100 sec bins |
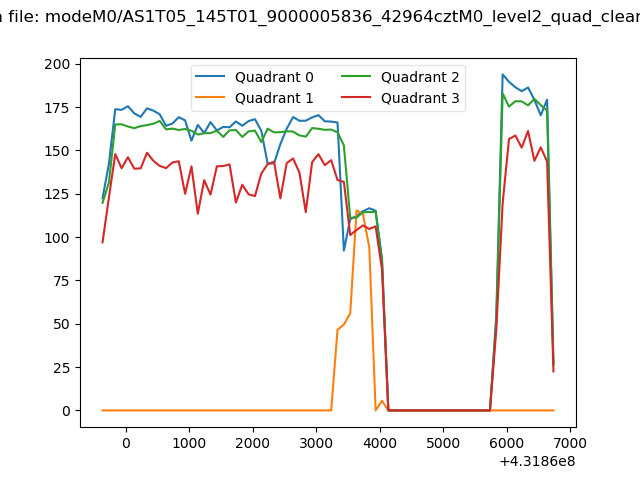 |
|
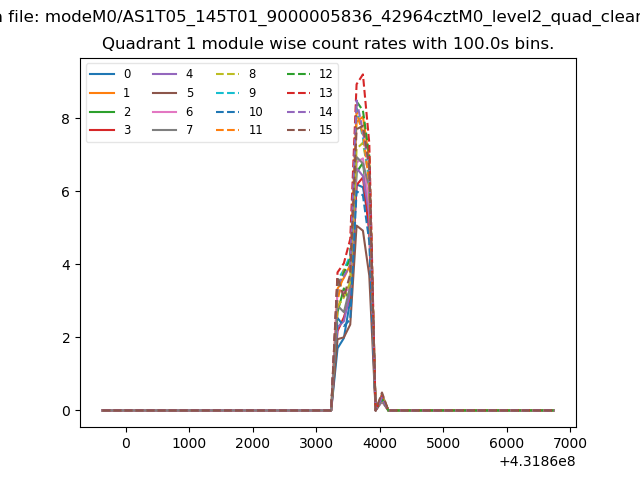
| Module-wise count rates for Quadrant A Data is divided into 100 sec bins |
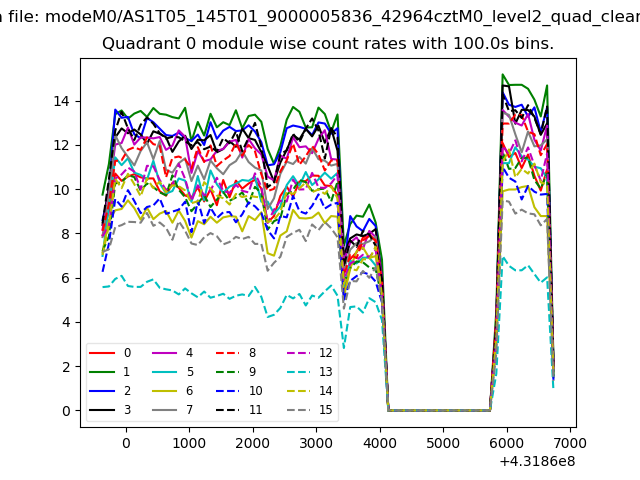 |
 |
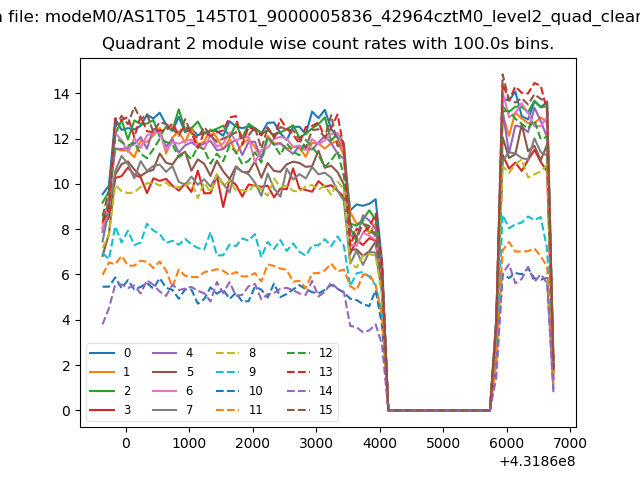
| Module-wise count rates for Quadrant B Data is divided into 100 sec bins |
 |
 |
| Module-wise count rates for Quadrant C Data is divided into 100 sec bins |
 |
 |
| Module-wise count rates for Quadrant D Data is divided into 100 sec bins |
 |
 |
| Parameter | Plot |
|---|---|
| CZT HV Monitor | 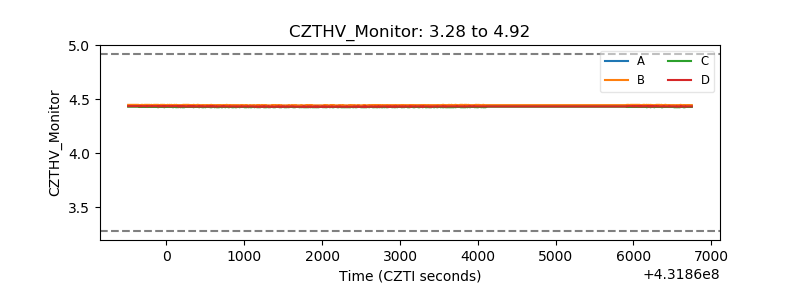 |
| D_VDD | 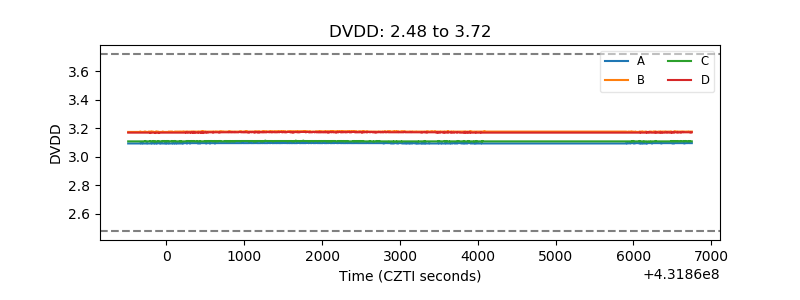 |
| Temperature 1 | 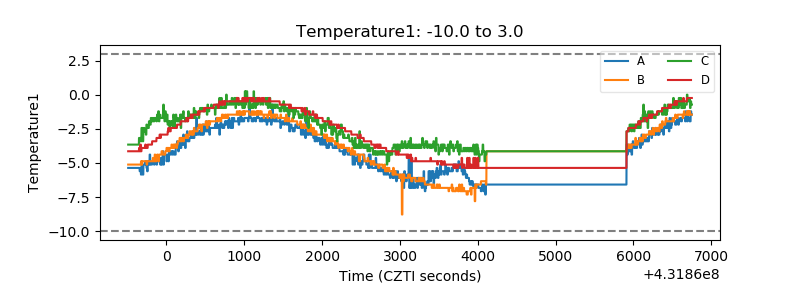 |
| Veto HV Monitor | 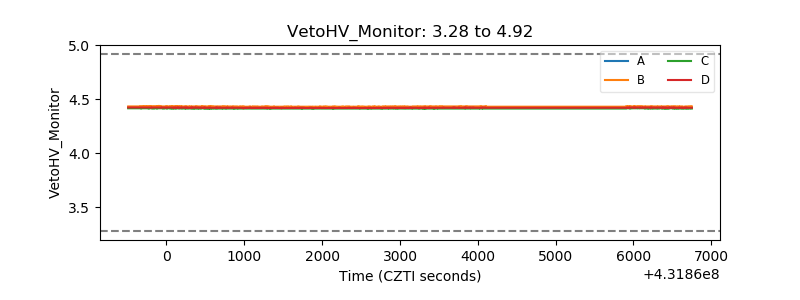 |
| Veto LLD | 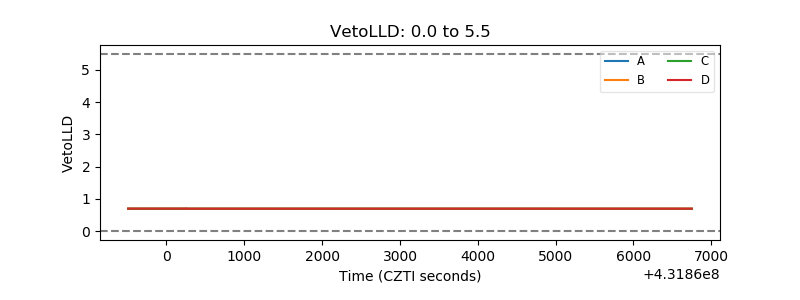 |
| Alpha Counter | 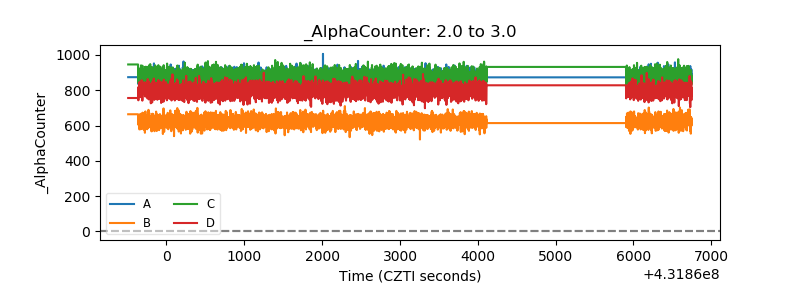 |
| _CPM_Rate | 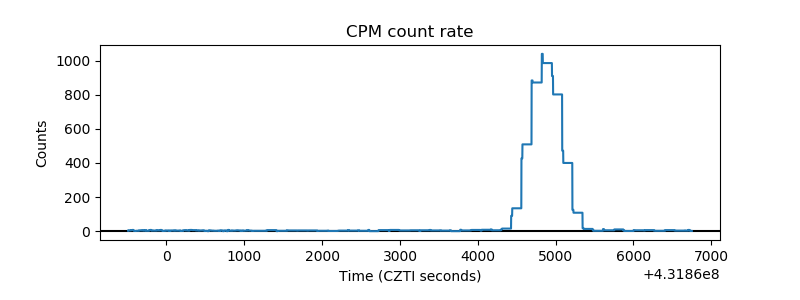 |
| CZT Counter | 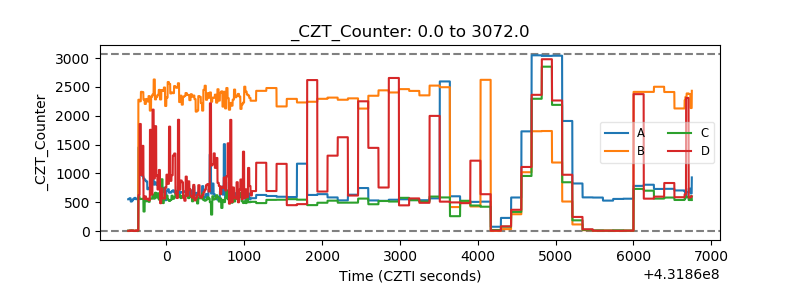 |
| +2.5 Volts monitor | 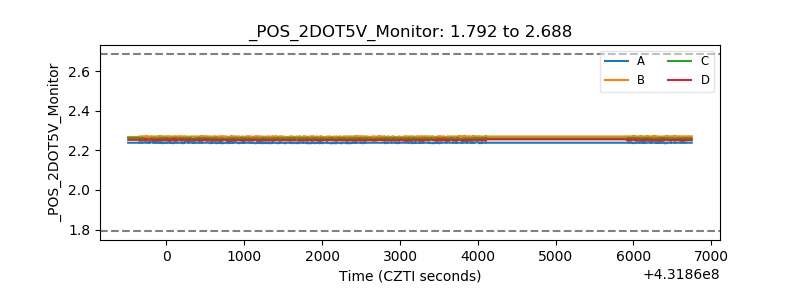 |
| +5 Volts monitor |  |
| _ROLL_ROT | 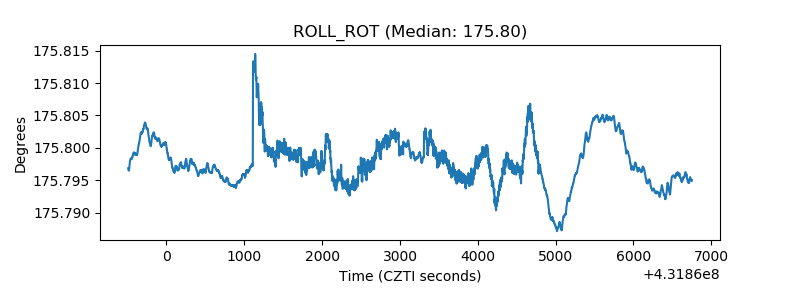 |
| _Roll_DEC | 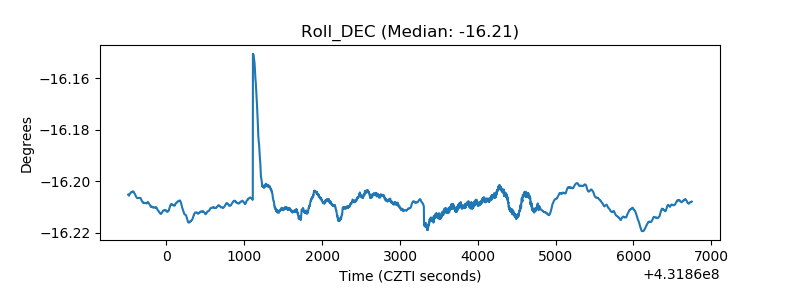 |
| _Roll_RA | 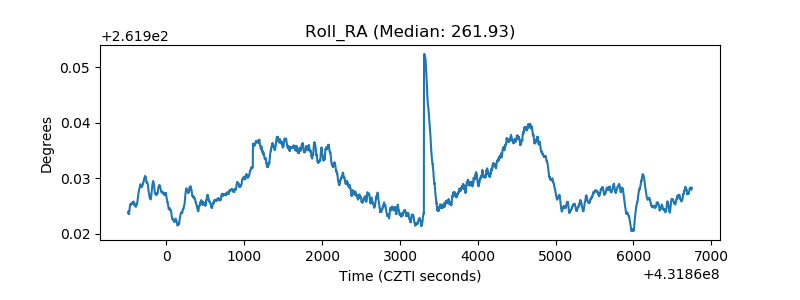 |
| Veto Counter | 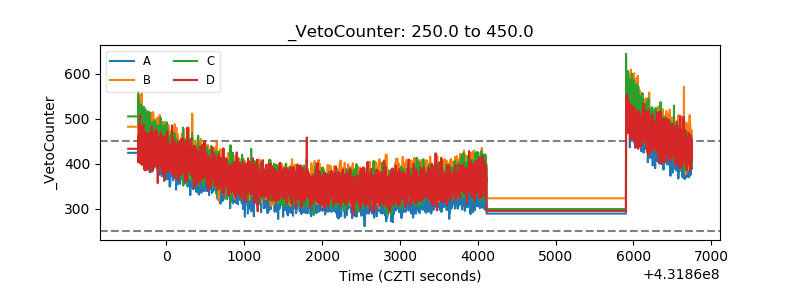 |