| Param | Original file | Final file |
|---|---|---|
| Filename | modeM0/AS1T05_145T01_9000005836_42965cztM0_level2.fits | modeM0/AS1T05_145T01_9000005836_42965cztM0_level2_quad_clean.evt |
| Size (bytes) | 666,797,760 | 97,634,880 |
| Size | 635.9 MB | 93.1 MB |
| Events in quadrant A | 4,002,491 | 902,099 |
| Events in quadrant B | 13,099,051 | 28,747 |
| Events in quadrant C | 2,970,588 | 877,249 |
| Events in quadrant D | 4,186,723 | 767,127 |
| Mode M0 | |||
|---|---|---|---|
| Quadrant | BADHDUFLAG | Total packets | Discarded packets |
| A | 0 | 15662 | 2 |
| B | 0 | 42509 | 6 |
| C | 0 | 12093 | 2 |
| D | 0 | 16129 | 2 |
| Mode M9 | |||
|---|---|---|---|
| Quadrant | BADHDUFLAG | Total packets | Discarded packets |
| A | 0 | 24 | 0 |
| B | 0 | 25 | 0 |
| C | 0 | 25 | 0 |
| D | 0 | 25 | 0 |
| Mode SS | |||
|---|---|---|---|
| Quadrant | BADHDUFLAG | Total packets | Discarded packets |
| A | 0 | 112 | 0 |
| B | 0 | 112 | 0 |
| C | 0 | 112 | 0 |
| D | 0 | 112 | 0 |
| Quadrant | Total seconds | Saturated seconds | Saturation percentage |
|---|---|---|---|
| A | 5451 | 147 | 2.696753% |
| B | 5450 | 5250 | 96.330275% |
| C | 5450 | 5 | 0.091743% |
| D | 5450 | 264 | 4.844037% |
Noise dominated data is calculated using 1-second bins in cleaned event files. If a bin has >2000 counts, and if more than 50% of those come from <1% of pixels, then it is considered to be noise-dominated and hence unusable.
| Quadrant | # 1 sec bins | Bins with >0 counts | Bins with >2000 counts | High rate bins dominated by noise | Noise dominated (total time) | Noise dominated (detector-on time) | Marked lightcurve |
|---|---|---|---|---|---|---|---|
| A | 7364 | 5452 | 114 | 114 | 1.55% | 2.09% | 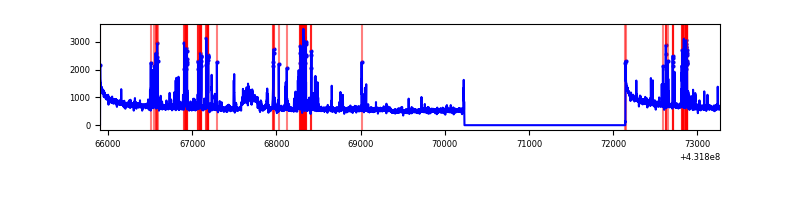 |
| B | 7363 | 5451 | 5106 | 5106 | 69.35% | 93.67% | 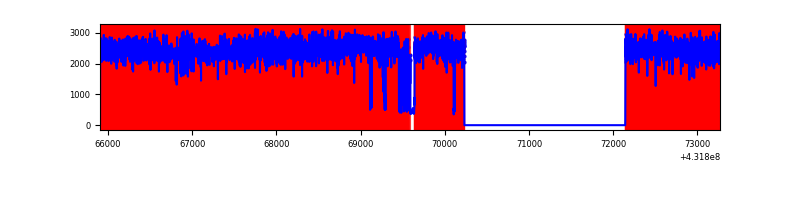 |
| C | 7363 | 5451 | 1 | 1 | 0.01% | 0.02% | 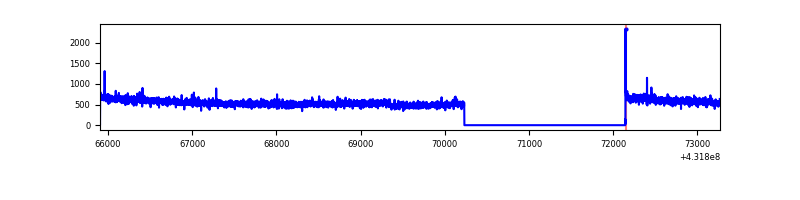 |
| D | 7363 | 5450 | 241 | 241 | 3.27% | 4.42% | 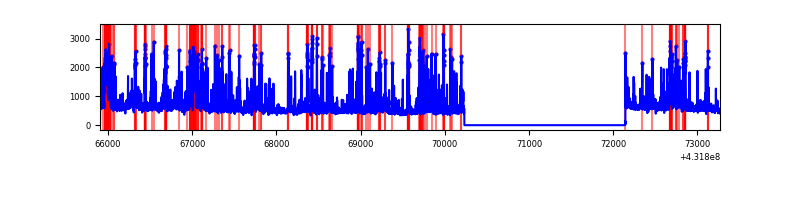 |
Top three noisy pixels from each quadrant. If the there are fewer than three noisy pixels in the level2.evt file, extra rows are filled as -1
| Pixel properties | Quadrant properties | ||||||
|---|---|---|---|---|---|---|---|
| Quadrant | DetID | PixID | Counts | Sigma | Mean | Median | Sigma |
| A | 10 | 83 | 608606 | 3538.91 | 723 | 701 | 171.8 |
| A | 15 | 237 | 570646 | 3317.92 | 723 | 701 | 171.8 |
| A | 15 | 222 | 21187 | 119.26 | 723 | 701 | 171.8 |
| B | 4 | 81 | 12479160 | 438357.58 | 128 | 126 | 28.5 |
| B | 4 | 171 | 103878 | 3644.55 | 128 | 126 | 28.5 |
| B | 5 | 172 | 3973 | 135.14 | 128 | 126 | 28.5 |
| C | 15 | 214 | 223530 | 1255.69 | 698 | 706 | 177.5 |
| C | 3 | 233 | 13425 | 71.68 | 698 | 706 | 177.5 |
| C | 14 | 254 | 9775 | 51.11 | 698 | 706 | 177.5 |
| D | 13 | 249 | 648199 | 3432.26 | 687 | 662 | 188.7 |
| D | 1 | 52 | 485349 | 2569.07 | 687 | 662 | 188.7 |
| D | 12 | 233 | 163212 | 861.59 | 687 | 662 | 188.7 |
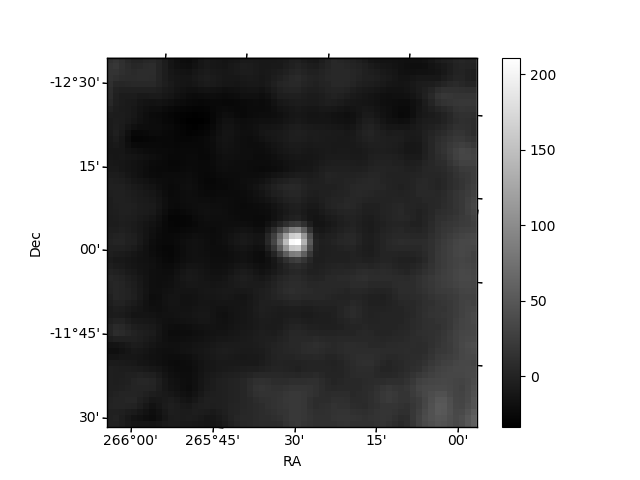
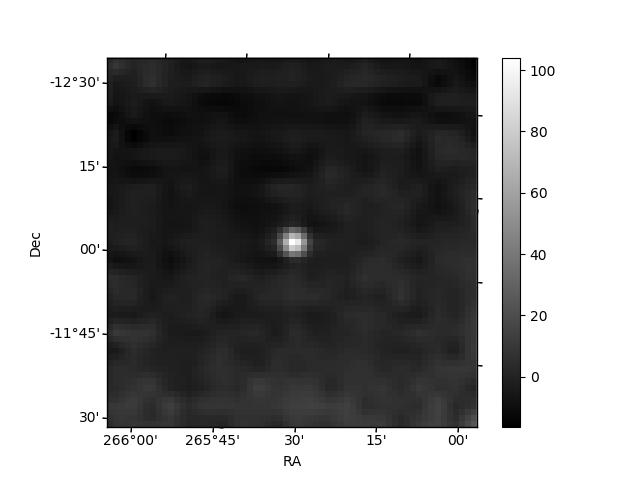
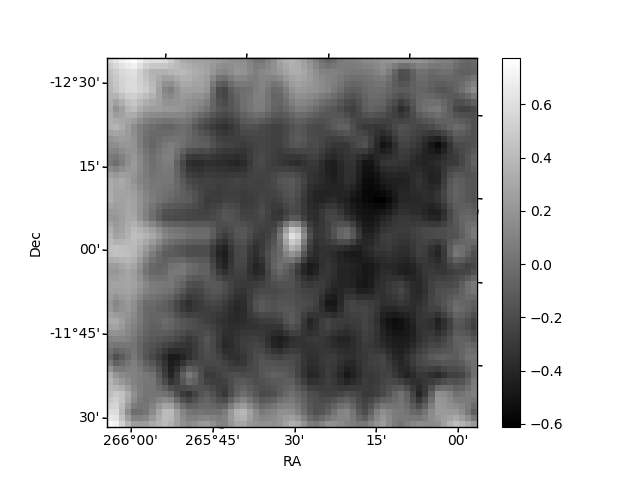
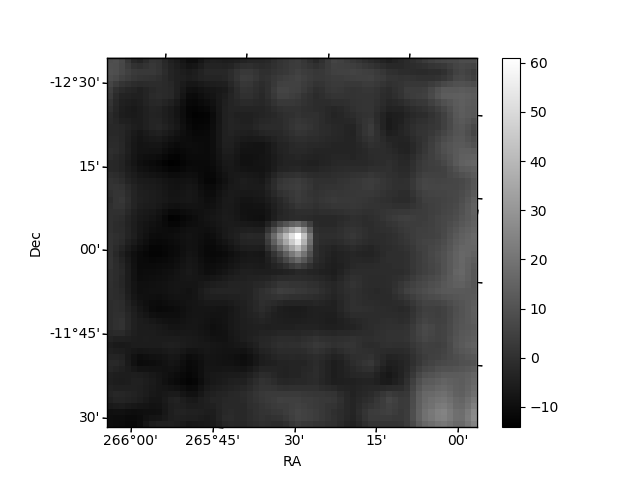
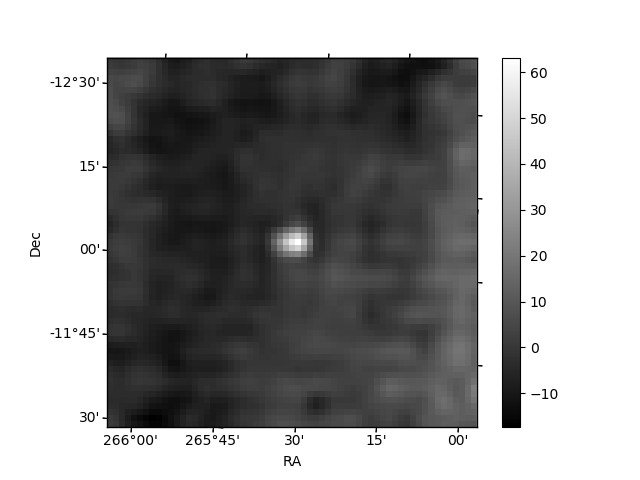
Histogram calculated using DETX and DETY for each event in the final _common_clean file
| Quadrant A | 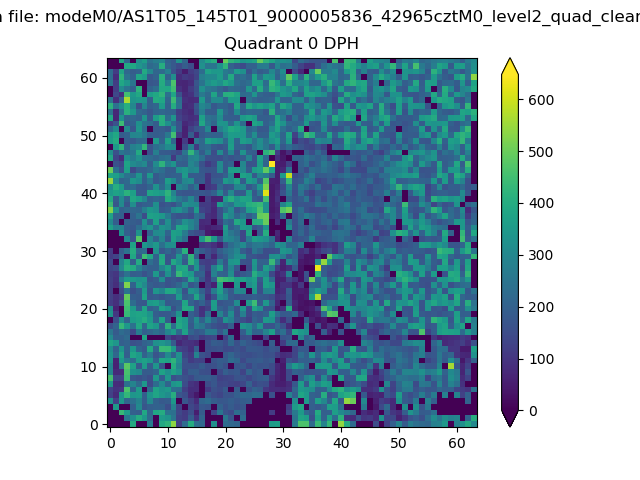 |
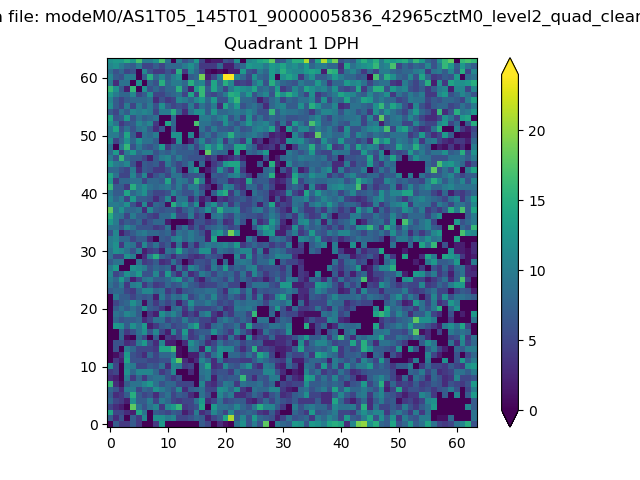 |
Quadrant B |
|---|---|---|---|
| Quadrant D | 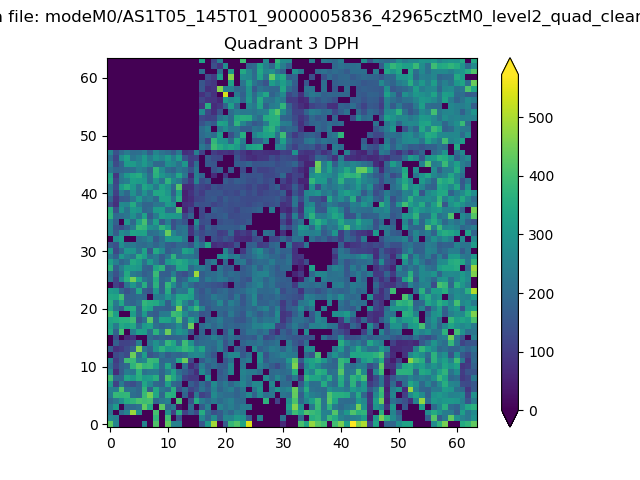 |
 |
Quadrant C |
| Plot type | Count rate plots | Images |
|---|---|---|
| Comparison with Poisson distribution Blue bars denote a histogram of data divided into 1 sec bins. Red curve is a Poisson curve with rate = median count rate of data. |
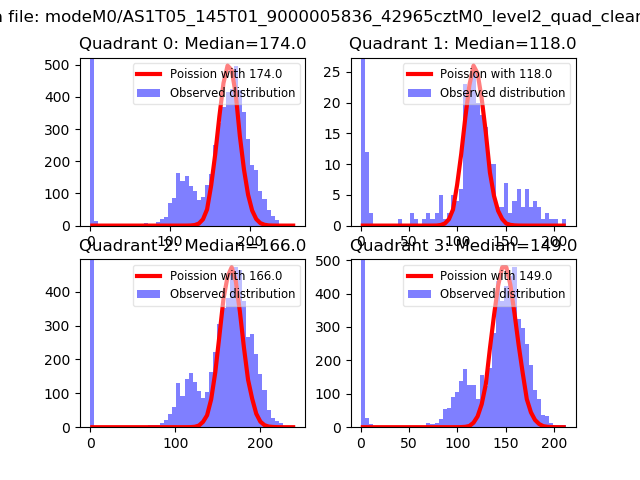 |
 |
| Quadrant-wise count rates Data is divided into 100 sec bins |
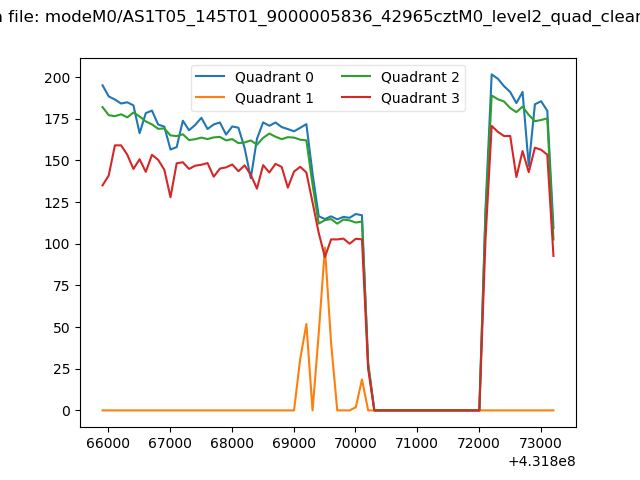 |
|
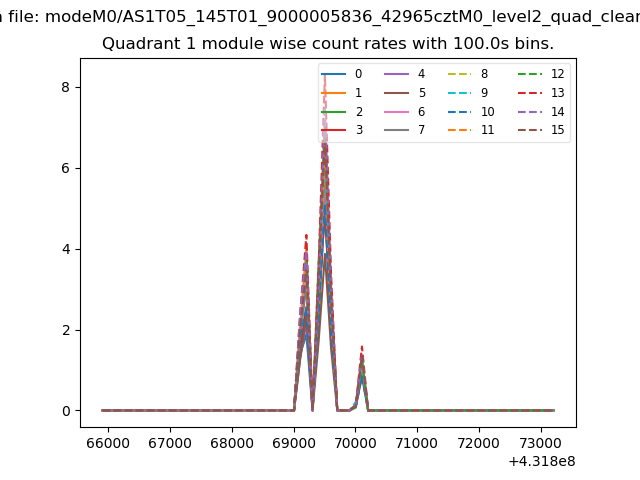
| Module-wise count rates for Quadrant A Data is divided into 100 sec bins |
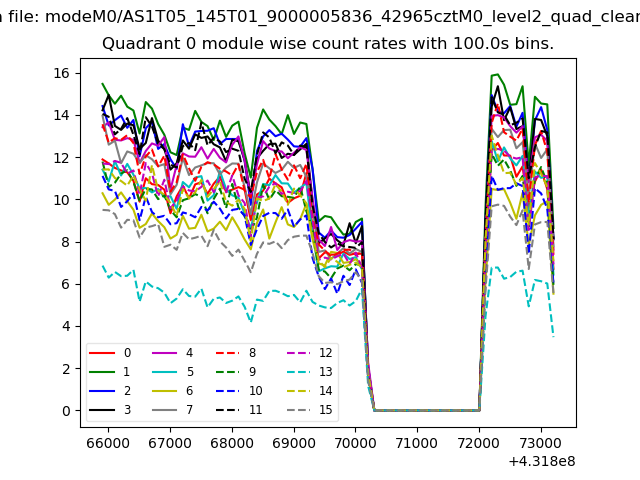 |
 |
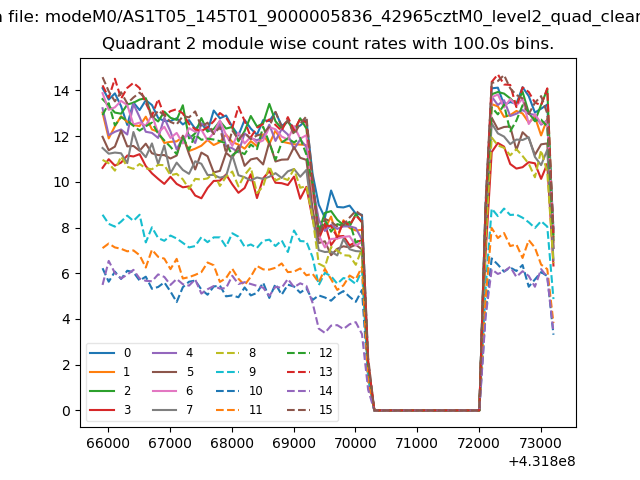
| Module-wise count rates for Quadrant B Data is divided into 100 sec bins |
 |
 |
| Module-wise count rates for Quadrant C Data is divided into 100 sec bins |
 |
 |
| Module-wise count rates for Quadrant D Data is divided into 100 sec bins |
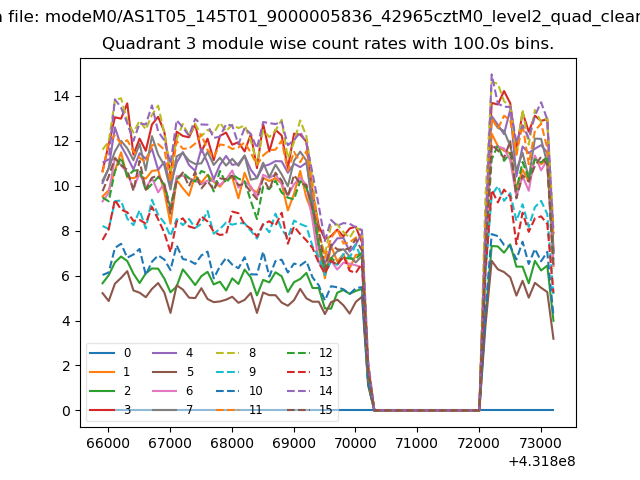 |
 |
| Parameter | Plot |
|---|---|
| CZT HV Monitor | 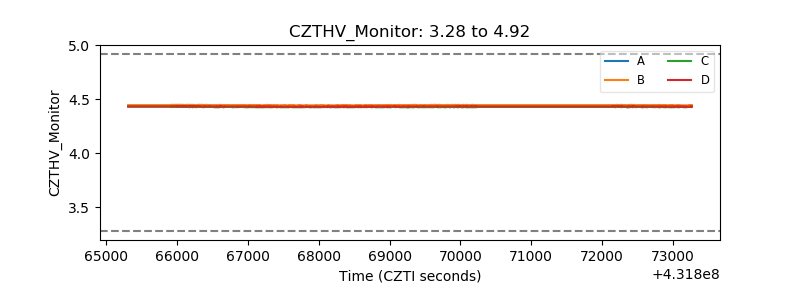 |
| D_VDD | 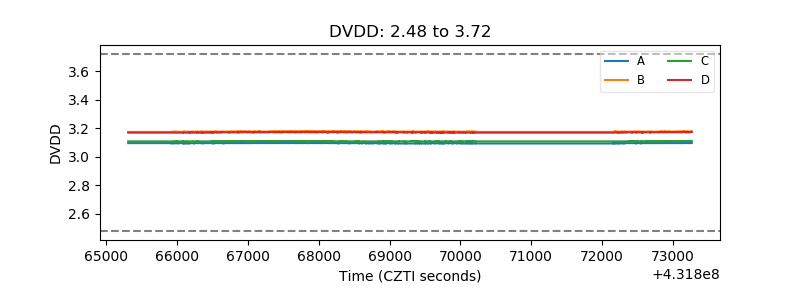 |
| Temperature 1 | 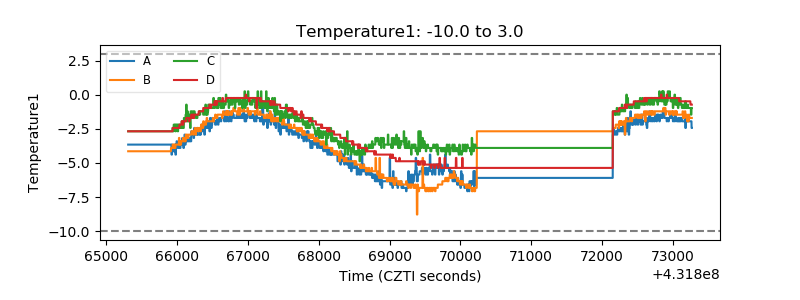 |
| Veto HV Monitor | 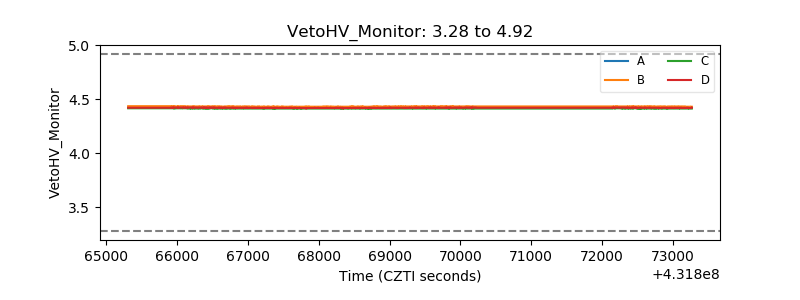 |
| Veto LLD | 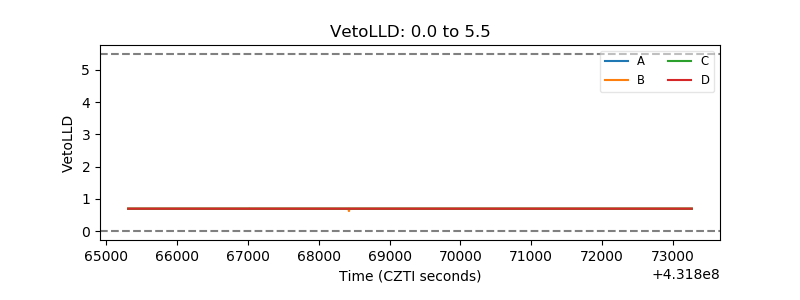 |
| Alpha Counter | 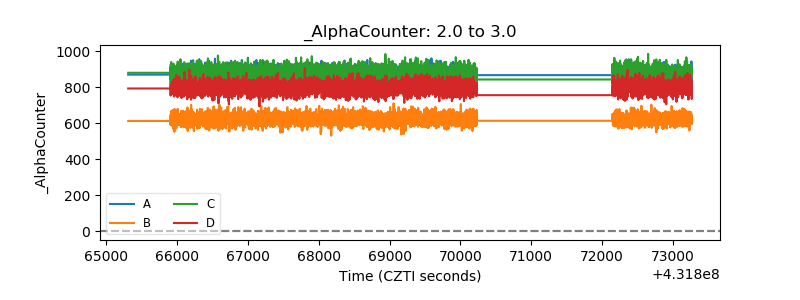 |
| _CPM_Rate | 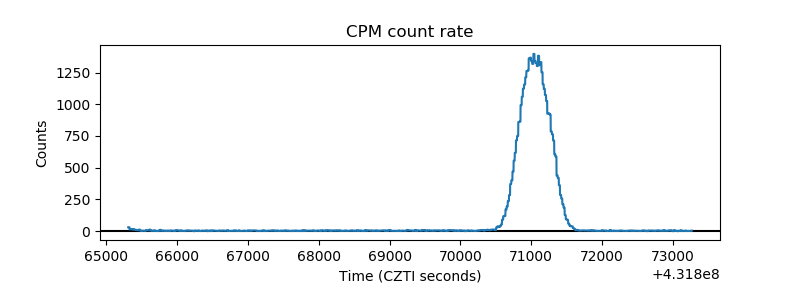 |
| CZT Counter | 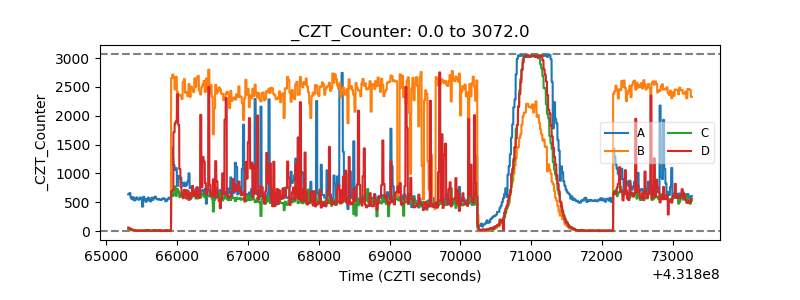 |
| +2.5 Volts monitor | 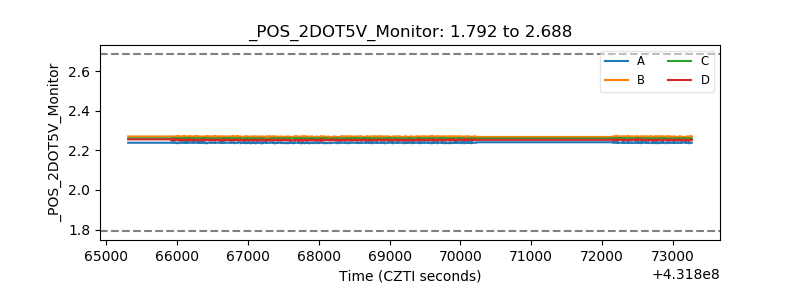 |
| +5 Volts monitor | 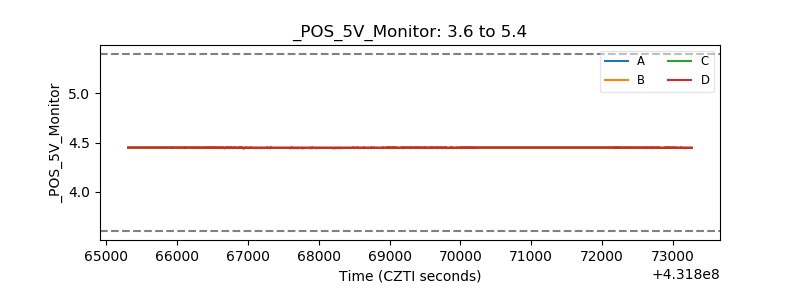 |
| _ROLL_ROT | 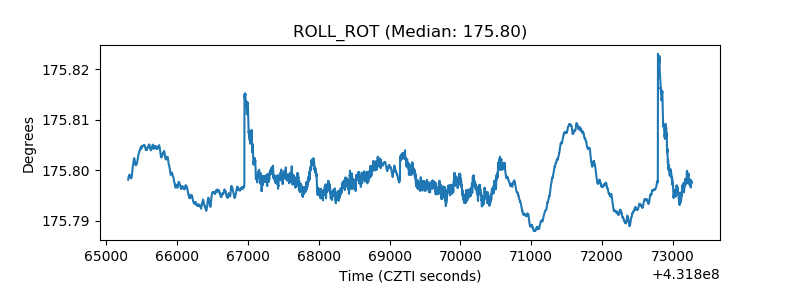 |
| _Roll_DEC | 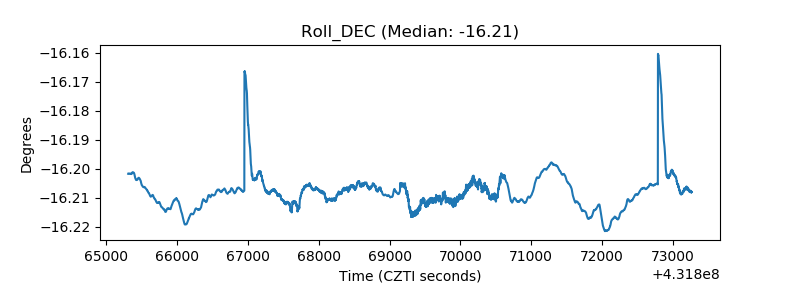 |
| _Roll_RA | 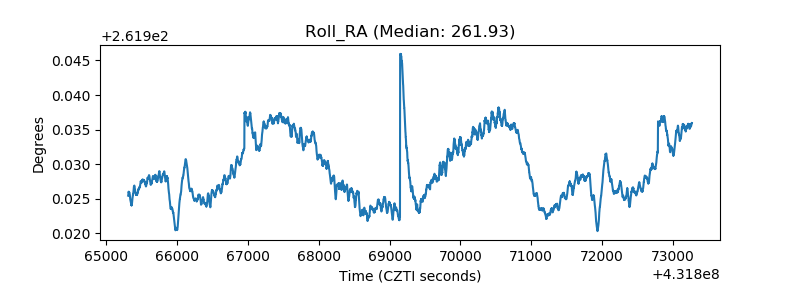 |
| Veto Counter | 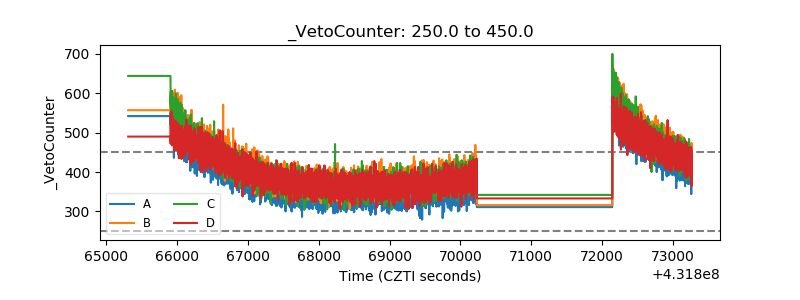 |