| Param | Original file | Final file |
|---|---|---|
| Filename | modeM0/AS1T05_145T01_9000005836_42966cztM0_level2.fits | modeM0/AS1T05_145T01_9000005836_42966cztM0_level2_quad_clean.evt |
| Size (bytes) | 607,040,640 | 90,253,440 |
| Size | 578.9 MB | 86.1 MB |
| Events in quadrant A | 3,599,126 | 830,811 |
| Events in quadrant B | 11,957,351 | 35,928 |
| Events in quadrant C | 2,722,838 | 809,058 |
| Events in quadrant D | 3,798,602 | 704,604 |
| Mode M0 | |||
|---|---|---|---|
| Quadrant | BADHDUFLAG | Total packets | Discarded packets |
| A | 0 | 14094 | 1 |
| B | 0 | 38802 | 1 |
| C | 0 | 11032 | 2 |
| D | 0 | 14581 | 1 |
| Mode M9 | |||
|---|---|---|---|
| Quadrant | BADHDUFLAG | Total packets | Discarded packets |
| A | 0 | 21 | 0 |
| B | 0 | 21 | 0 |
| C | 0 | 21 | 0 |
| D | 0 | 21 | 0 |
| Mode SS | |||
|---|---|---|---|
| Quadrant | BADHDUFLAG | Total packets | Discarded packets |
| A | 0 | 100 | 0 |
| B | 0 | 100 | 0 |
| C | 0 | 100 | 0 |
| D | 0 | 100 | 0 |
| Quadrant | Total seconds | Saturated seconds | Saturation percentage |
|---|---|---|---|
| A | 5044 | 154 | 3.053132% |
| B | 5045 | 4783 | 94.806739% |
| C | 5044 | 3 | 0.059477% |
| D | 5044 | 240 | 4.758128% |
Noise dominated data is calculated using 1-second bins in cleaned event files. If a bin has >2000 counts, and if more than 50% of those come from <1% of pixels, then it is considered to be noise-dominated and hence unusable.
| Quadrant | # 1 sec bins | Bins with >0 counts | Bins with >2000 counts | High rate bins dominated by noise | Noise dominated (total time) | Noise dominated (detector-on time) | Marked lightcurve |
|---|---|---|---|---|---|---|---|
| A | 7077 | 5045 | 126 | 126 | 1.78% | 2.50% | 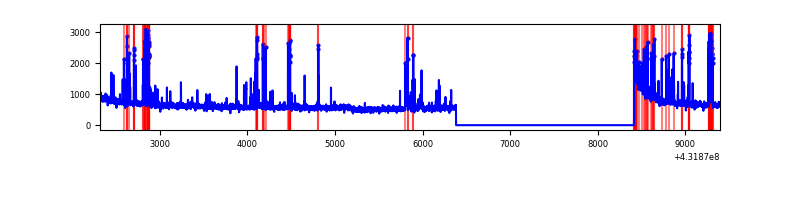 |
| B | 7078 | 5046 | 4647 | 4647 | 65.65% | 92.09% | 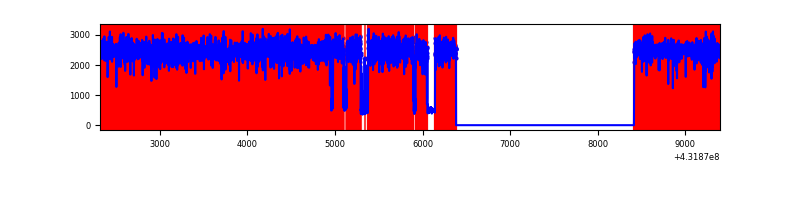 |
| C | 7077 | 5045 | 0 | 0 | 0.00% | 0.00% | 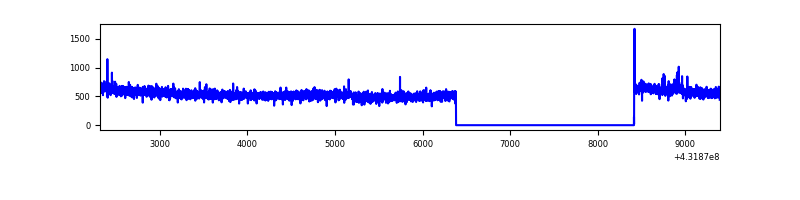 |
| D | 7077 | 5045 | 218 | 218 | 3.08% | 4.32% | 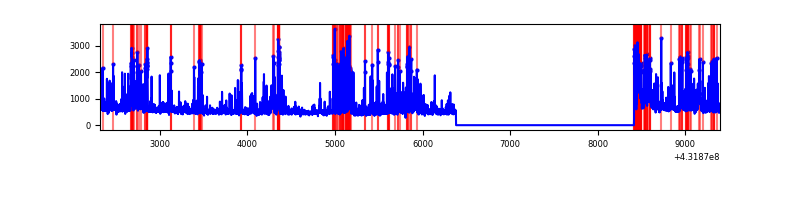 |
Top three noisy pixels from each quadrant. If the there are fewer than three noisy pixels in the level2.evt file, extra rows are filled as -1
| Pixel properties | Quadrant properties | ||||||
|---|---|---|---|---|---|---|---|
| Quadrant | DetID | PixID | Counts | Sigma | Mean | Median | Sigma |
| A | 10 | 83 | 519262 | 3347.83 | 662 | 645 | 154.9 |
| A | 15 | 237 | 422730 | 2724.69 | 662 | 645 | 154.9 |
| A | 15 | 222 | 73337 | 469.25 | 662 | 645 | 154.9 |
| B | 4 | 81 | 11385922 | 413239.25 | 127 | 124 | 27.6 |
| B | 4 | 171 | 59487 | 2154.54 | 127 | 124 | 27.6 |
| B | 3 | 112 | 4093 | 144.05 | 127 | 124 | 27.6 |
| C | 15 | 214 | 203748 | 1253.56 | 641 | 649 | 162.0 |
| C | 3 | 233 | 14393 | 84.83 | 641 | 649 | 162.0 |
| C | 12 | 2 | 6625 | 36.88 | 641 | 649 | 162.0 |
| D | 13 | 249 | 422993 | 2483.25 | 627 | 607 | 170.1 |
| D | 1 | 52 | 360493 | 2115.81 | 627 | 607 | 170.1 |
| D | 12 | 16 | 131926 | 772.04 | 627 | 607 | 170.1 |
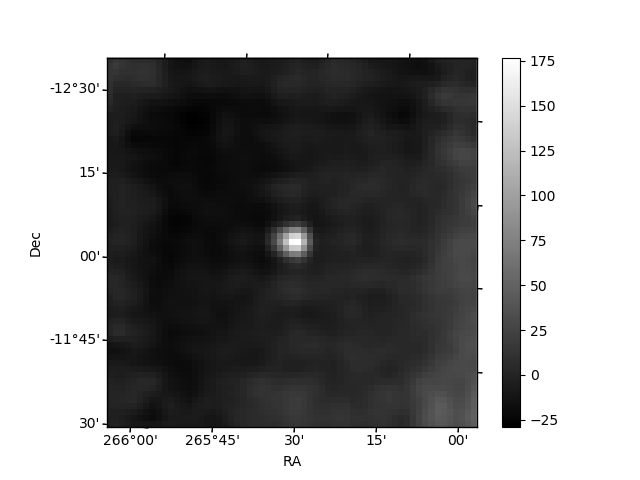
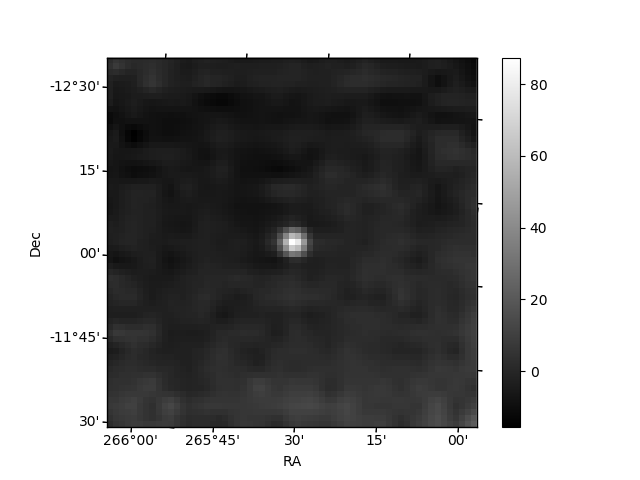
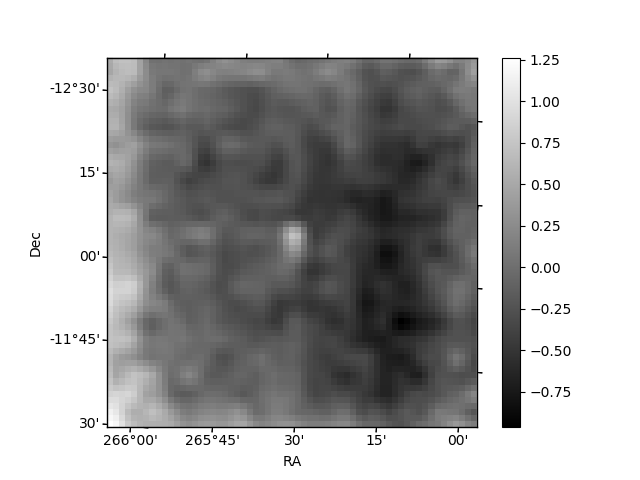
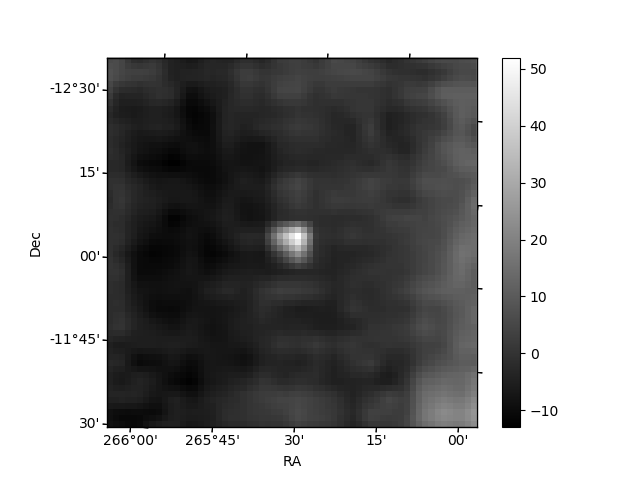
Histogram calculated using DETX and DETY for each event in the final _common_clean file
| Quadrant A | 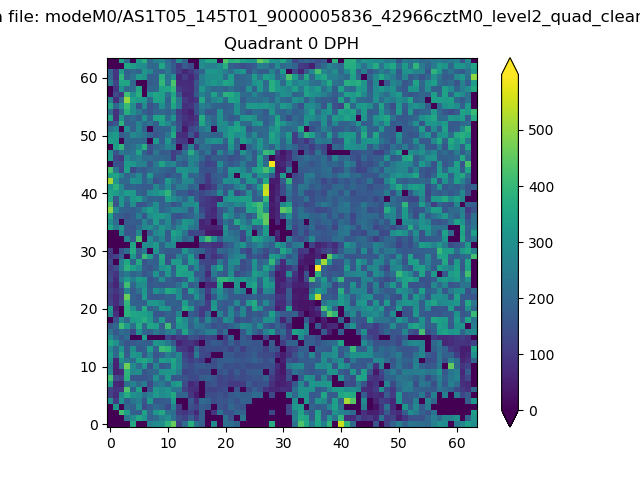 |
 |
Quadrant B |
|---|---|---|---|
| Quadrant D | 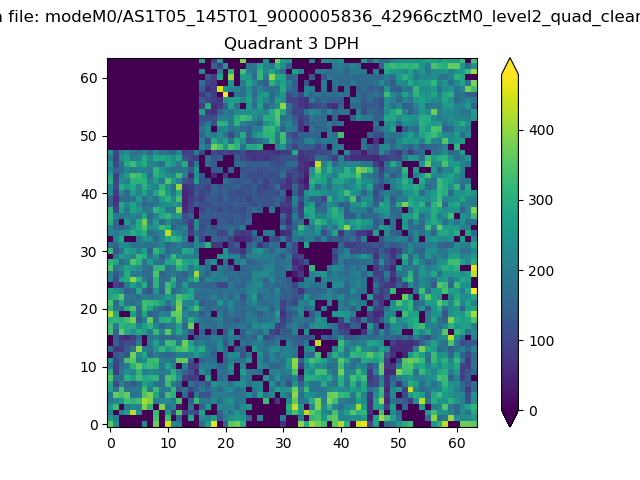 |
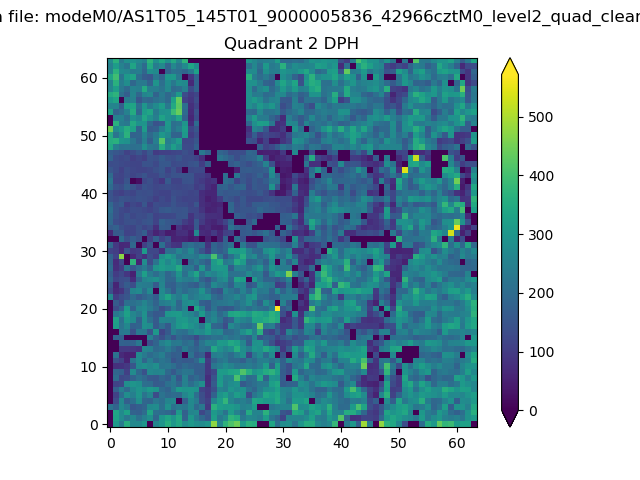 |
Quadrant C |
| Plot type | Count rate plots | Images |
|---|---|---|
| Comparison with Poisson distribution Blue bars denote a histogram of data divided into 1 sec bins. Red curve is a Poisson curve with rate = median count rate of data. |
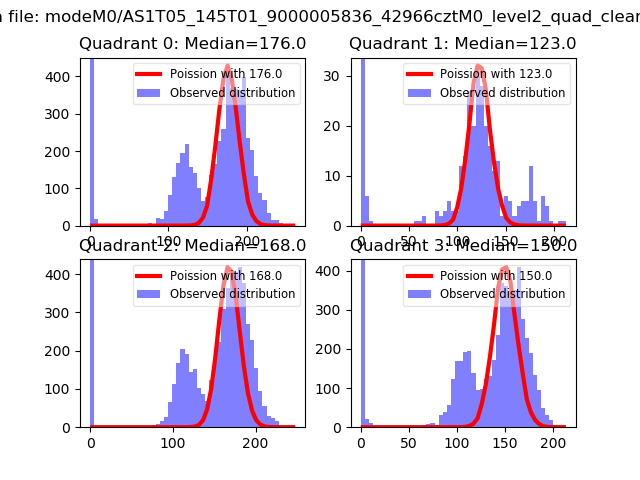 |
 |
| Quadrant-wise count rates Data is divided into 100 sec bins |
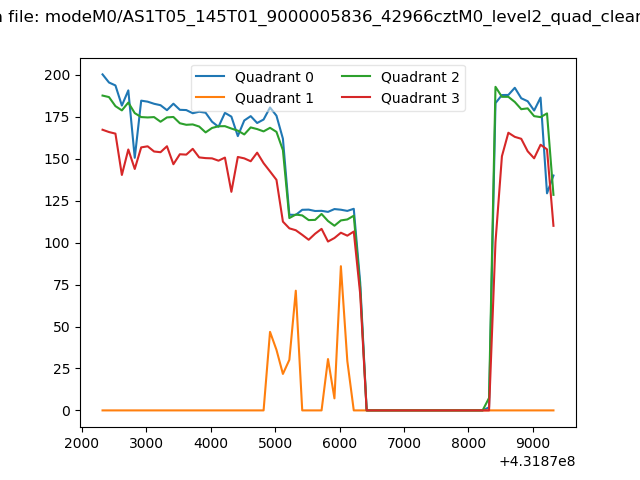 |
|
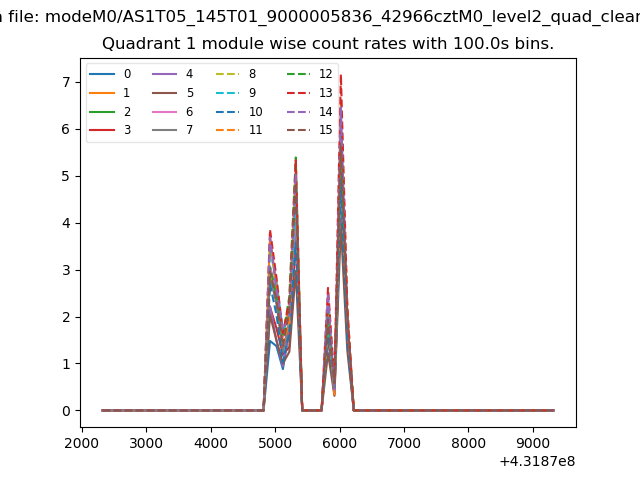
| Module-wise count rates for Quadrant A Data is divided into 100 sec bins |
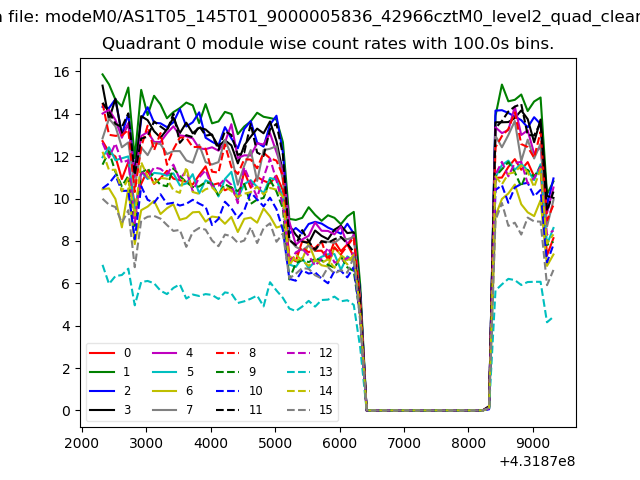 |
 |
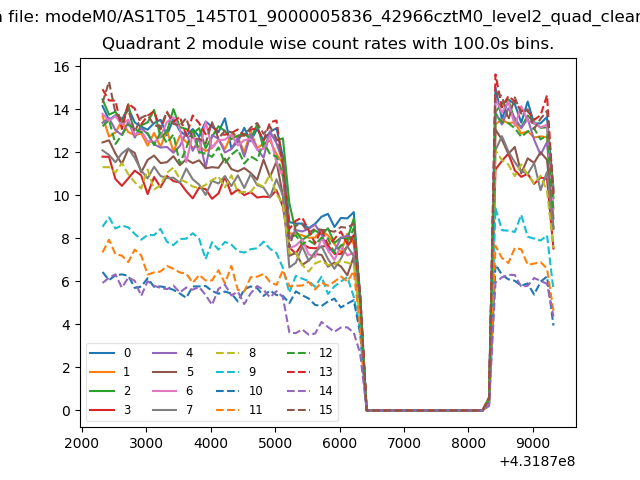
| Module-wise count rates for Quadrant B Data is divided into 100 sec bins |
 |
 |
| Module-wise count rates for Quadrant C Data is divided into 100 sec bins |
 |
 |
| Module-wise count rates for Quadrant D Data is divided into 100 sec bins |
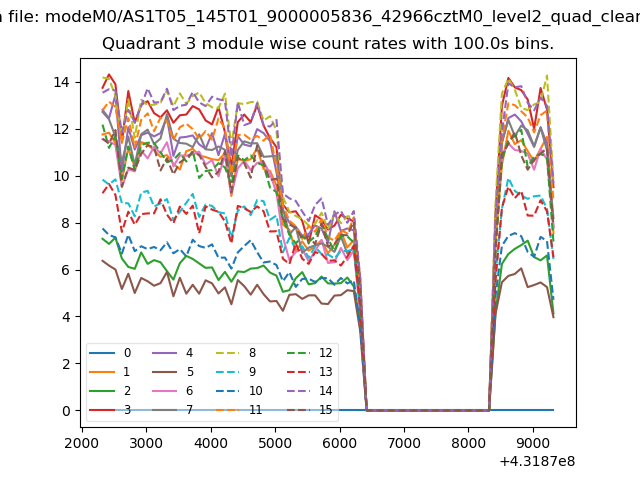 |
 |
| Parameter | Plot |
|---|---|
| CZT HV Monitor | 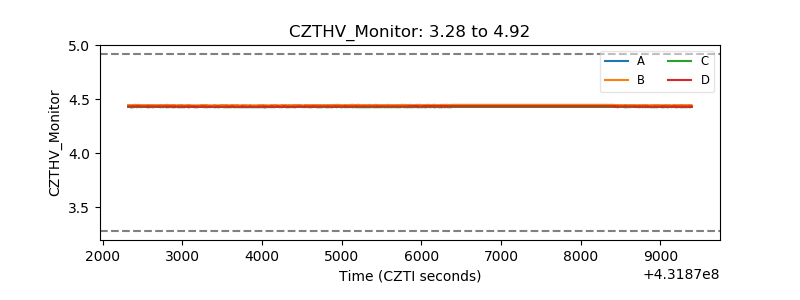 |
| D_VDD | 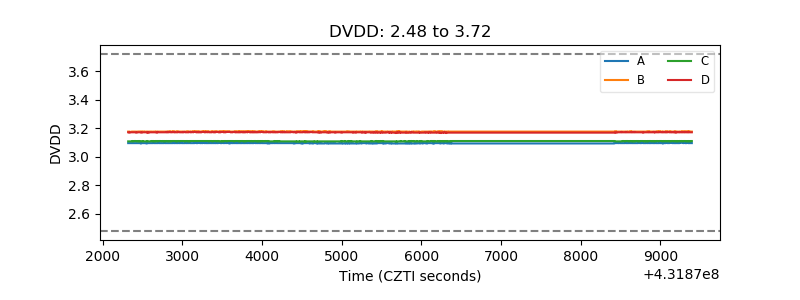 |
| Temperature 1 | 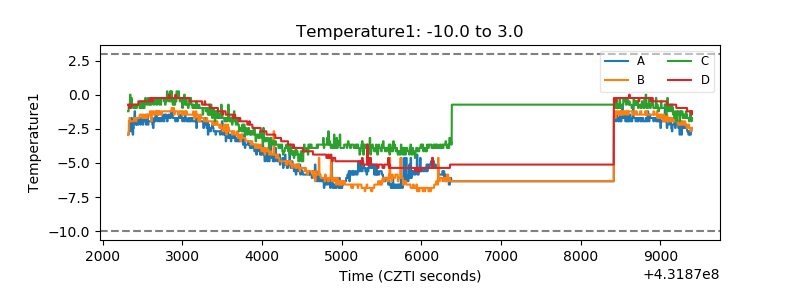 |
| Veto HV Monitor | 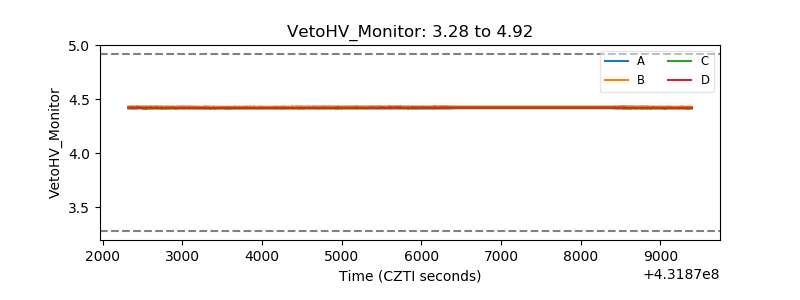 |
| Veto LLD | 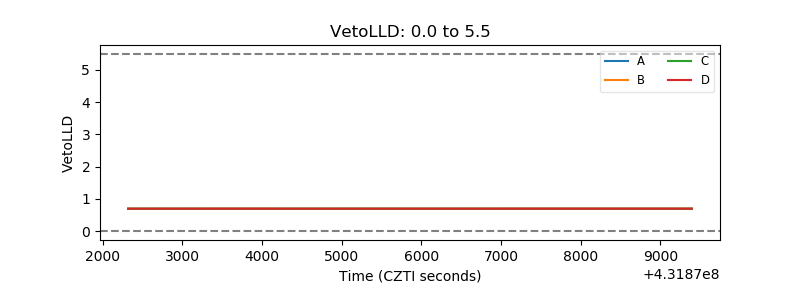 |
| Alpha Counter | 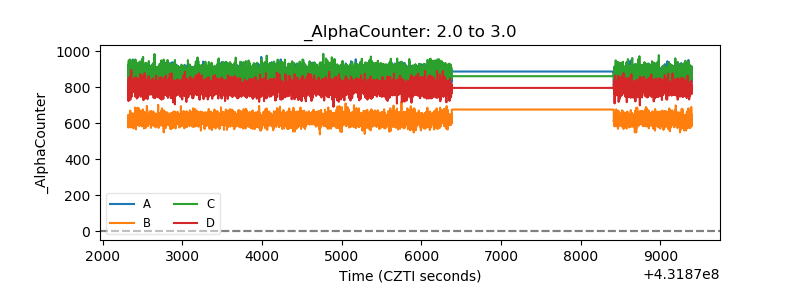 |
| _CPM_Rate | 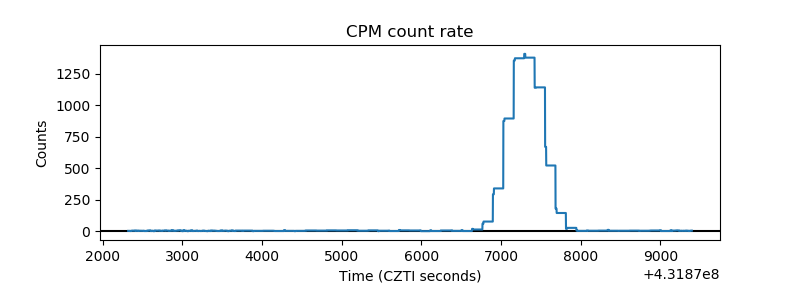 |
| CZT Counter | 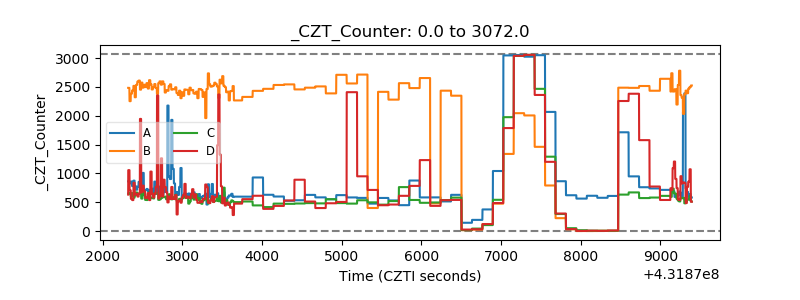 |
| +2.5 Volts monitor | 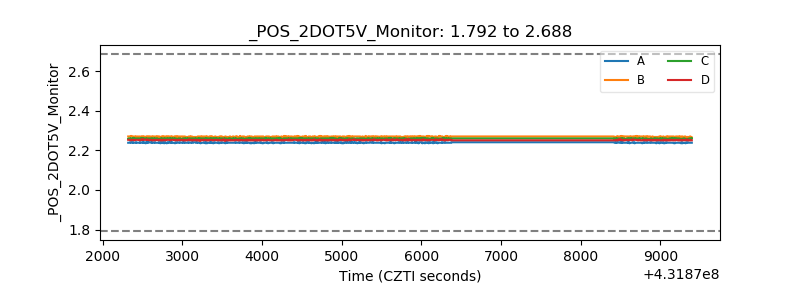 |
| +5 Volts monitor | 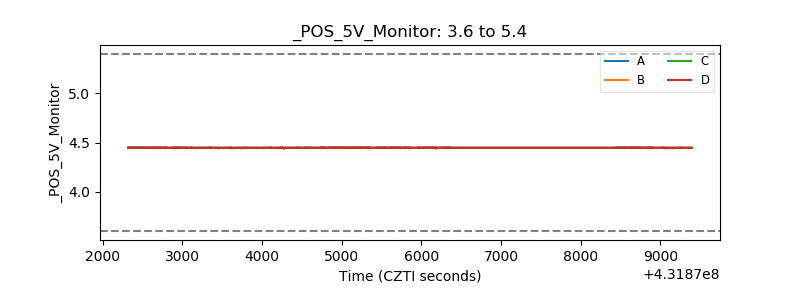 |
| _ROLL_ROT | 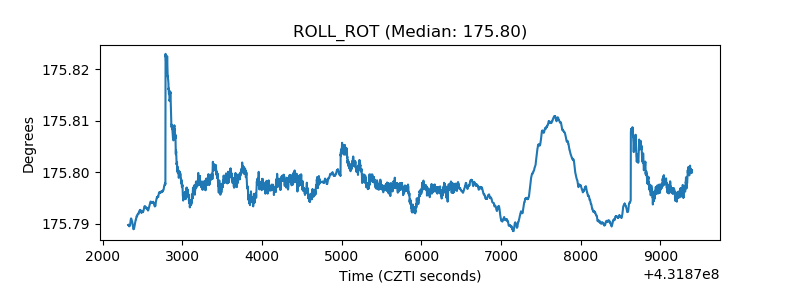 |
| _Roll_DEC | 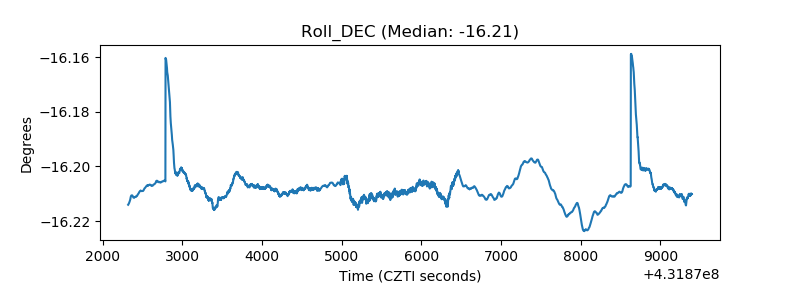 |
| _Roll_RA | 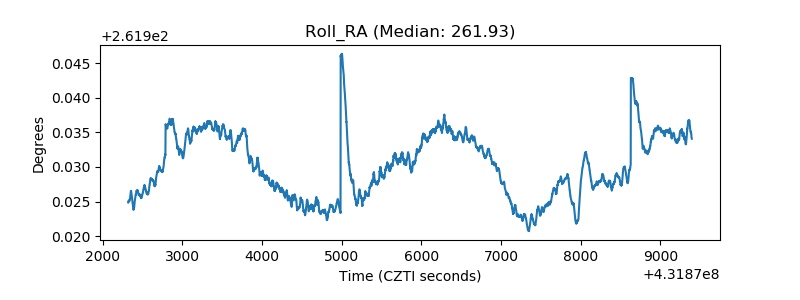 |
| Veto Counter | 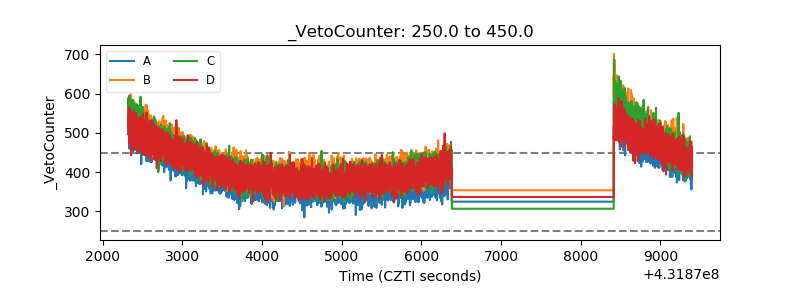 |