| Param | Original file | Final file |
|---|---|---|
| Filename | modeM0/AS1T05_145T01_9000005836_42967cztM0_level2.fits | modeM0/AS1T05_145T01_9000005836_42967cztM0_level2_quad_clean.evt |
| Size (bytes) | 634,723,200 | 85,599,360 |
| Size | 605.3 MB | 81.6 MB |
| Events in quadrant A | 3,516,473 | 802,363 |
| Events in quadrant B | 11,571,923 | 61,706 |
| Events in quadrant C | 2,670,010 | 779,344 |
| Events in quadrant D | 5,346,616 | 596,985 |
| Mode M0 | |||
|---|---|---|---|
| Quadrant | BADHDUFLAG | Total packets | Discarded packets |
| A | 0 | 13795 | 2 |
| B | 0 | 37680 | 2 |
| C | 0 | 10846 | 2 |
| D | 0 | 19327 | 2 |
| Mode M9 | |||
|---|---|---|---|
| Quadrant | BADHDUFLAG | Total packets | Discarded packets |
| A | 0 | 21 | 0 |
| B | 0 | 21 | 0 |
| C | 0 | 21 | 0 |
| D | 0 | 21 | 0 |
| Mode SS | |||
|---|---|---|---|
| Quadrant | BADHDUFLAG | Total packets | Discarded packets |
| A | 0 | 102 | 0 |
| B | 0 | 102 | 0 |
| C | 0 | 102 | 0 |
| D | 0 | 102 | 0 |
| Quadrant | Total seconds | Saturated seconds | Saturation percentage |
|---|---|---|---|
| A | 5022 | 126 | 2.508961% |
| B | 5022 | 4584 | 91.278375% |
| C | 5021 | 2 | 0.039833% |
| D | 5022 | 835 | 16.626842% |
Noise dominated data is calculated using 1-second bins in cleaned event files. If a bin has >2000 counts, and if more than 50% of those come from <1% of pixels, then it is considered to be noise-dominated and hence unusable.
| Quadrant | # 1 sec bins | Bins with >0 counts | Bins with >2000 counts | High rate bins dominated by noise | Noise dominated (total time) | Noise dominated (detector-on time) | Marked lightcurve |
|---|---|---|---|---|---|---|---|
| A | 7145 | 5023 | 95 | 95 | 1.33% | 1.89% | 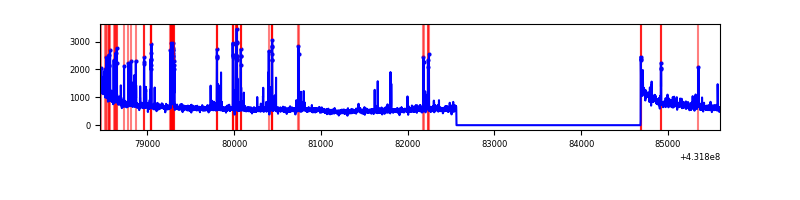 |
| B | 7145 | 5023 | 4406 | 4406 | 61.67% | 87.72% | 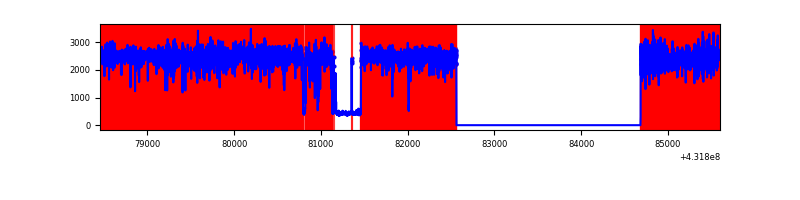 |
| C | 7144 | 5022 | 0 | 0 | 0.00% | 0.00% | 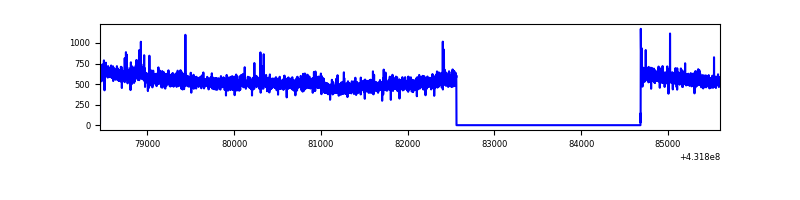 |
| D | 7145 | 5023 | 861 | 861 | 12.05% | 17.14% | 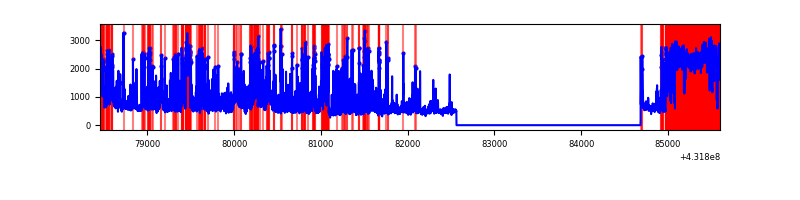 |
Top three noisy pixels from each quadrant. If the there are fewer than three noisy pixels in the level2.evt file, extra rows are filled as -1
| Pixel properties | Quadrant properties | ||||||
|---|---|---|---|---|---|---|---|
| Quadrant | DetID | PixID | Counts | Sigma | Mean | Median | Sigma |
| A | 10 | 83 | 562535 | 3818.75 | 645 | 632 | 147.1 |
| A | 15 | 237 | 335180 | 2273.62 | 645 | 632 | 147.1 |
| A | 15 | 222 | 113826 | 769.28 | 645 | 632 | 147.1 |
| B | 4 | 81 | 10795847 | 308428.28 | 164 | 161 | 35.0 |
| B | 4 | 171 | 75552 | 2153.89 | 164 | 161 | 35.0 |
| B | 0 | 186 | 26827 | 761.84 | 164 | 161 | 35.0 |
| C | 15 | 214 | 204413 | 1296.61 | 625 | 634 | 157.2 |
| C | 3 | 233 | 14628 | 89.04 | 625 | 634 | 157.2 |
| C | 12 | 2 | 9176 | 54.35 | 625 | 634 | 157.2 |
| D | 10 | 118 | 1465104 | 9501.0 | 573 | 556 | 154.1 |
| D | 13 | 249 | 462756 | 2998.44 | 573 | 556 | 154.1 |
| D | 1 | 52 | 386248 | 2502.11 | 573 | 556 | 154.1 |
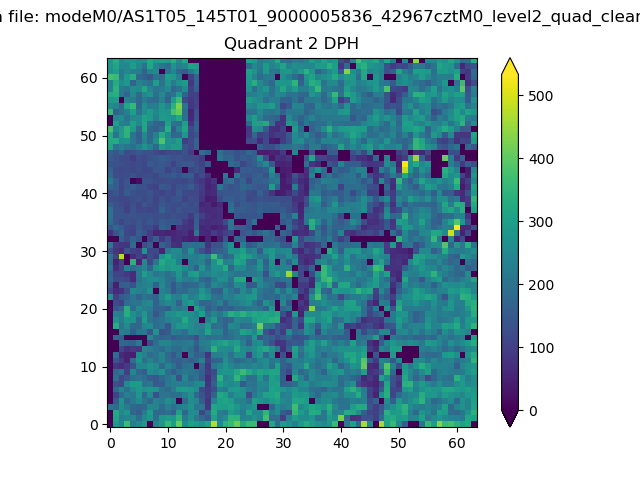
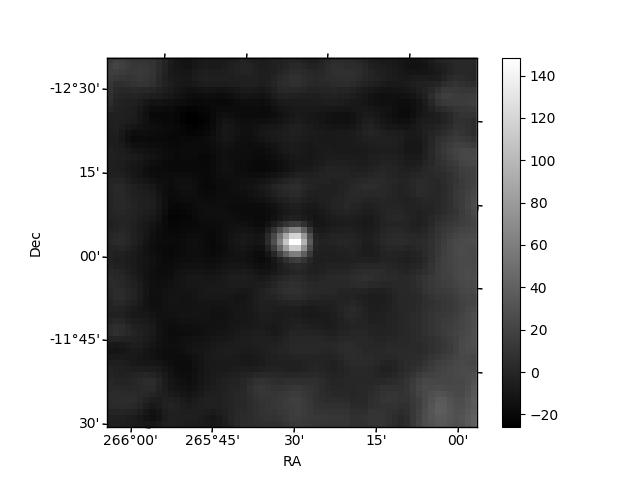
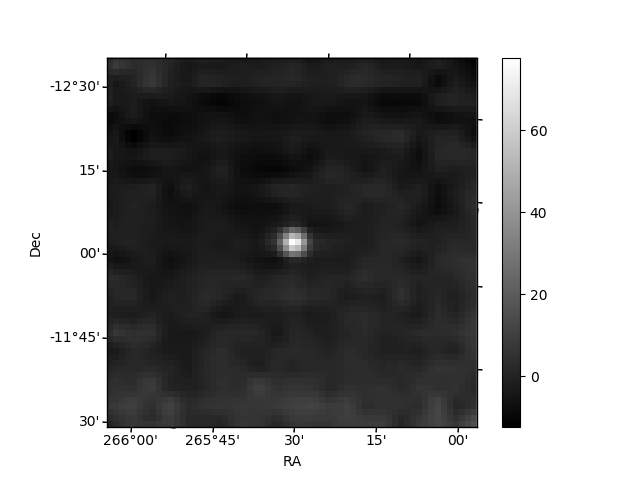
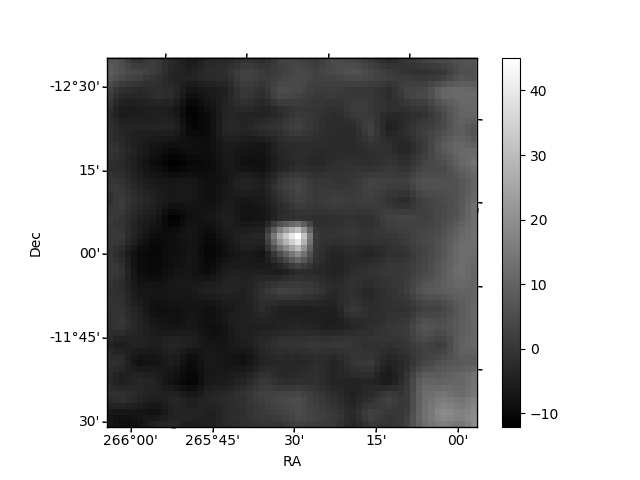
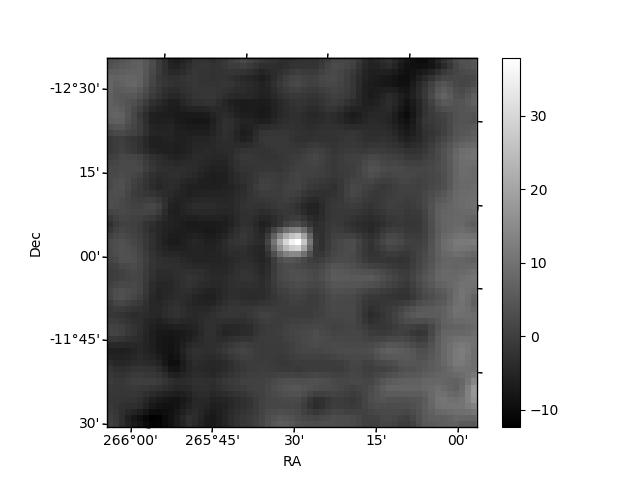
Histogram calculated using DETX and DETY for each event in the final _common_clean file
| Quadrant A | 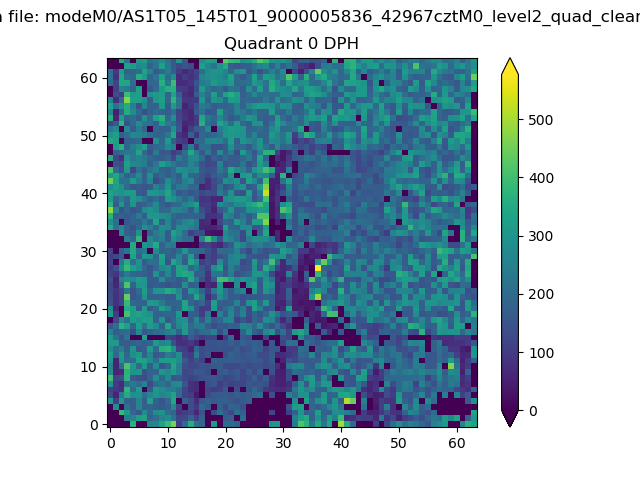 |
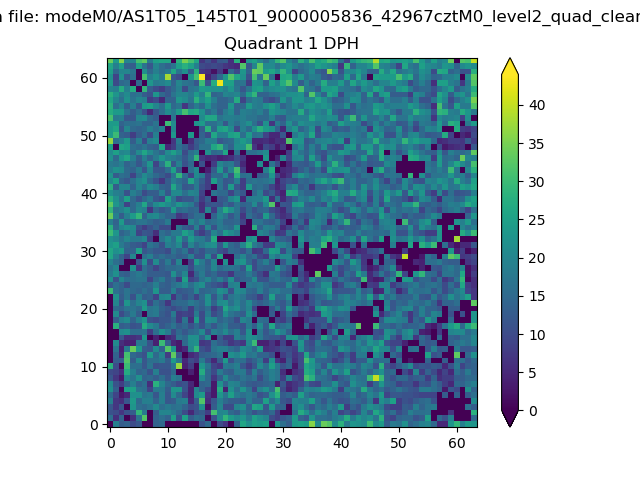 |
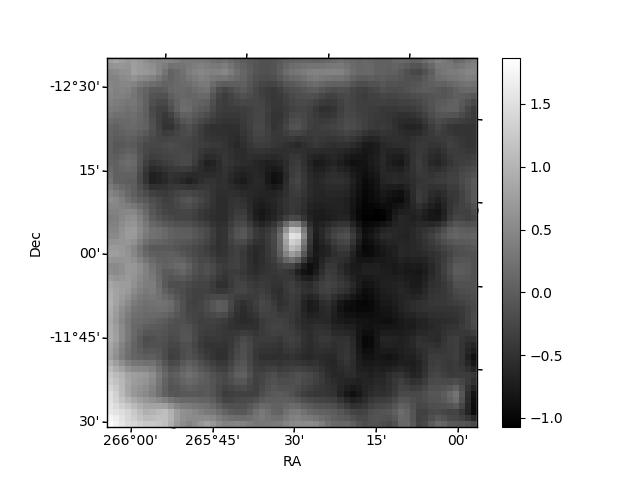
Quadrant B |
|---|---|---|---|
| Quadrant D | 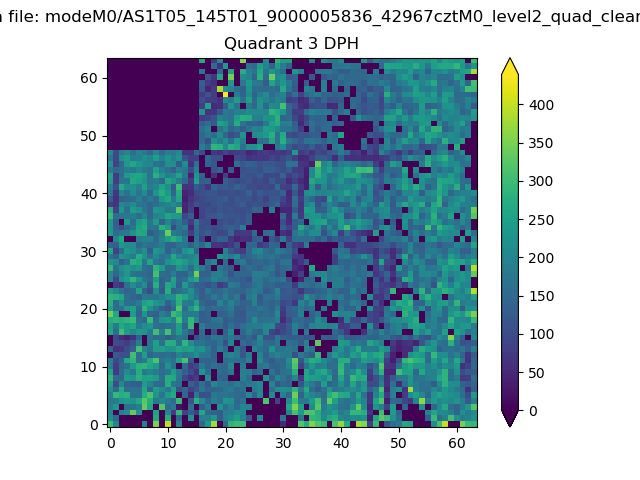 |
 |
Quadrant C |
| Plot type | Count rate plots | Images |
|---|---|---|
| Comparison with Poisson distribution Blue bars denote a histogram of data divided into 1 sec bins. Red curve is a Poisson curve with rate = median count rate of data. |
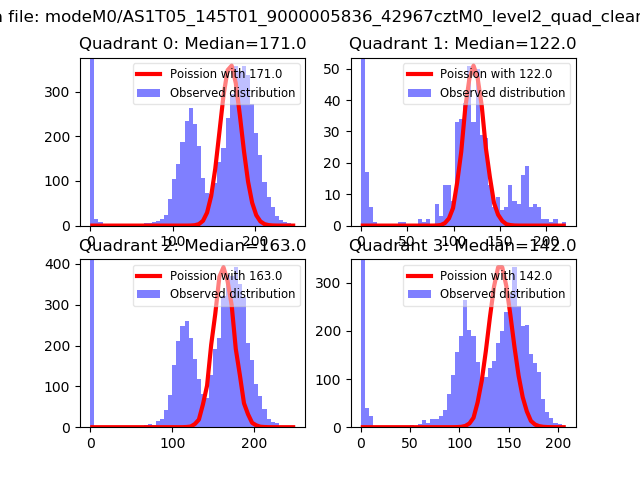 |
 |
| Quadrant-wise count rates Data is divided into 100 sec bins |
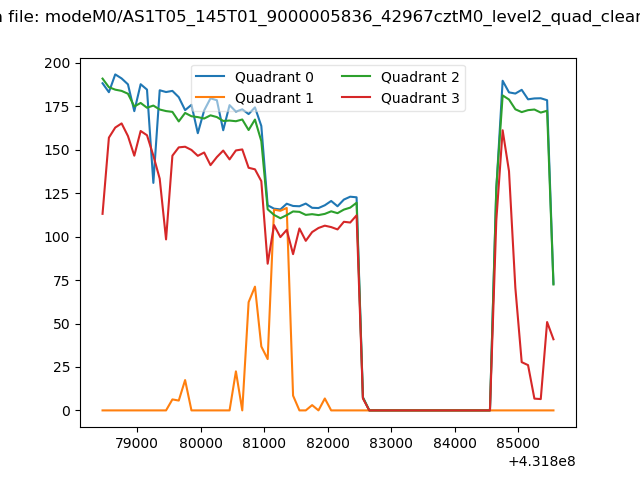 |
|
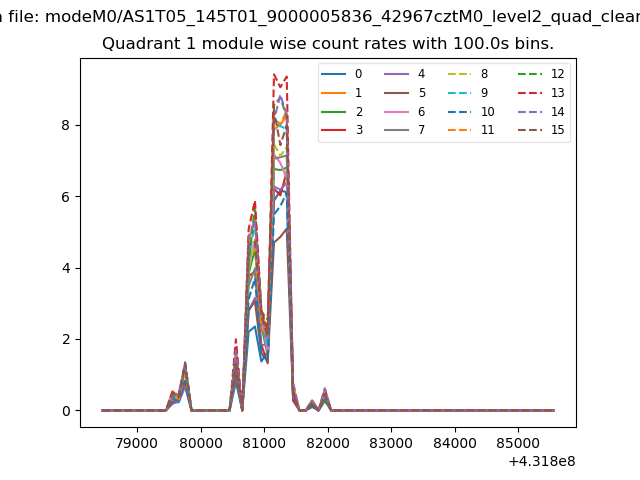
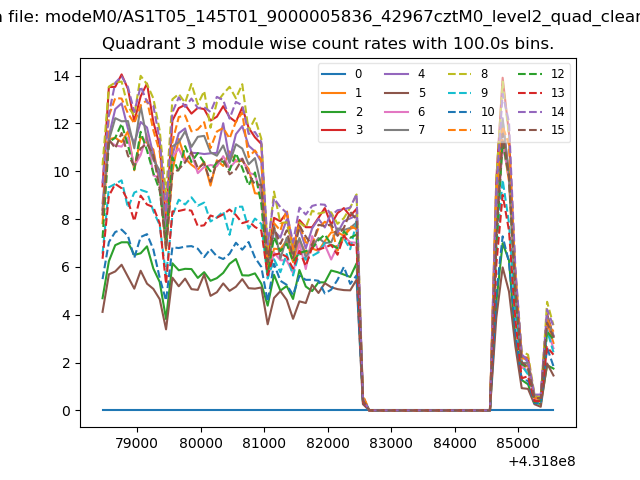
| Module-wise count rates for Quadrant A Data is divided into 100 sec bins |
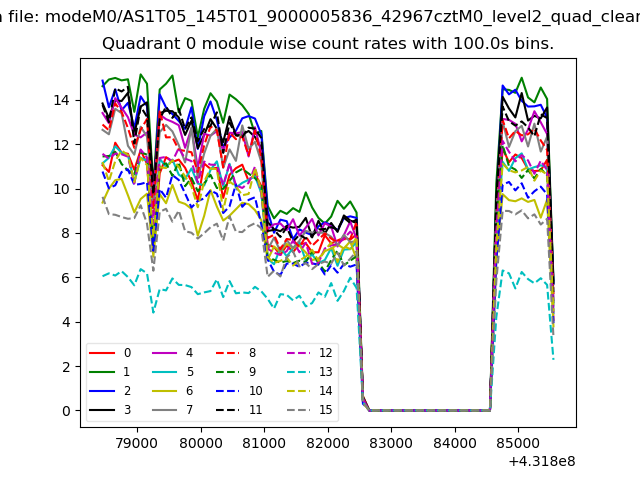 |
 |
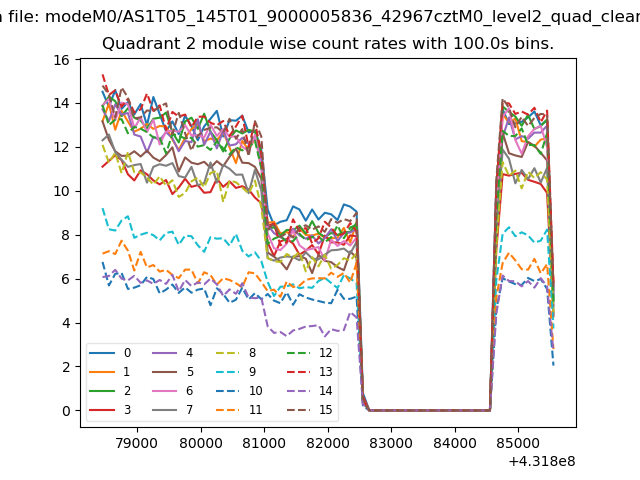
| Module-wise count rates for Quadrant B Data is divided into 100 sec bins |
 |
 |
| Module-wise count rates for Quadrant C Data is divided into 100 sec bins |
 |
 |
| Module-wise count rates for Quadrant D Data is divided into 100 sec bins |
 |
 |
| Parameter | Plot |
|---|---|
| CZT HV Monitor | 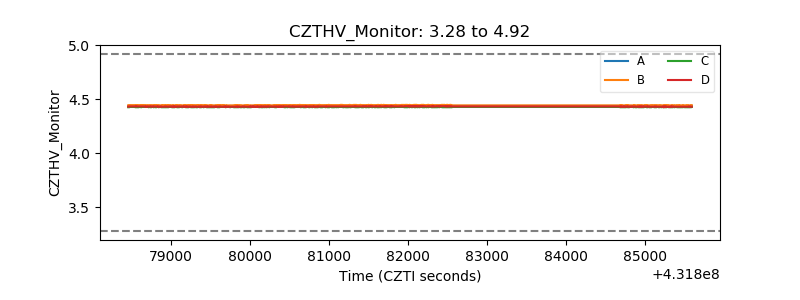 |
| D_VDD | 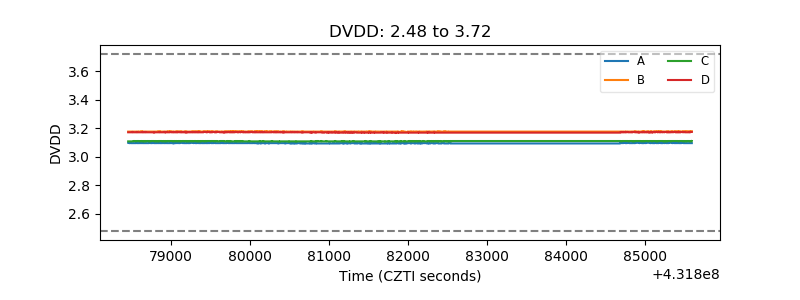 |
| Temperature 1 | 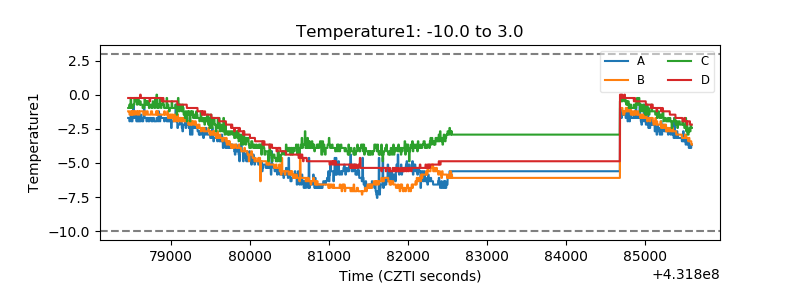 |
| Veto HV Monitor | 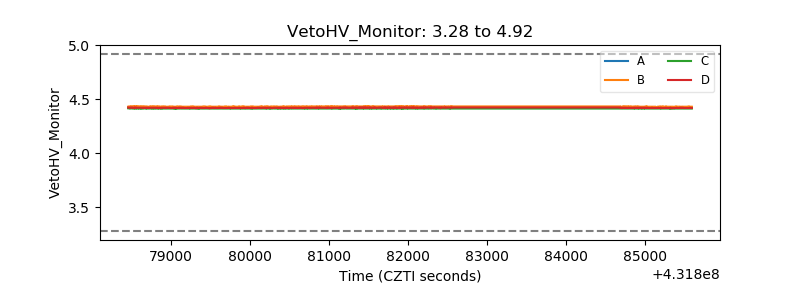 |
| Veto LLD | 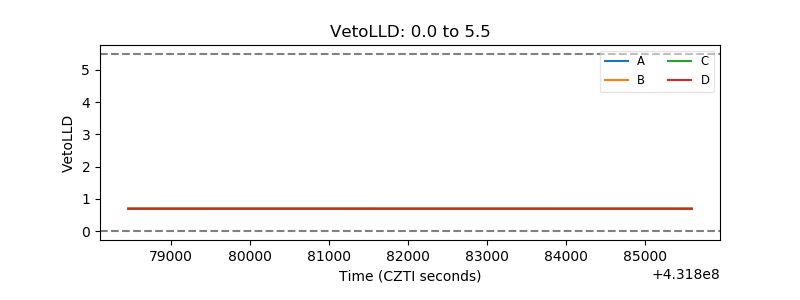 |
| Alpha Counter | 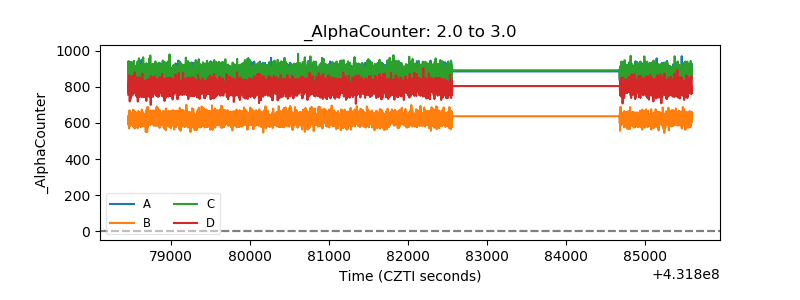 |
| _CPM_Rate | 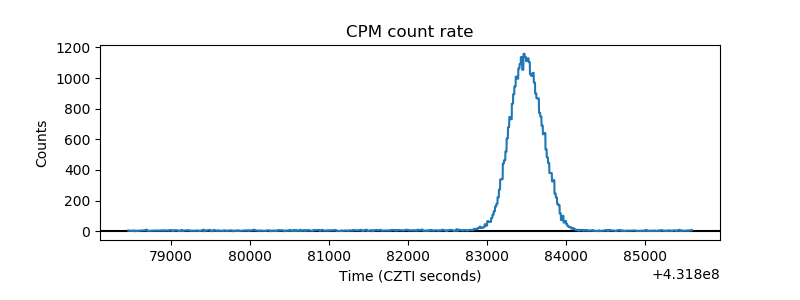 |
| CZT Counter | 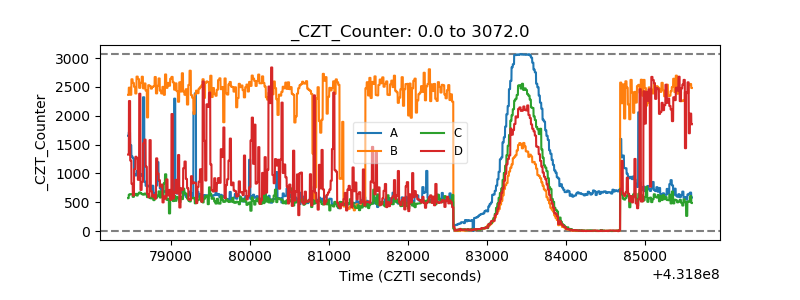 |
| +2.5 Volts monitor | 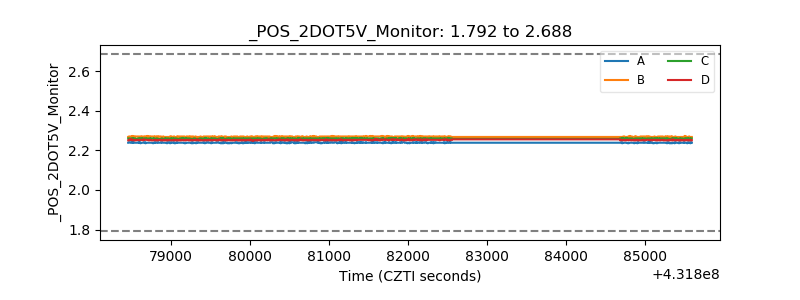 |
| +5 Volts monitor |  |
| _ROLL_ROT | 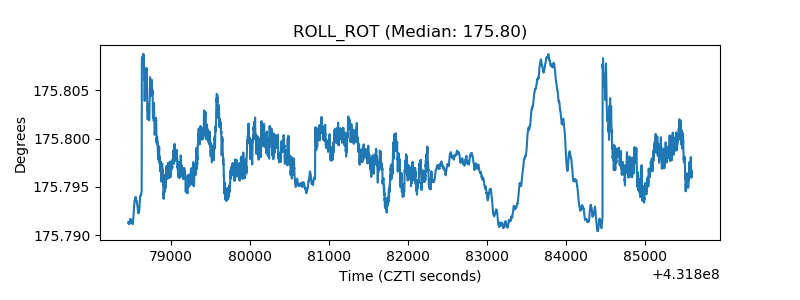 |
| _Roll_DEC | 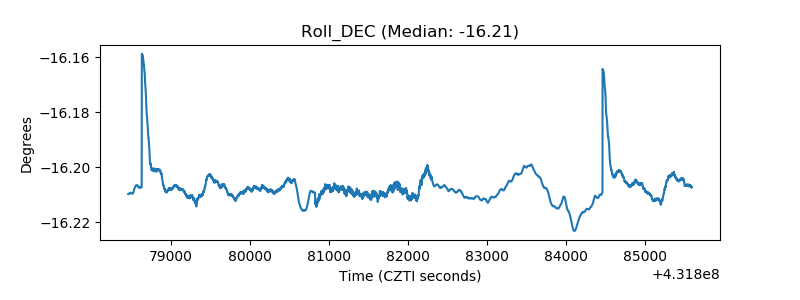 |
| _Roll_RA | 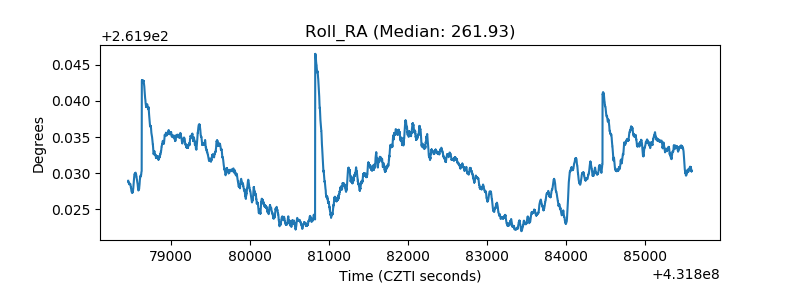 |
| Veto Counter | 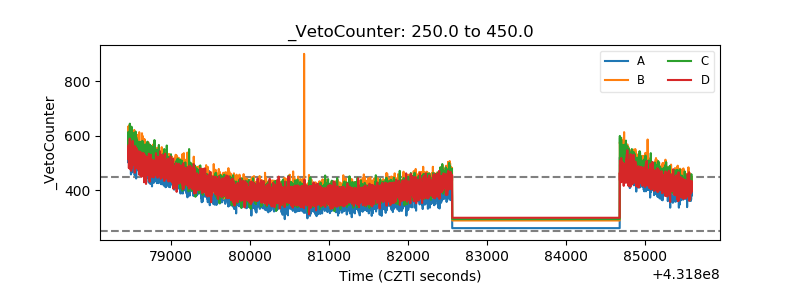 |