| Param | Original file | Final file |
|---|---|---|
| Filename | modeM0/AS1T05_145T01_9000005836_42968cztM0_level2.fits | modeM0/AS1T05_145T01_9000005836_42968cztM0_level2_quad_clean.evt |
| Size (bytes) | 634,772,160 | 76,602,240 |
| Size | 605.4 MB | 73.1 MB |
| Events in quadrant A | 5,332,243 | 632,620 |
| Events in quadrant B | 10,531,590 | 86,238 |
| Events in quadrant C | 2,552,974 | 714,253 |
| Events in quadrant D | 4,700,076 | 543,480 |
| Mode M0 | |||
|---|---|---|---|
| Quadrant | BADHDUFLAG | Total packets | Discarded packets |
| A | 0 | 19289 | 82 |
| B | 0 | 34895 | 332 |
| C | 0 | 10423 | 60 |
| D | 0 | 17564 | 277 |
| Mode M9 | |||
|---|---|---|---|
| Quadrant | BADHDUFLAG | Total packets | Discarded packets |
| A | 0 | 22 | 0 |
| B | 0 | 23 | 0 |
| C | 0 | 23 | 0 |
| D | 0 | 23 | 0 |
| Mode SS | |||
|---|---|---|---|
| Quadrant | BADHDUFLAG | Total packets | Discarded packets |
| A | 0 | 100 | 0 |
| B | 0 | 100 | 0 |
| C | 0 | 100 | 0 |
| D | 0 | 100 | 0 |
| Quadrant | Total seconds | Saturated seconds | Saturation percentage |
|---|---|---|---|
| A | 4892 | 989 | 20.216680% |
| B | 4883 | 4210 | 86.217489% |
| C | 4898 | 9 | 0.183748% |
| D | 4884 | 748 | 15.315315% |
Noise dominated data is calculated using 1-second bins in cleaned event files. If a bin has >2000 counts, and if more than 50% of those come from <1% of pixels, then it is considered to be noise-dominated and hence unusable.
| Quadrant | # 1 sec bins | Bins with >0 counts | Bins with >2000 counts | High rate bins dominated by noise | Noise dominated (total time) | Noise dominated (detector-on time) | Marked lightcurve |
|---|---|---|---|---|---|---|---|
| A | 7082 | 4903 | 888 | 888 | 12.54% | 18.11% | 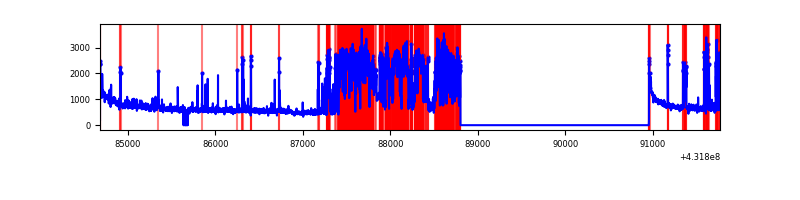 |
| B | 7081 | 4892 | 3986 | 3986 | 56.29% | 81.48% | 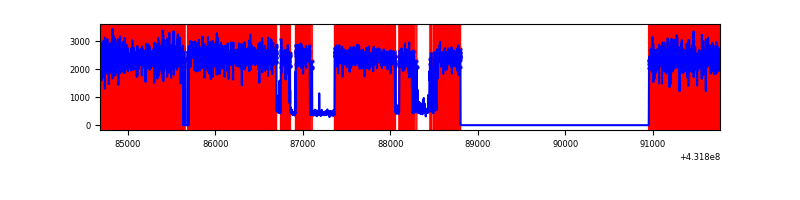 |
| C | 7081 | 4907 | 4 | 4 | 0.06% | 0.08% | 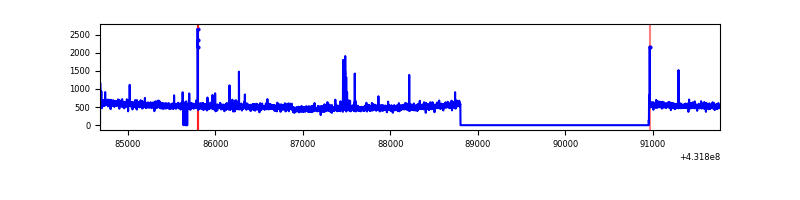 |
| D | 7081 | 4892 | 770 | 770 | 10.87% | 15.74% | 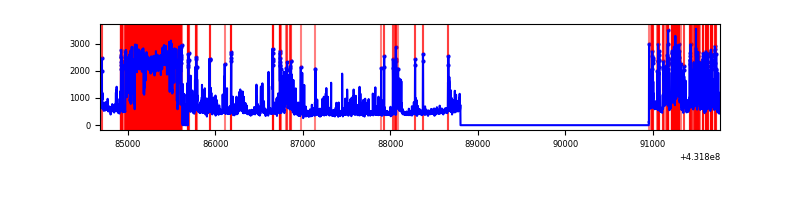 |
Top three noisy pixels from each quadrant. If the there are fewer than three noisy pixels in the level2.evt file, extra rows are filled as -1
| Pixel properties | Quadrant properties | ||||||
|---|---|---|---|---|---|---|---|
| Quadrant | DetID | PixID | Counts | Sigma | Mean | Median | Sigma |
| A | 15 | 237 | 2577529 | 20335.28 | 553 | 542 | 126.7 |
| A | 10 | 83 | 548522 | 4324.17 | 553 | 542 | 126.7 |
| A | 15 | 222 | 50618 | 395.16 | 553 | 542 | 126.7 |
| B | 4 | 81 | 9737223 | 265815.61 | 178 | 174 | 36.6 |
| B | 0 | 186 | 48574 | 1321.29 | 178 | 174 | 36.6 |
| B | 4 | 171 | 38599 | 1048.98 | 178 | 174 | 36.6 |
| C | 15 | 214 | 200016 | 1369.53 | 588 | 597 | 145.6 |
| C | 14 | 254 | 45685 | 309.65 | 588 | 597 | 145.6 |
| C | 12 | 2 | 7070 | 44.45 | 588 | 597 | 145.6 |
| D | 10 | 118 | 1559330 | 10968.24 | 537 | 522 | 142.1 |
| D | 1 | 47 | 304939 | 2141.97 | 537 | 522 | 142.1 |
| D | 12 | 16 | 233058 | 1636.19 | 537 | 522 | 142.1 |
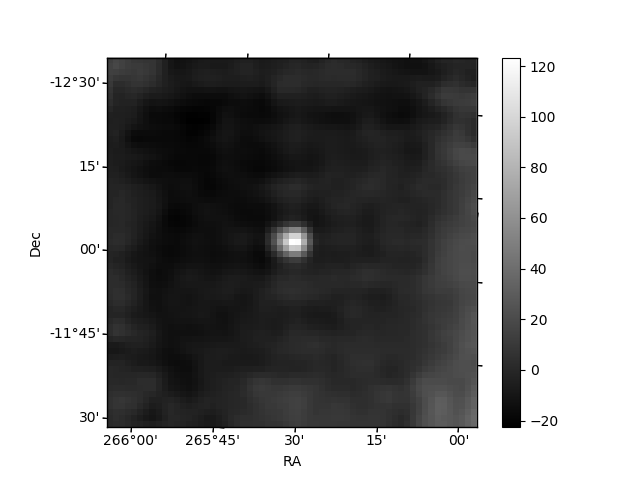
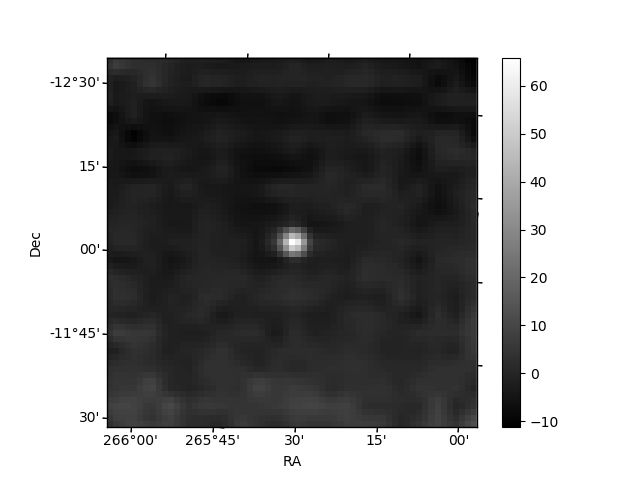
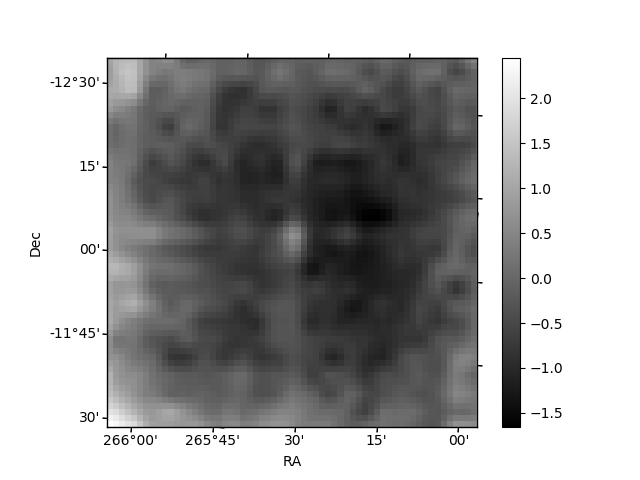
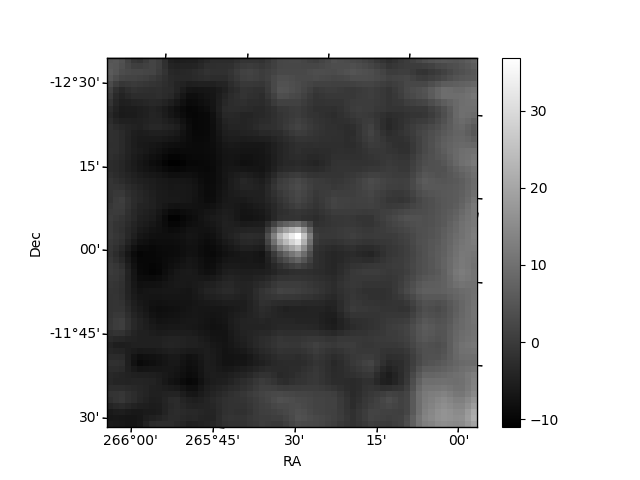
Histogram calculated using DETX and DETY for each event in the final _common_clean file
| Quadrant A | 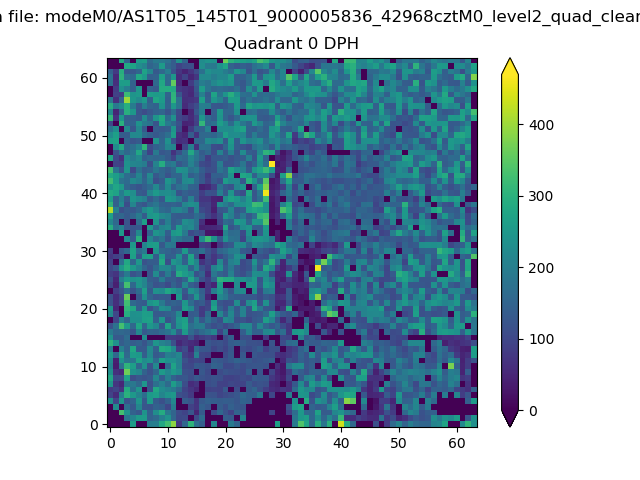 |
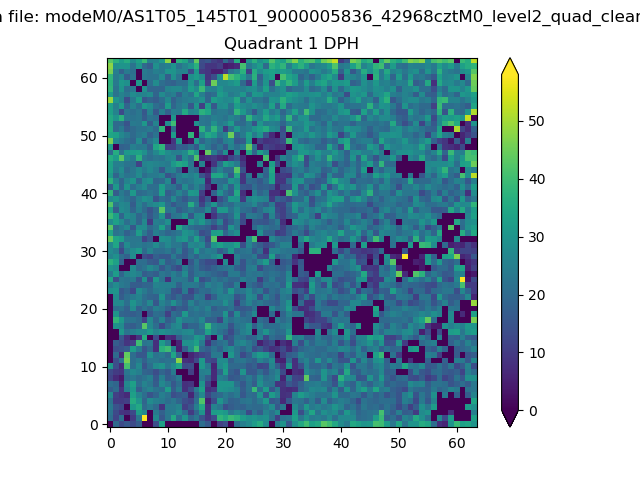 |
Quadrant B |
|---|---|---|---|
| Quadrant D |  |
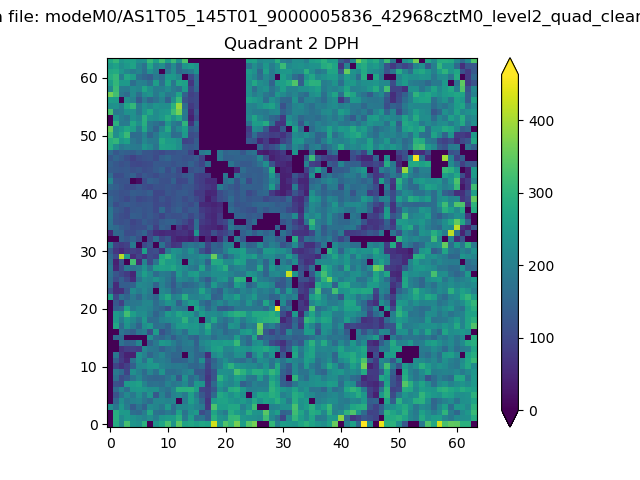 |
Quadrant C |
| Plot type | Count rate plots | Images |
|---|---|---|
| Comparison with Poisson distribution Blue bars denote a histogram of data divided into 1 sec bins. Red curve is a Poisson curve with rate = median count rate of data. |
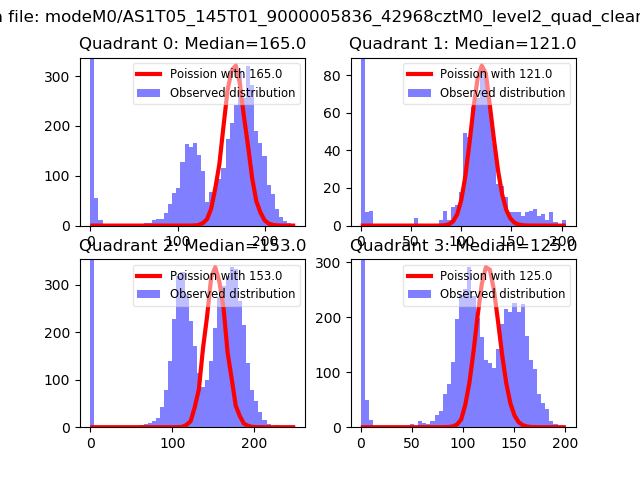 |
 |
| Quadrant-wise count rates Data is divided into 100 sec bins |
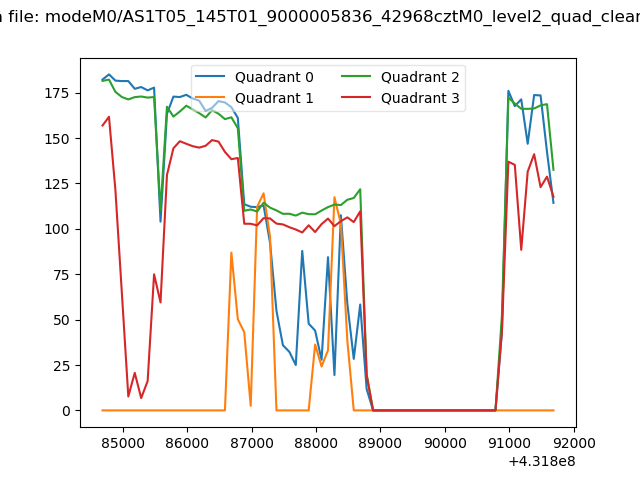 |
|
| Module-wise count rates for Quadrant A Data is divided into 100 sec bins |
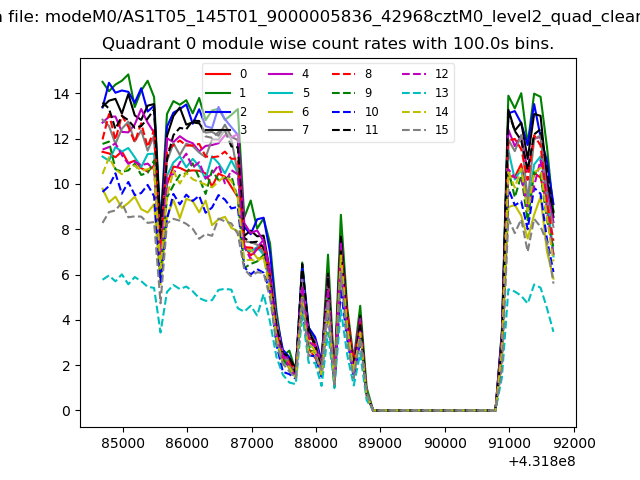 |
 |
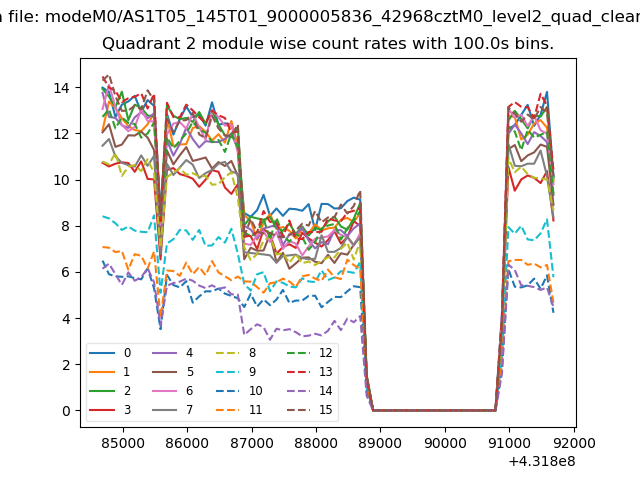
| Module-wise count rates for Quadrant B Data is divided into 100 sec bins |
 |
 |
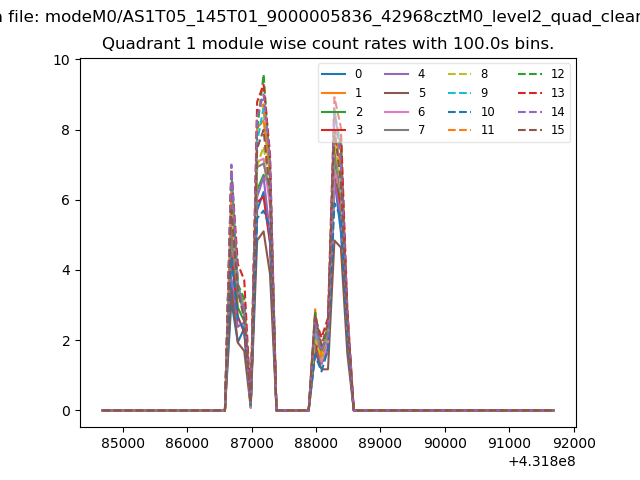
| Module-wise count rates for Quadrant C Data is divided into 100 sec bins |
 |
 |
| Module-wise count rates for Quadrant D Data is divided into 100 sec bins |
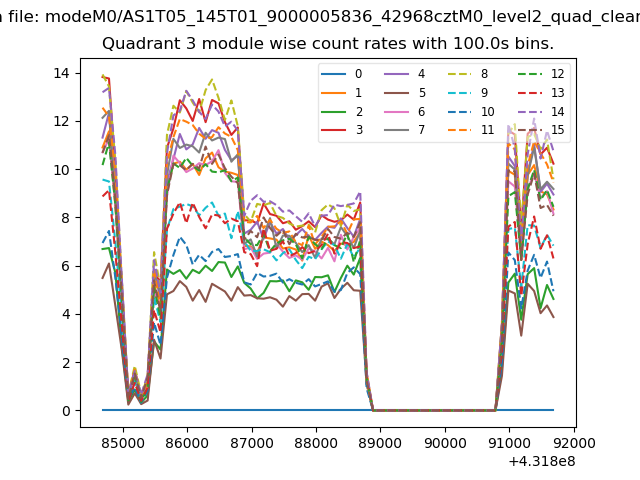 |
 |
| Parameter | Plot |
|---|---|
| CZT HV Monitor | 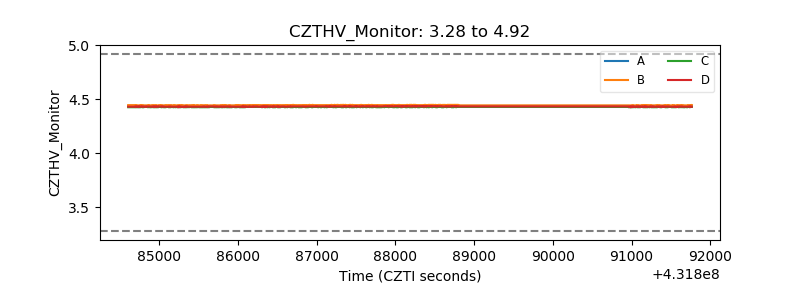 |
| D_VDD | 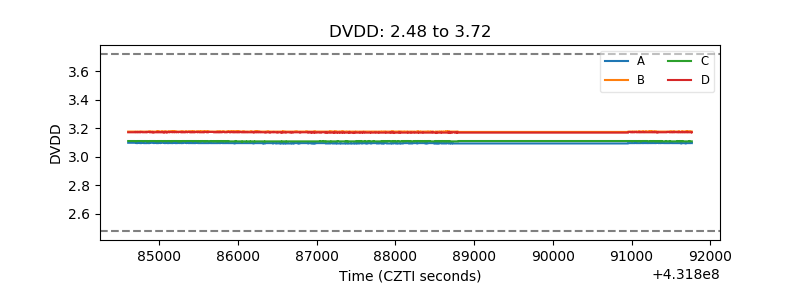 |
| Temperature 1 | 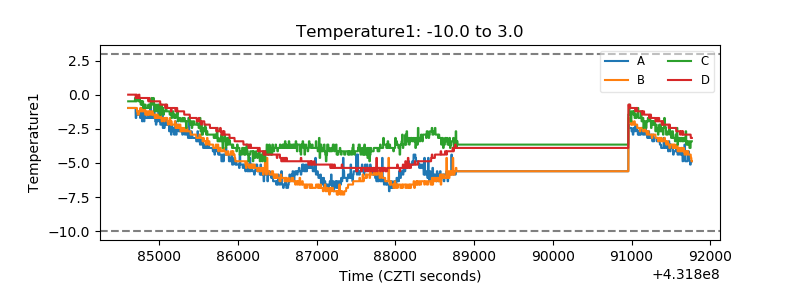 |
| Veto HV Monitor | 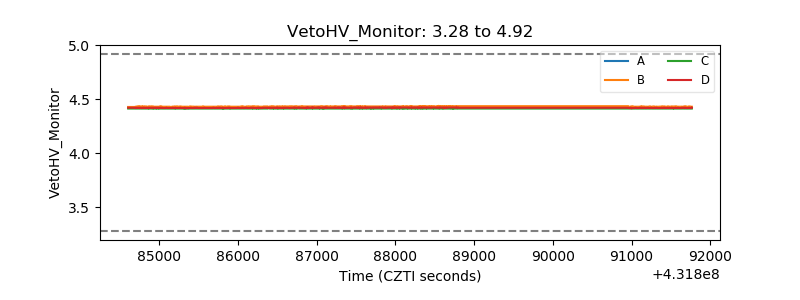 |
| Veto LLD | 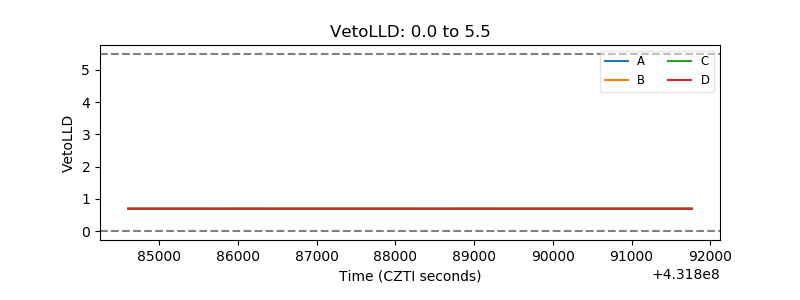 |
| Alpha Counter | 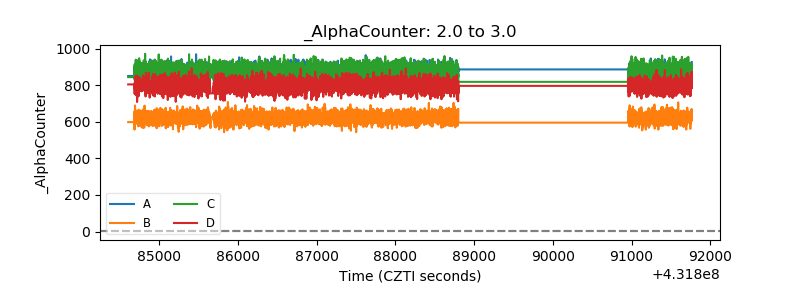 |
| _CPM_Rate | 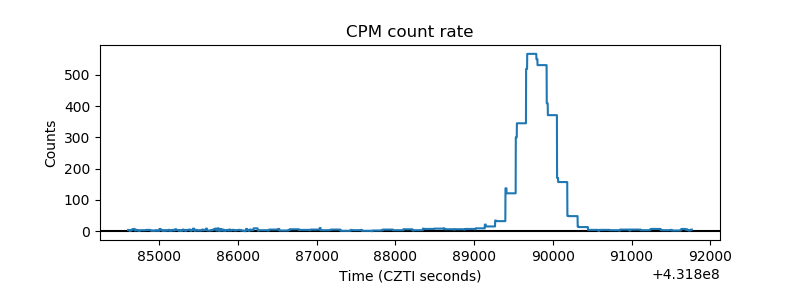 |
| CZT Counter | 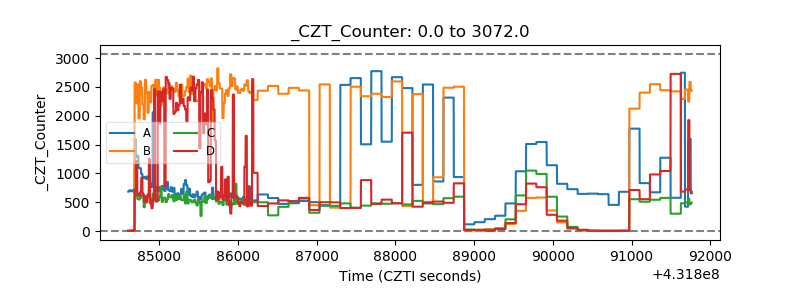 |
| +2.5 Volts monitor | 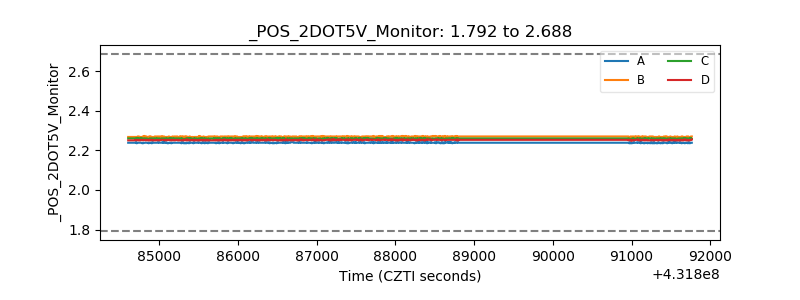 |
| +5 Volts monitor | 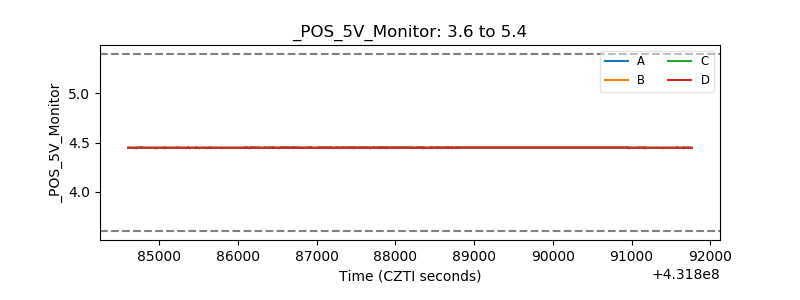 |
| _ROLL_ROT | 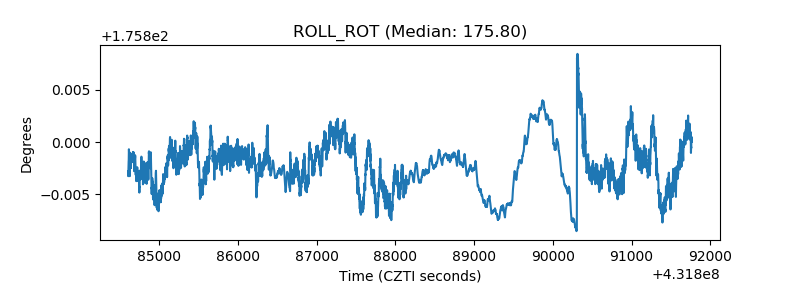 |
| _Roll_DEC | 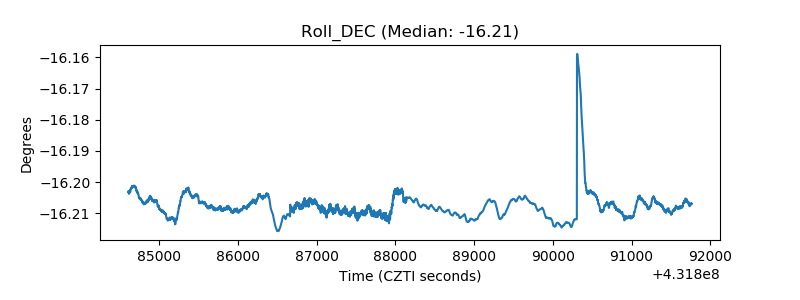 |
| _Roll_RA | 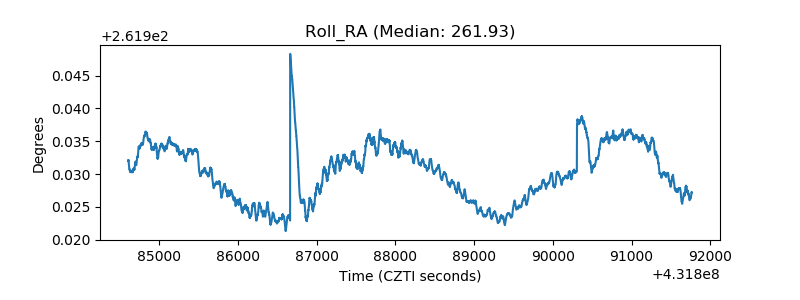 |
| Veto Counter | 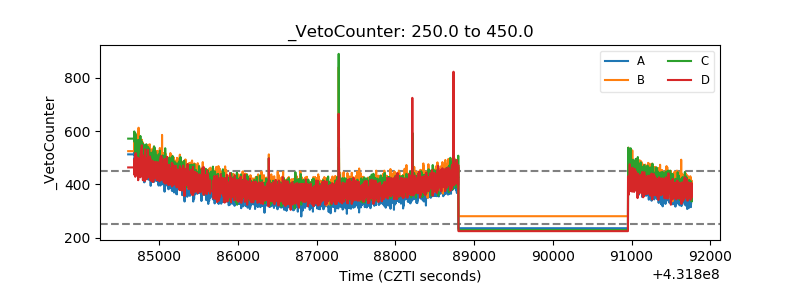 |