| Param | Original file | Final file |
|---|---|---|
| Filename | modeM0/AS1T05_145T01_9000005836_42970cztM0_level2.fits | modeM0/AS1T05_145T01_9000005836_42970cztM0_level2_quad_clean.evt |
| Size (bytes) | 626,483,520 | 80,406,720 |
| Size | 597.5 MB | 76.7 MB |
| Events in quadrant A | 3,292,276 | 739,879 |
| Events in quadrant B | 12,344,955 | 44,859 |
| Events in quadrant C | 2,635,472 | 719,544 |
| Events in quadrant D | 4,509,070 | 562,979 |
| Mode M0 | |||
|---|---|---|---|
| Quadrant | BADHDUFLAG | Total packets | Discarded packets |
| A | 0 | 13376 | 3 |
| B | 0 | 40093 | 2 |
| C | 0 | 11070 | 2 |
| D | 0 | 17053 | 2 |
| Mode M9 | |||
|---|---|---|---|
| Quadrant | BADHDUFLAG | Total packets | Discarded packets |
| A | 0 | 24 | 0 |
| B | 0 | 25 | 0 |
| C | 0 | 25 | 0 |
| D | 0 | 25 | 0 |
| Mode SS | |||
|---|---|---|---|
| Quadrant | BADHDUFLAG | Total packets | Discarded packets |
| A | 0 | 108 | 0 |
| B | 0 | 108 | 0 |
| C | 0 | 108 | 0 |
| D | 0 | 108 | 0 |
| Quadrant | Total seconds | Saturated seconds | Saturation percentage |
|---|---|---|---|
| A | 5247 | 76 | 1.448447% |
| B | 5247 | 4895 | 93.291405% |
| C | 5247 | 4 | 0.076234% |
| D | 5247 | 681 | 12.978845% |
Noise dominated data is calculated using 1-second bins in cleaned event files. If a bin has >2000 counts, and if more than 50% of those come from <1% of pixels, then it is considered to be noise-dominated and hence unusable.
| Quadrant | # 1 sec bins | Bins with >0 counts | Bins with >2000 counts | High rate bins dominated by noise | Noise dominated (total time) | Noise dominated (detector-on time) | Marked lightcurve |
|---|---|---|---|---|---|---|---|
| A | 7039 | 5248 | 56 | 56 | 0.80% | 1.07% | 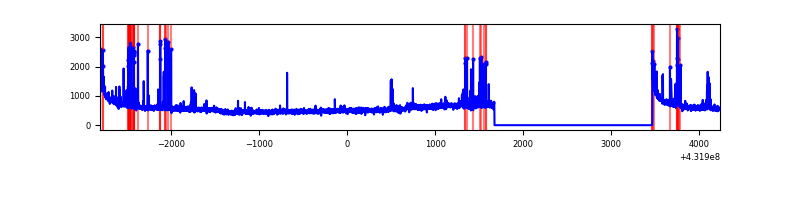 |
| B | 7039 | 5248 | 4717 | 4717 | 67.01% | 89.88% | 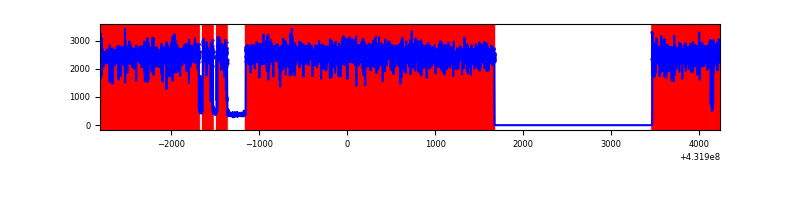 |
| C | 7039 | 5248 | 0 | 0 | 0.00% | 0.00% | 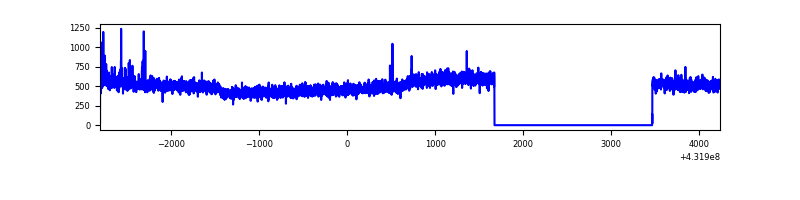 |
| D | 7039 | 5248 | 664 | 664 | 9.43% | 12.65% | 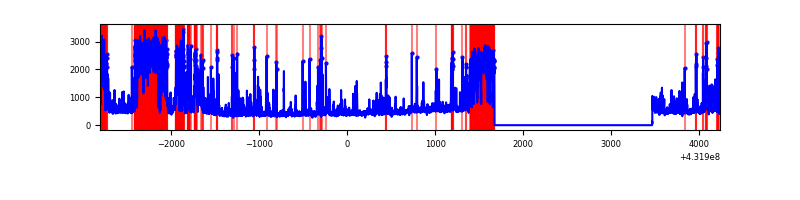 |
Top three noisy pixels from each quadrant. If the there are fewer than three noisy pixels in the level2.evt file, extra rows are filled as -1
| Pixel properties | Quadrant properties | ||||||
|---|---|---|---|---|---|---|---|
| Quadrant | DetID | PixID | Counts | Sigma | Mean | Median | Sigma |
| A | 10 | 83 | 563478 | 3925.83 | 628 | 616 | 143.4 |
| A | 15 | 237 | 242042 | 1683.89 | 628 | 616 | 143.4 |
| A | 15 | 222 | 28373 | 193.6 | 628 | 616 | 143.4 |
| B | 4 | 81 | 11724724 | 404106.08 | 136 | 133 | 29.0 |
| B | 4 | 171 | 62110 | 2136.13 | 136 | 133 | 29.0 |
| B | 5 | 255 | 10260 | 349.04 | 136 | 133 | 29.0 |
| C | 15 | 214 | 214048 | 1394.38 | 616 | 623 | 153.1 |
| C | 14 | 254 | 20105 | 127.28 | 616 | 623 | 153.1 |
| C | 13 | 61 | 4274 | 23.85 | 616 | 623 | 153.1 |
| D | 1 | 47 | 1098796 | 7322.71 | 568 | 553 | 150.0 |
| D | 12 | 2 | 500211 | 3331.55 | 568 | 553 | 150.0 |
| D | 2 | 249 | 133797 | 888.43 | 568 | 553 | 150.0 |
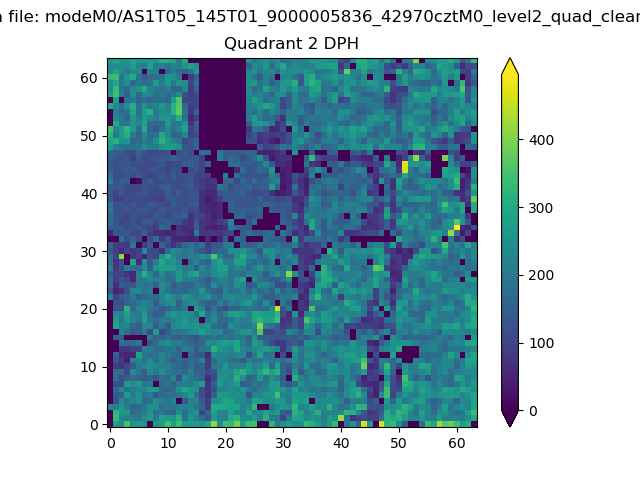
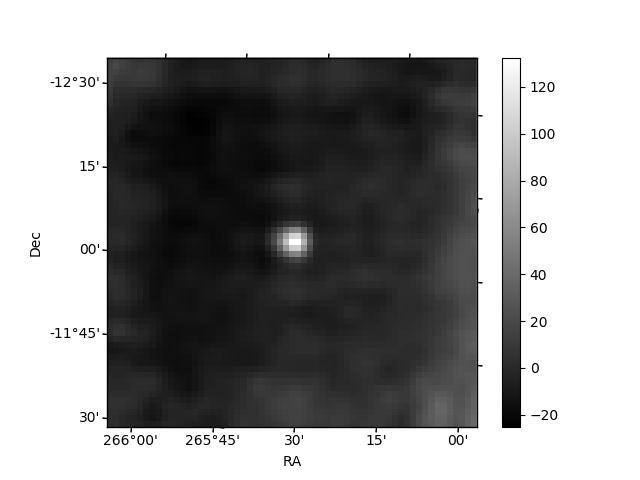
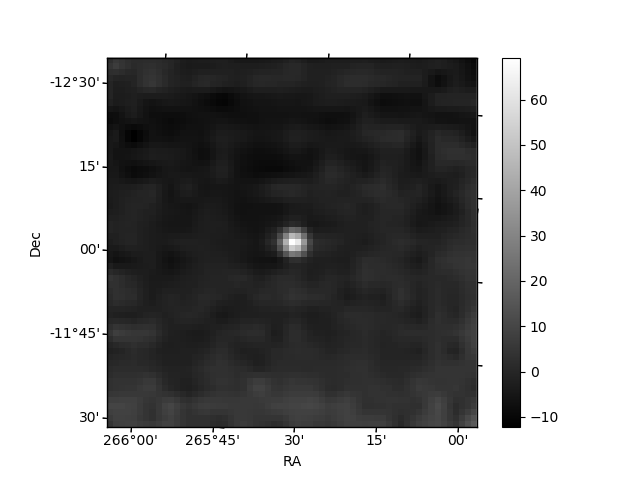
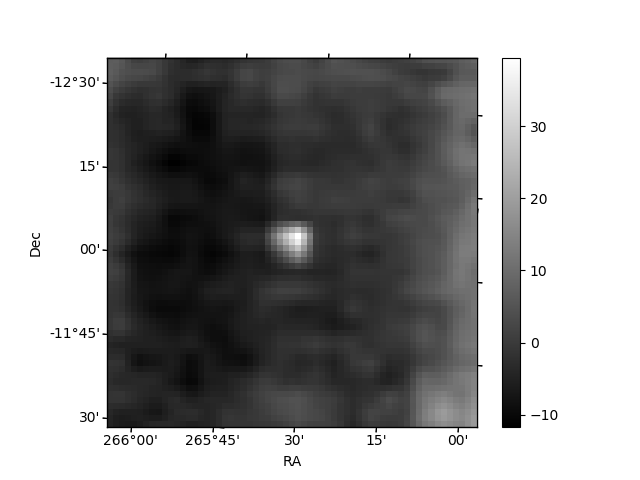
Histogram calculated using DETX and DETY for each event in the final _common_clean file
| Quadrant A | 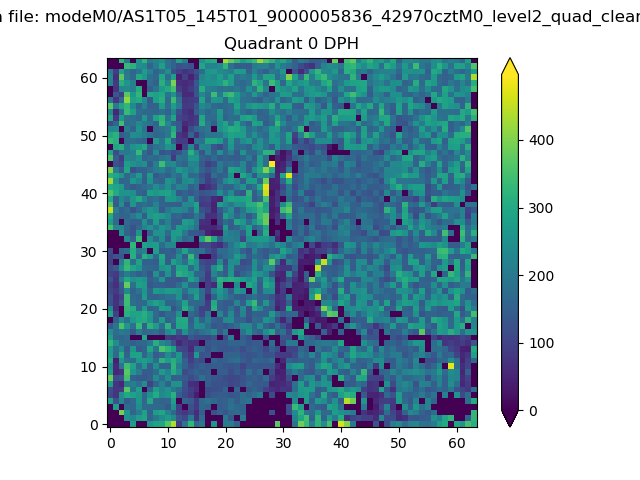 |
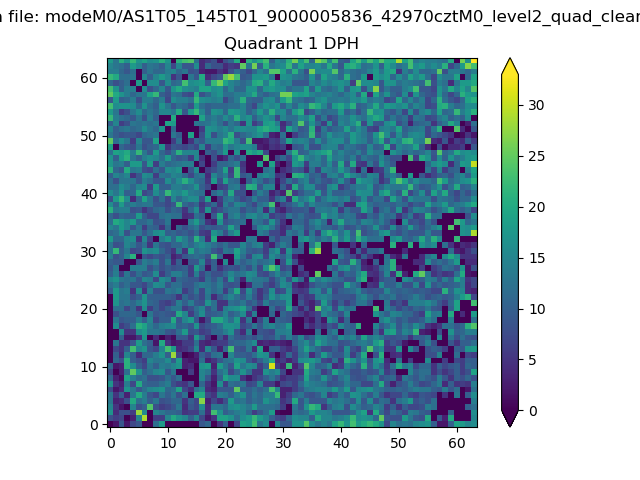 |
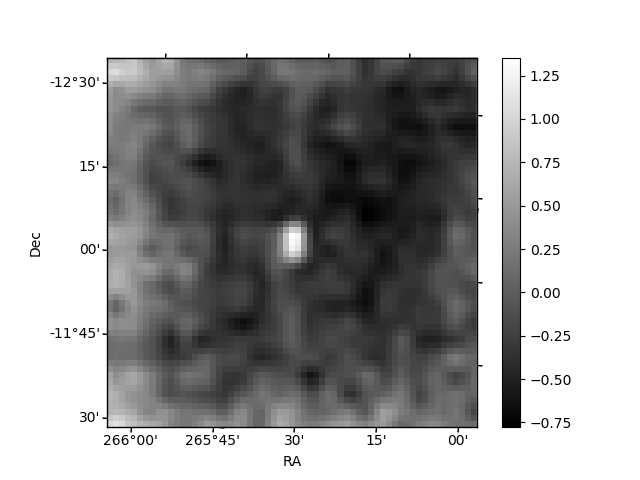
Quadrant B |
|---|---|---|---|
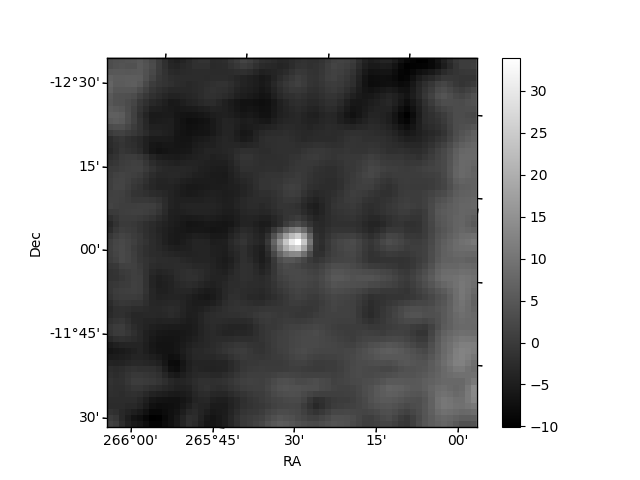
| Quadrant D | 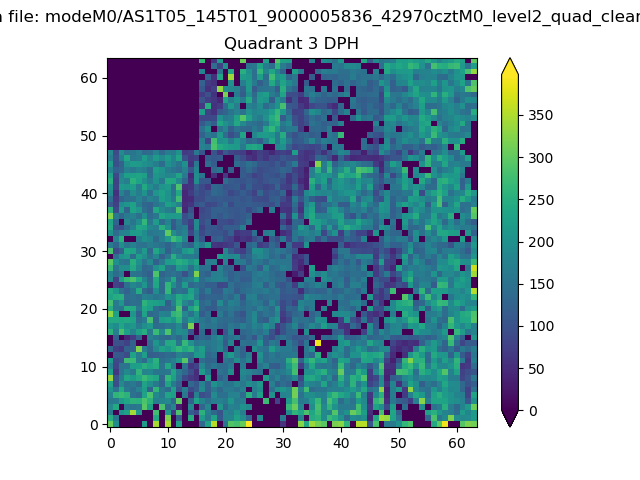 |
 |
Quadrant C |
| Plot type | Count rate plots | Images |
|---|---|---|
| Comparison with Poisson distribution Blue bars denote a histogram of data divided into 1 sec bins. Red curve is a Poisson curve with rate = median count rate of data. |
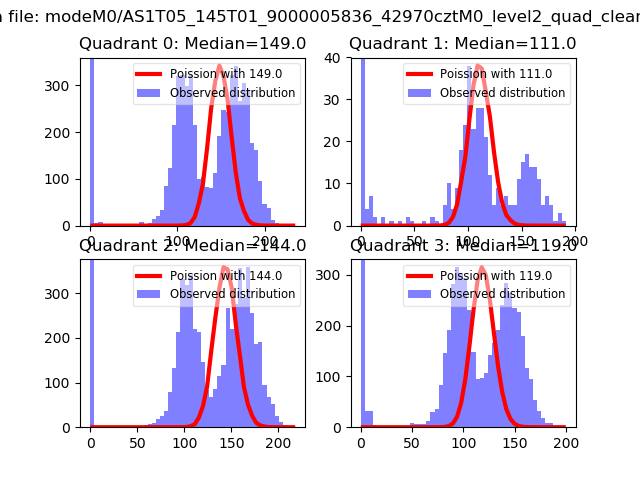 |
 |
| Quadrant-wise count rates Data is divided into 100 sec bins |
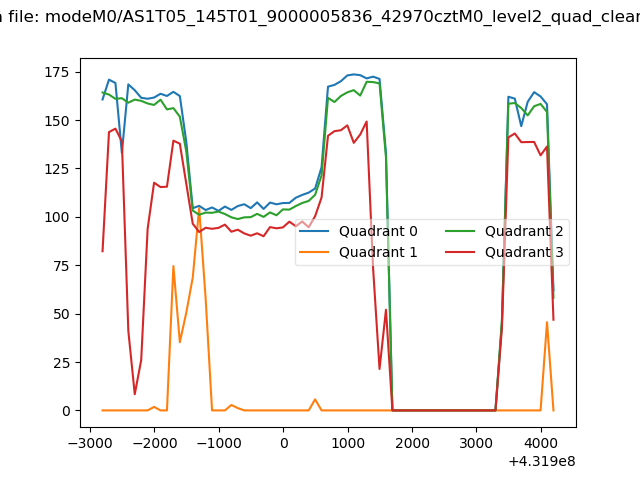 |
|
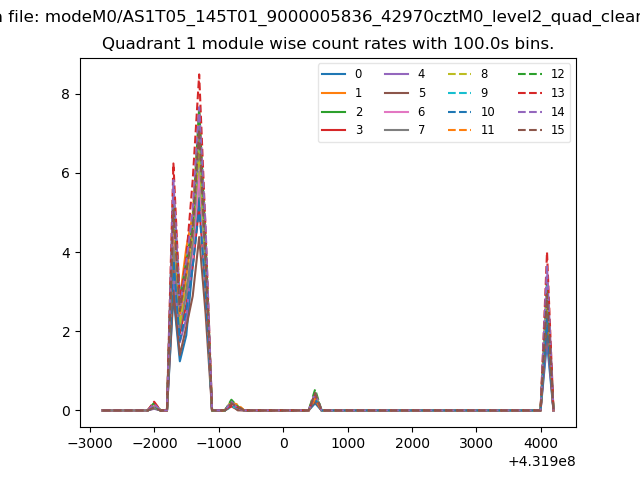
| Module-wise count rates for Quadrant A Data is divided into 100 sec bins |
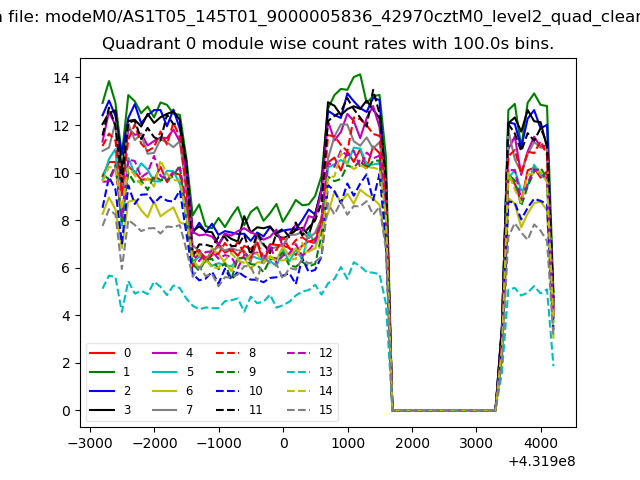 |
 |
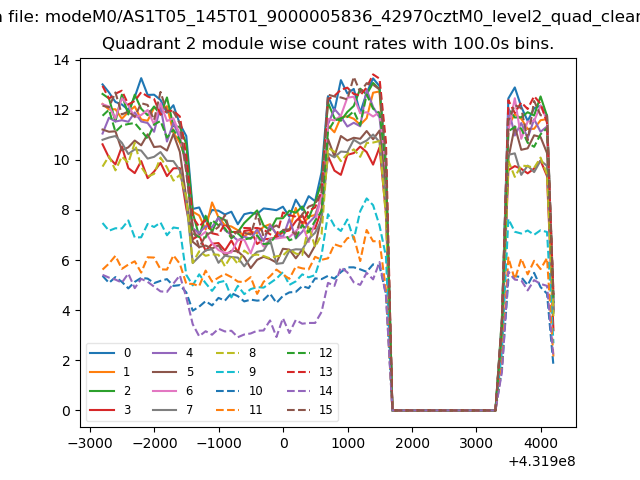
| Module-wise count rates for Quadrant B Data is divided into 100 sec bins |
 |
 |
| Module-wise count rates for Quadrant C Data is divided into 100 sec bins |
 |
 |
| Module-wise count rates for Quadrant D Data is divided into 100 sec bins |
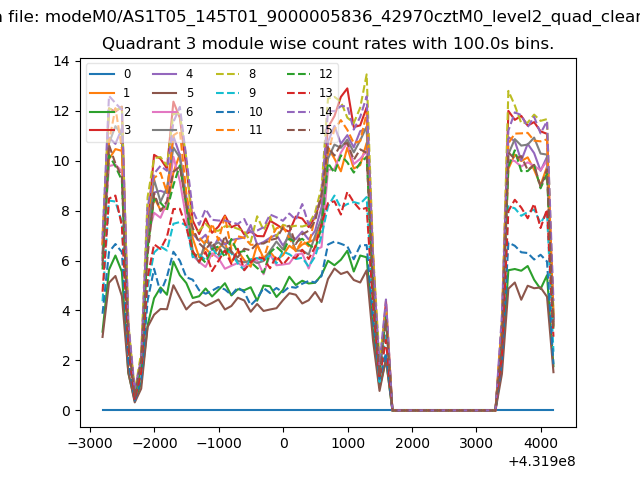 |
 |
| Parameter | Plot |
|---|---|
| CZT HV Monitor | 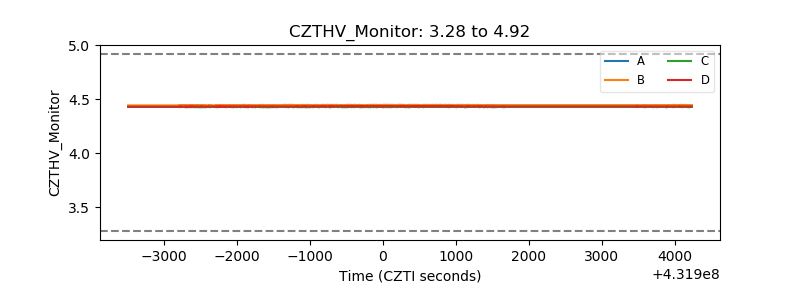 |
| D_VDD | 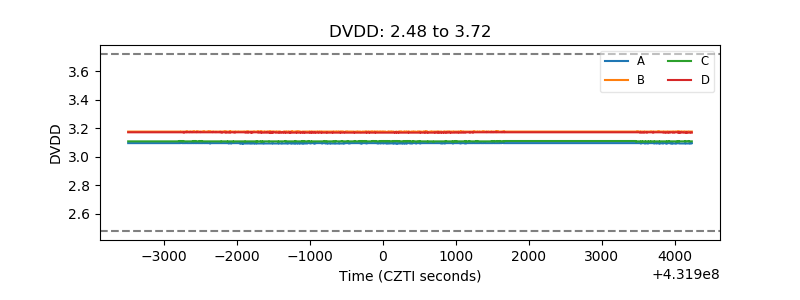 |
| Temperature 1 | 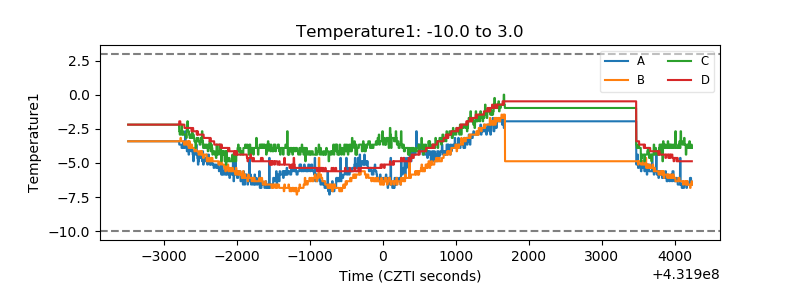 |
| Veto HV Monitor | 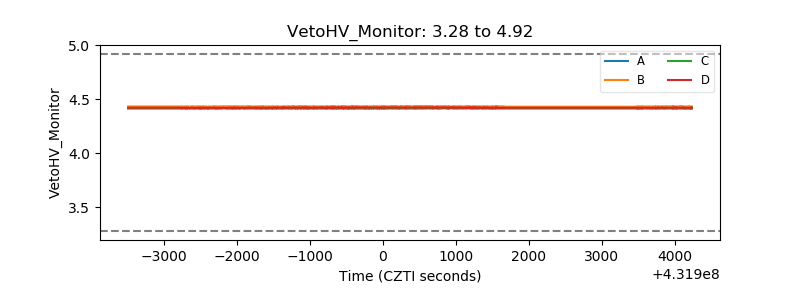 |
| Veto LLD | 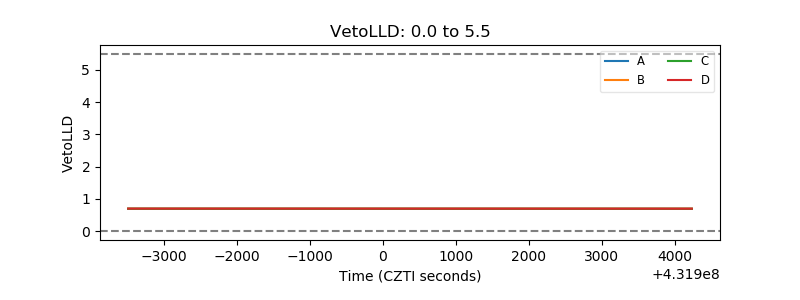 |
| Alpha Counter | 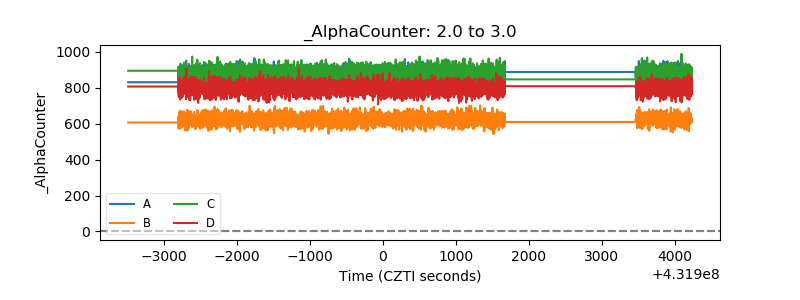 |
| _CPM_Rate | 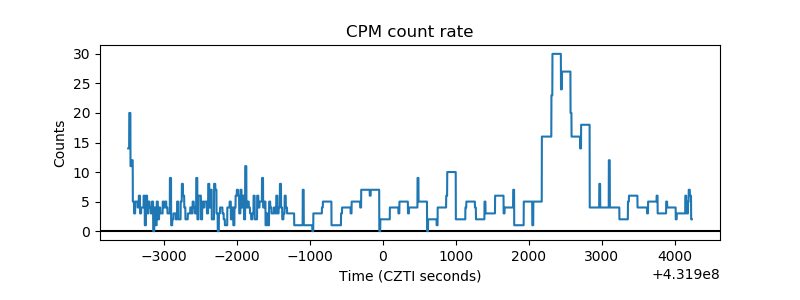 |
| CZT Counter | 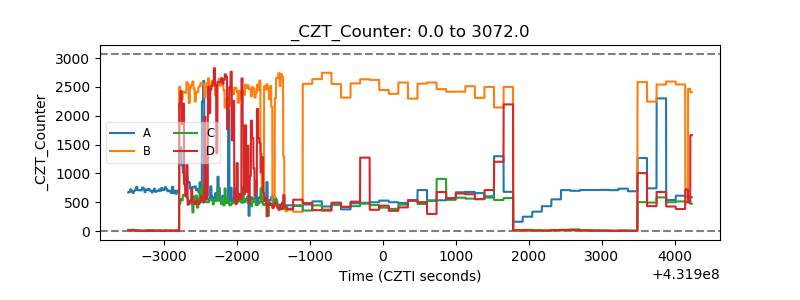 |
| +2.5 Volts monitor | 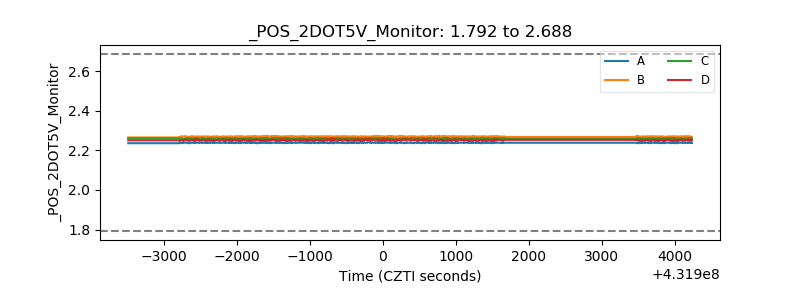 |
| +5 Volts monitor |  |
| _ROLL_ROT | 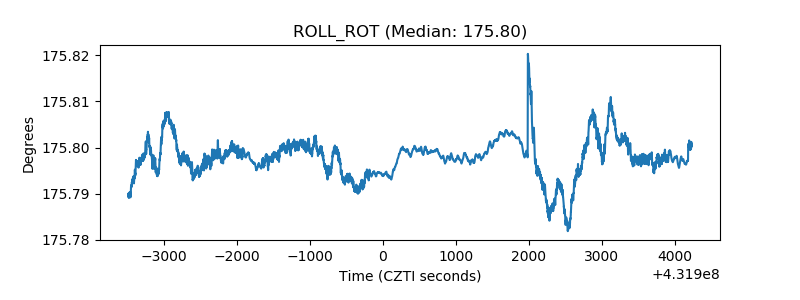 |
| _Roll_DEC | 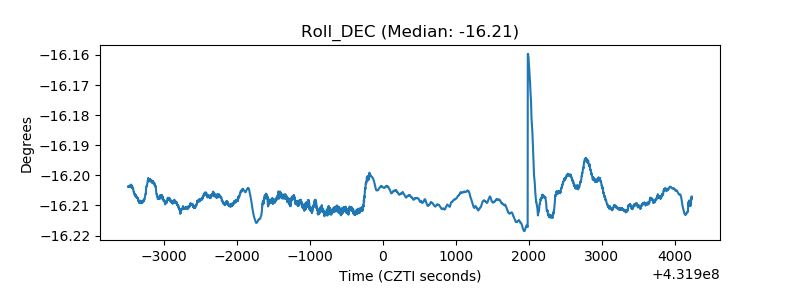 |
| _Roll_RA | 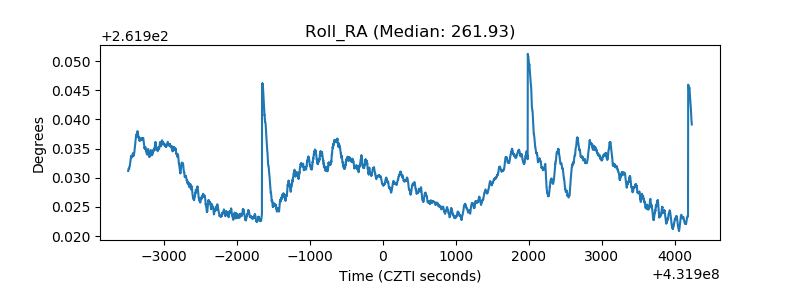 |
| Veto Counter | 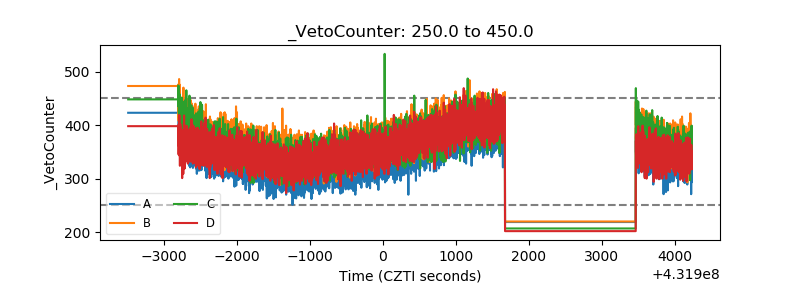 |