| Param | Original file | Final file |
|---|---|---|
| Filename | modeM0/AS1T05_145T01_9000005836_42971cztM0_level2.fits | modeM0/AS1T05_145T01_9000005836_42971cztM0_level2_quad_clean.evt |
| Size (bytes) | 614,396,160 | 89,138,880 |
| Size | 585.9 MB | 85.0 MB |
| Events in quadrant A | 3,405,296 | 781,960 |
| Events in quadrant B | 12,300,910 | 100,022 |
| Events in quadrant C | 2,817,406 | 758,244 |
| Events in quadrant D | 3,779,327 | 664,182 |
| Mode M0 | |||
|---|---|---|---|
| Quadrant | BADHDUFLAG | Total packets | Discarded packets |
| A | 0 | 14173 | 2 |
| B | 0 | 40406 | 2 |
| C | 0 | 11802 | 2 |
| D | 0 | 15235 | 2 |
| Mode M9 | |||
|---|---|---|---|
| Quadrant | BADHDUFLAG | Total packets | Discarded packets |
| A | 0 | 25 | 0 |
| B | 0 | 26 | 0 |
| C | 0 | 26 | 0 |
| D | 0 | 26 | 0 |
| Mode SS | |||
|---|---|---|---|
| Quadrant | BADHDUFLAG | Total packets | Discarded packets |
| A | 0 | 114 | 0 |
| B | 0 | 114 | 0 |
| C | 0 | 114 | 0 |
| D | 0 | 114 | 0 |
| Quadrant | Total seconds | Saturated seconds | Saturation percentage |
|---|---|---|---|
| A | 5649 | 46 | 0.814303% |
| B | 5649 | 4846 | 85.785095% |
| C | 5649 | 6 | 0.106213% |
| D | 5649 | 235 | 4.160028% |
Noise dominated data is calculated using 1-second bins in cleaned event files. If a bin has >2000 counts, and if more than 50% of those come from <1% of pixels, then it is considered to be noise-dominated and hence unusable.
| Quadrant | # 1 sec bins | Bins with >0 counts | Bins with >2000 counts | High rate bins dominated by noise | Noise dominated (total time) | Noise dominated (detector-on time) | Marked lightcurve |
|---|---|---|---|---|---|---|---|
| A | 7111 | 5650 | 20 | 20 | 0.28% | 0.35% | 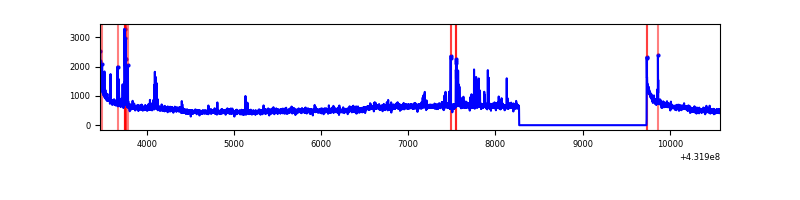 |
| B | 7111 | 5650 | 4620 | 4620 | 64.97% | 81.77% | 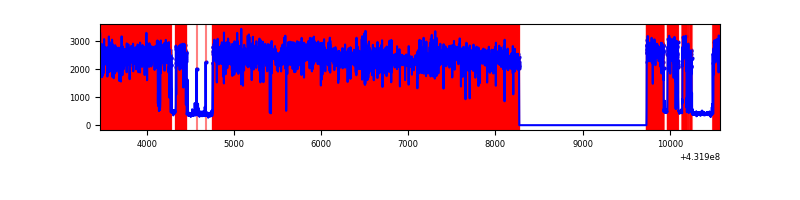 |
| C | 7111 | 5650 | 2 | 2 | 0.03% | 0.04% | 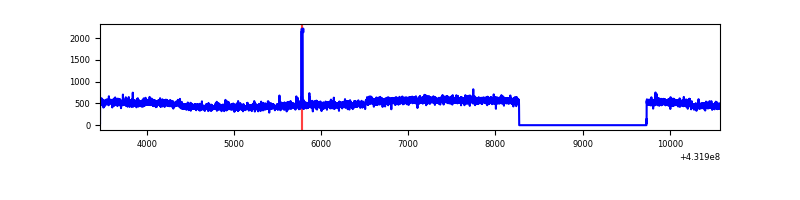 |
| D | 7111 | 5650 | 208 | 208 | 2.93% | 3.68% | 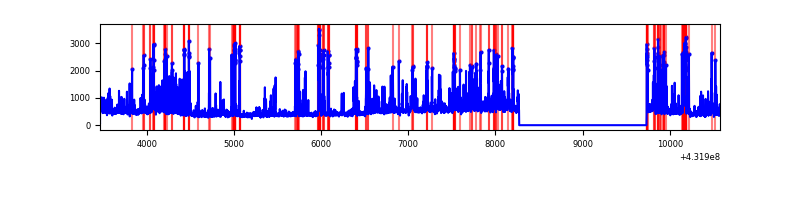 |
Top three noisy pixels from each quadrant. If the there are fewer than three noisy pixels in the level2.evt file, extra rows are filled as -1
| Pixel properties | Quadrant properties | ||||||
|---|---|---|---|---|---|---|---|
| Quadrant | DetID | PixID | Counts | Sigma | Mean | Median | Sigma |
| A | 10 | 83 | 593581 | 3893.83 | 676 | 664 | 152.3 |
| A | 15 | 237 | 120073 | 784.19 | 676 | 664 | 152.3 |
| A | 13 | 6 | 34519 | 222.33 | 676 | 664 | 152.3 |
| B | 4 | 81 | 11538445 | 300989.38 | 181 | 177 | 38.3 |
| B | 4 | 171 | 26131 | 677.04 | 181 | 177 | 38.3 |
| B | 0 | 186 | 9586 | 245.44 | 181 | 177 | 38.3 |
| C | 15 | 214 | 228210 | 1396.47 | 660 | 669 | 162.9 |
| C | 14 | 254 | 13424 | 78.28 | 660 | 669 | 162.9 |
| C | 13 | 61 | 4496 | 23.49 | 660 | 669 | 162.9 |
| D | 1 | 47 | 386023 | 2262.36 | 642 | 625 | 170.4 |
| D | 1 | 52 | 205150 | 1200.6 | 642 | 625 | 170.4 |
| D | 13 | 249 | 194429 | 1137.67 | 642 | 625 | 170.4 |
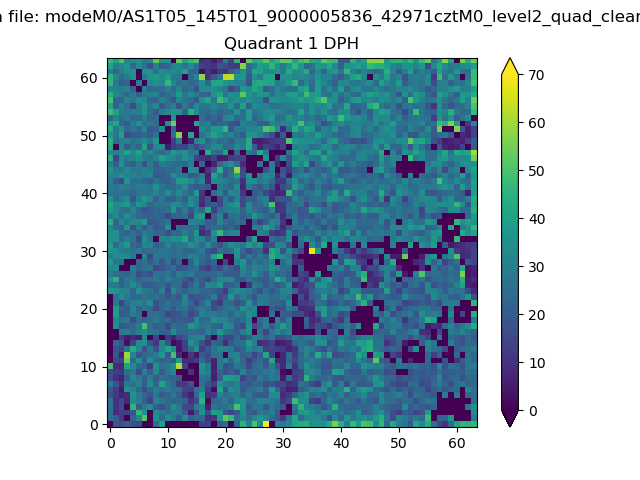
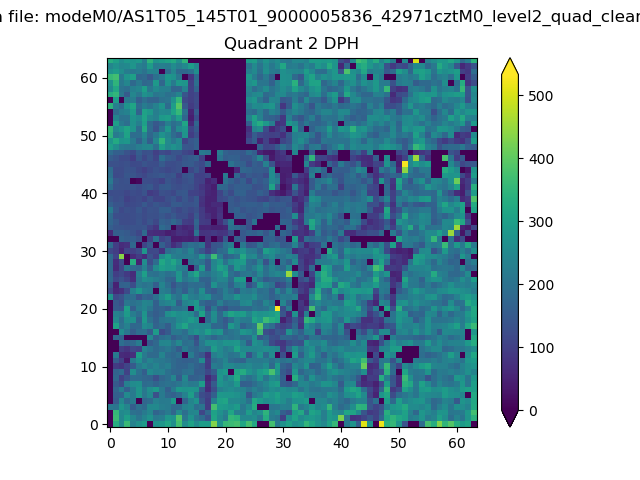
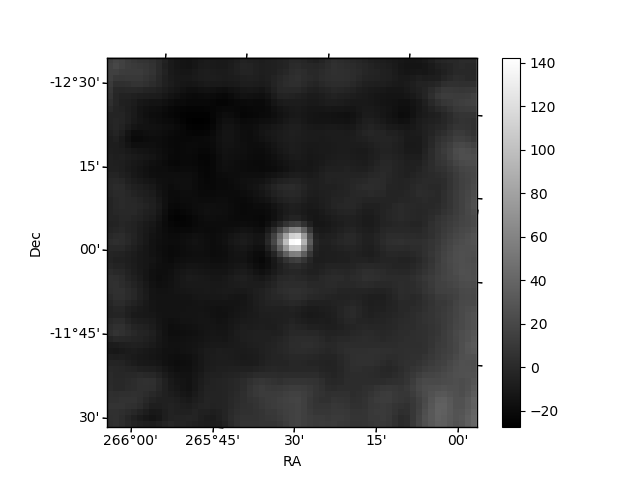
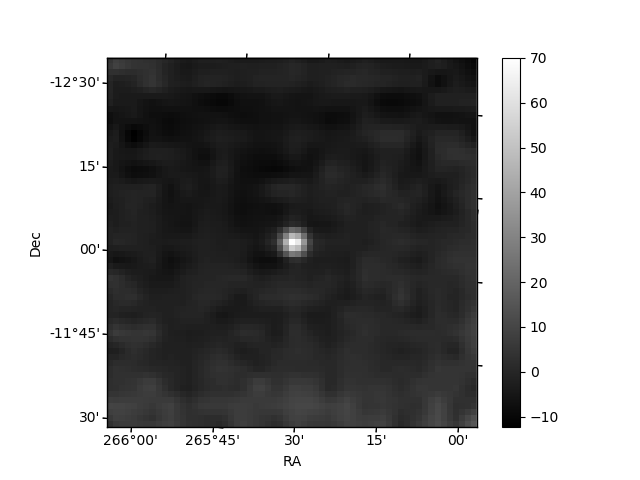
Histogram calculated using DETX and DETY for each event in the final _common_clean file
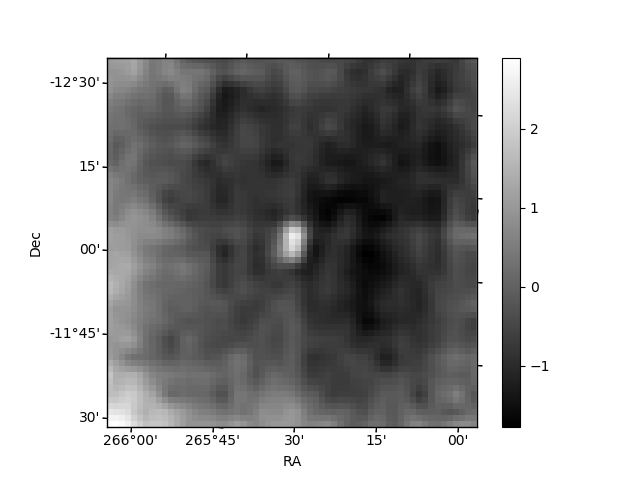
| Quadrant A |  |
 |
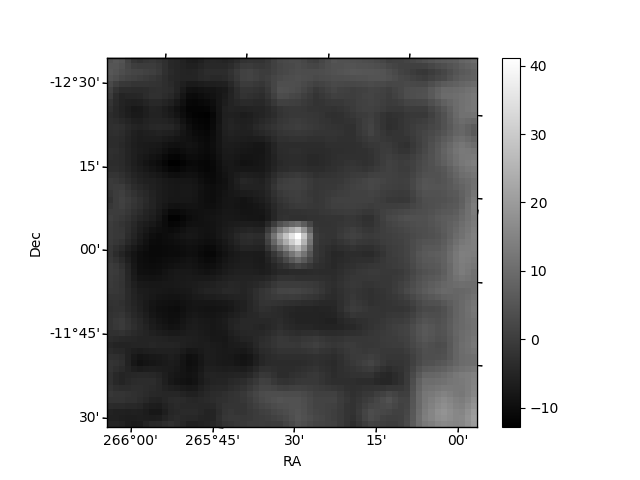
Quadrant B |
|---|---|---|---|
| Quadrant D | 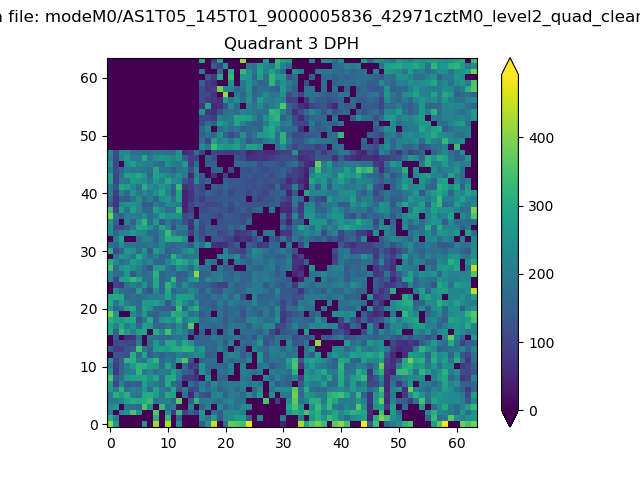 |
 |
Quadrant C |
| Plot type | Count rate plots | Images |
|---|---|---|
| Comparison with Poisson distribution Blue bars denote a histogram of data divided into 1 sec bins. Red curve is a Poisson curve with rate = median count rate of data. |
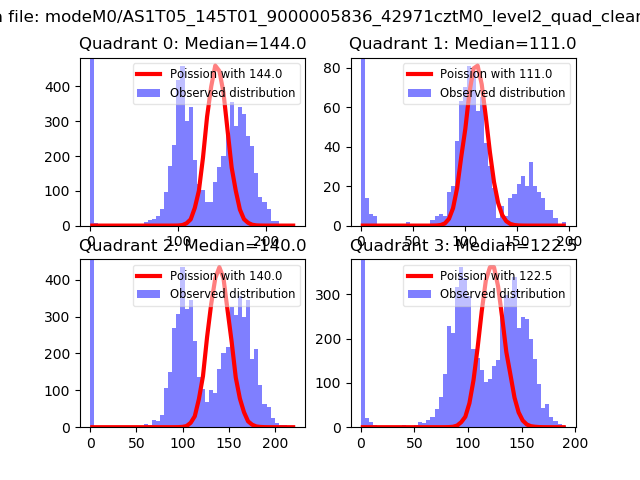 |
 |
| Quadrant-wise count rates Data is divided into 100 sec bins |
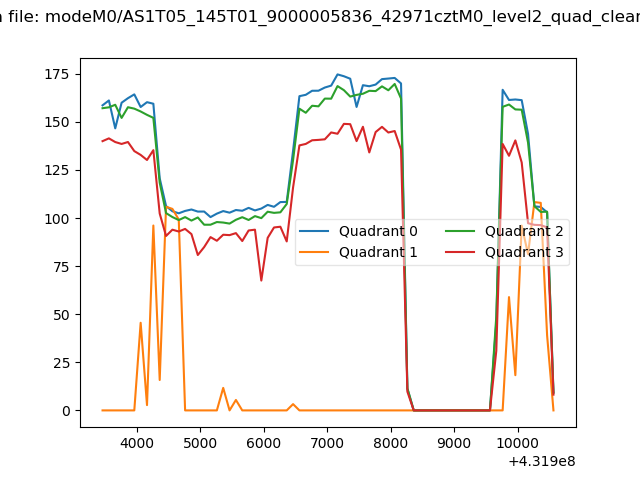 |
|
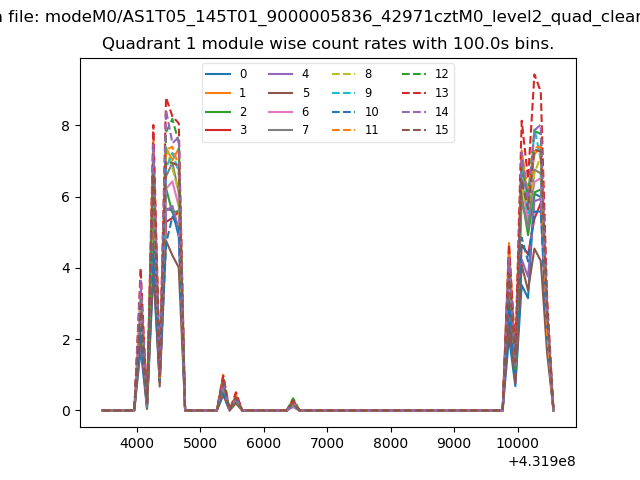
| Module-wise count rates for Quadrant A Data is divided into 100 sec bins |
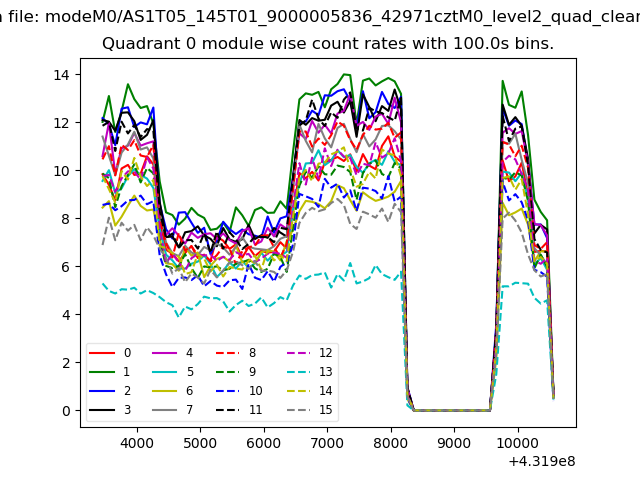 |
 |
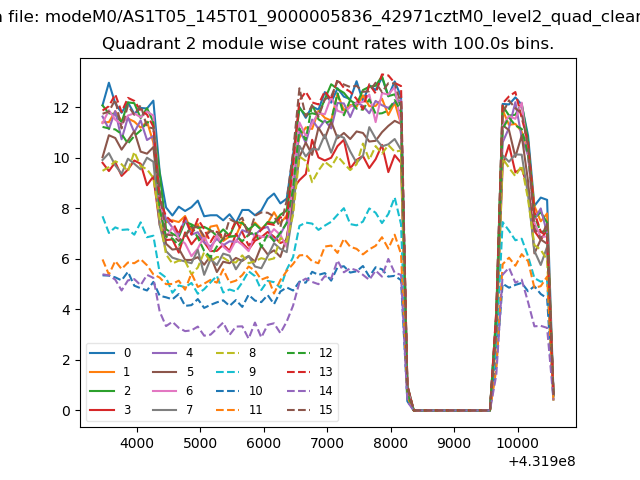
| Module-wise count rates for Quadrant B Data is divided into 100 sec bins |
 |
 |
| Module-wise count rates for Quadrant C Data is divided into 100 sec bins |
 |
 |
| Module-wise count rates for Quadrant D Data is divided into 100 sec bins |
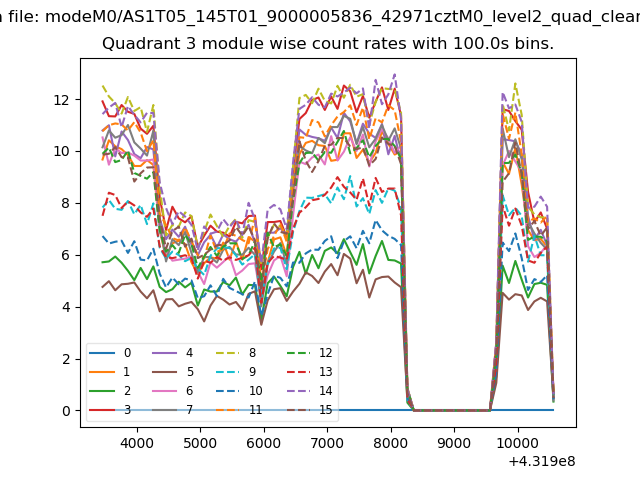 |
 |
| Parameter | Plot |
|---|---|
| CZT HV Monitor | 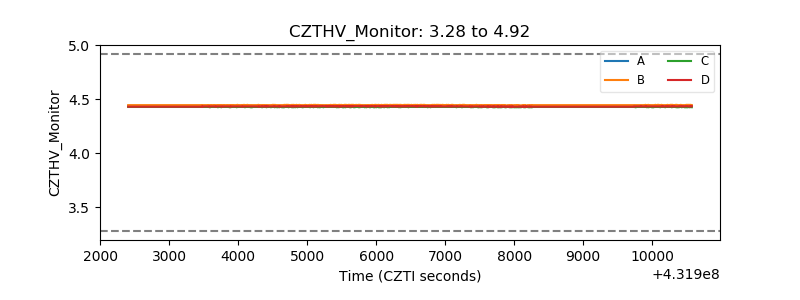 |
| D_VDD | 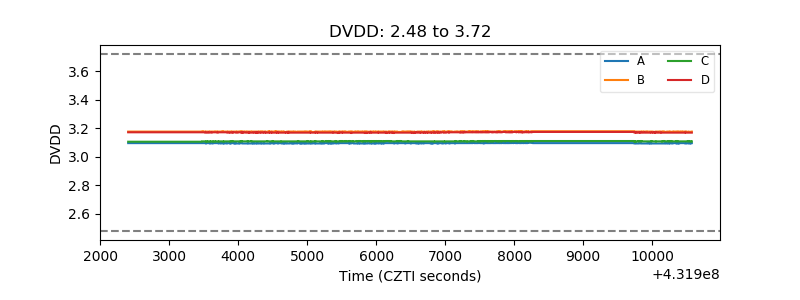 |
| Temperature 1 | 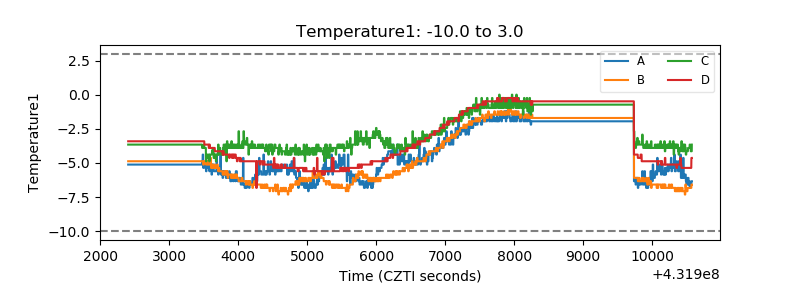 |
| Veto HV Monitor | 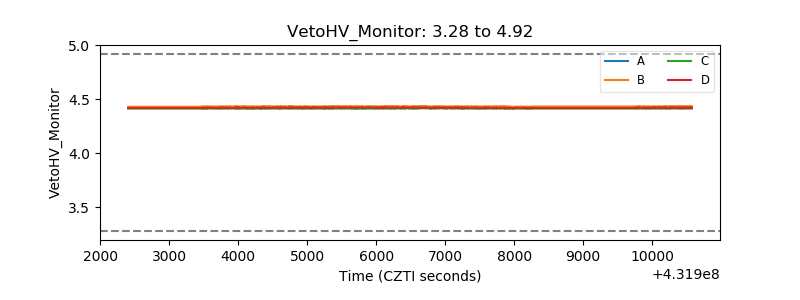 |
| Veto LLD | 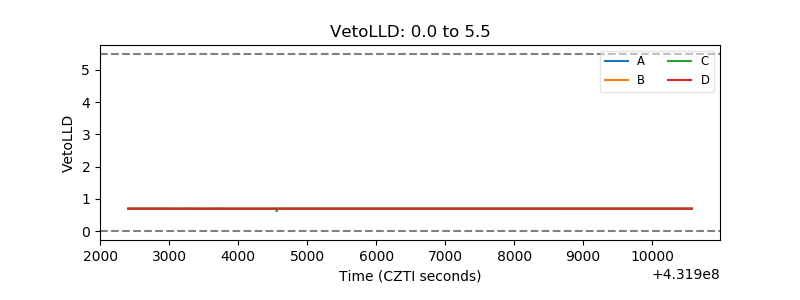 |
| Alpha Counter | 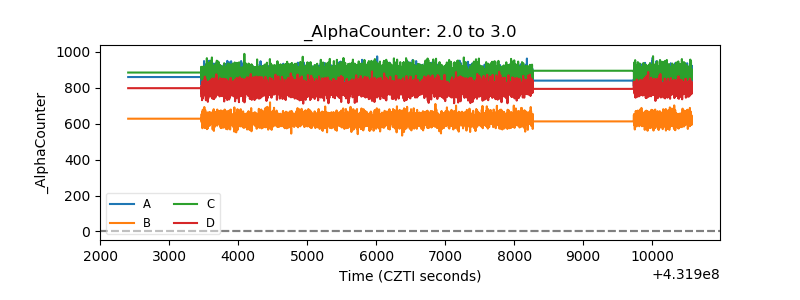 |
| _CPM_Rate | 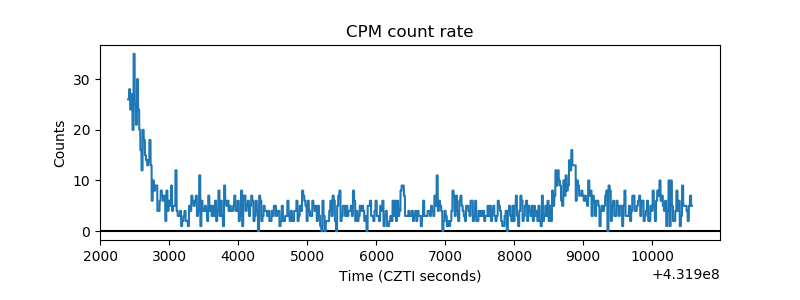 |
| CZT Counter | 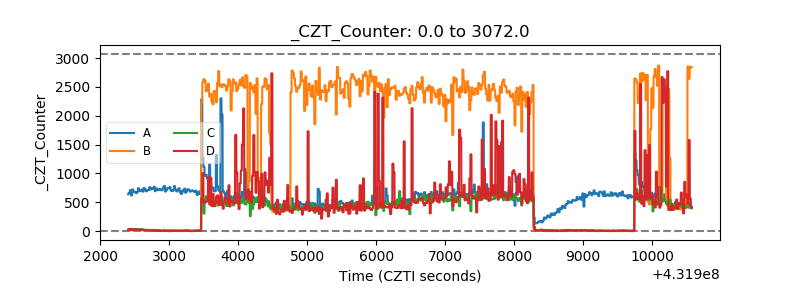 |
| +2.5 Volts monitor | 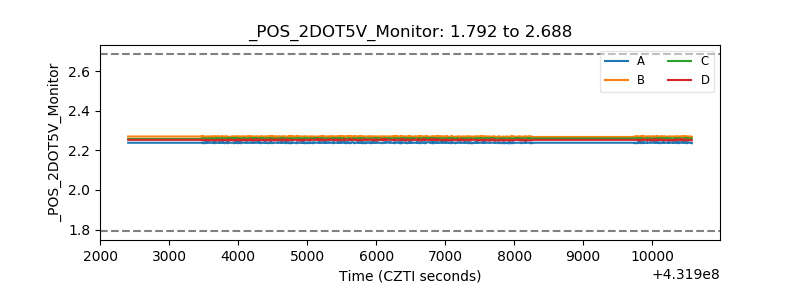 |
| +5 Volts monitor |  |
| _ROLL_ROT | 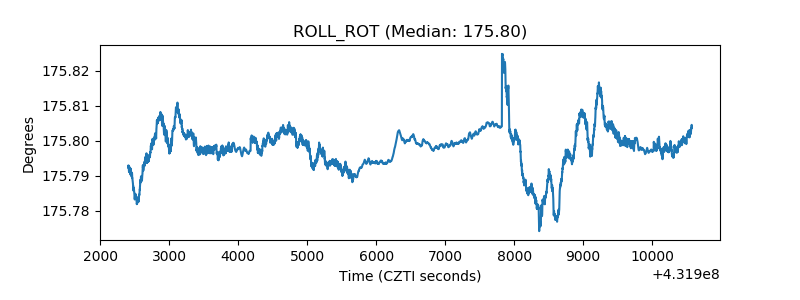 |
| _Roll_DEC | 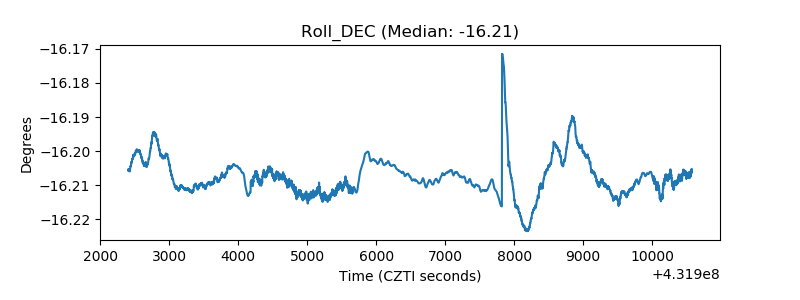 |
| _Roll_RA | 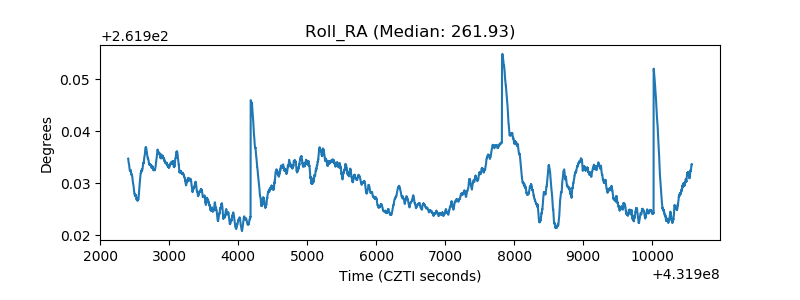 |
| Veto Counter | 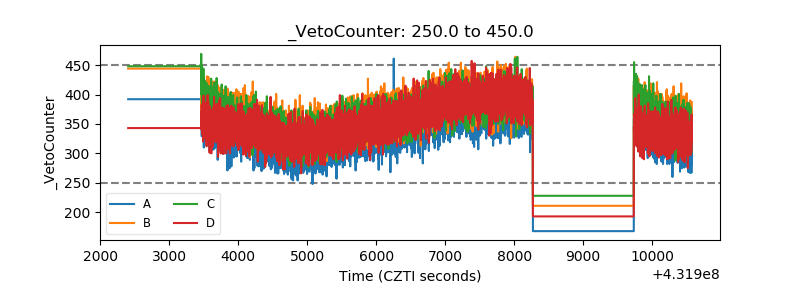 |