| Param | Original file | Final file |
|---|---|---|
| Filename | modeM0/AS1T05_145T01_9000005836_42972cztM0_level2.fits | modeM0/AS1T05_145T01_9000005836_42972cztM0_level2_quad_clean.evt |
| Size (bytes) | 563,169,600 | 81,688,320 |
| Size | 537.1 MB | 77.9 MB |
| Events in quadrant A | 3,136,424 | 701,361 |
| Events in quadrant B | 10,694,867 | 136,293 |
| Events in quadrant C | 2,643,443 | 682,908 |
| Events in quadrant D | 3,977,934 | 598,765 |
| Mode M0 | |||
|---|---|---|---|
| Quadrant | BADHDUFLAG | Total packets | Discarded packets |
| A | 0 | 12958 | 1 |
| B | 0 | 35245 | 1 |
| C | 0 | 10910 | 1 |
| D | 0 | 15251 | 1 |
| Mode M9 | |||
|---|---|---|---|
| Quadrant | BADHDUFLAG | Total packets | Discarded packets |
| A | 0 | 19 | 0 |
| B | 0 | 19 | 0 |
| C | 0 | 19 | 0 |
| D | 0 | 19 | 0 |
| Mode SS | |||
|---|---|---|---|
| Quadrant | BADHDUFLAG | Total packets | Discarded packets |
| A | 0 | 104 | 0 |
| B | 0 | 104 | 0 |
| C | 0 | 104 | 0 |
| D | 0 | 104 | 0 |
| Quadrant | Total seconds | Saturated seconds | Saturation percentage |
|---|---|---|---|
| A | 5059 | 104 | 2.055742% |
| B | 5060 | 4159 | 82.193676% |
| C | 5060 | 45 | 0.889328% |
| D | 5060 | 288 | 5.691700% |
Noise dominated data is calculated using 1-second bins in cleaned event files. If a bin has >2000 counts, and if more than 50% of those come from <1% of pixels, then it is considered to be noise-dominated and hence unusable.
| Quadrant | # 1 sec bins | Bins with >0 counts | Bins with >2000 counts | High rate bins dominated by noise | Noise dominated (total time) | Noise dominated (detector-on time) | Marked lightcurve |
|---|---|---|---|---|---|---|---|
| A | 6521 | 5060 | 70 | 70 | 1.07% | 1.38% | 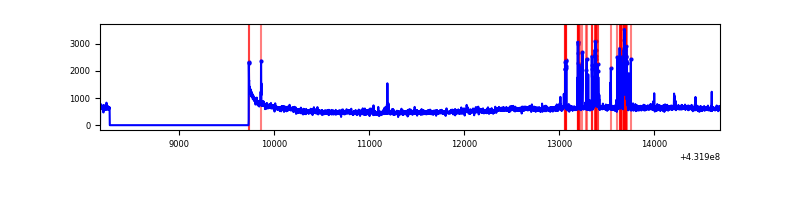 |
| B | 6522 | 5061 | 3909 | 3909 | 59.94% | 77.24% | 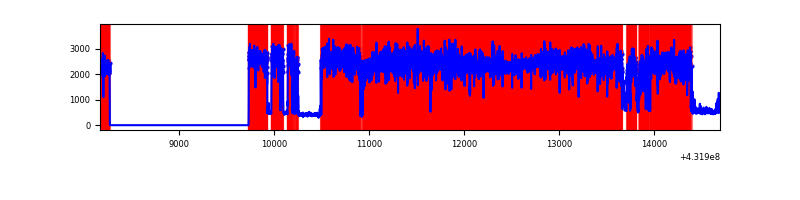 |
| C | 6522 | 5061 | 24 | 24 | 0.37% | 0.47% | 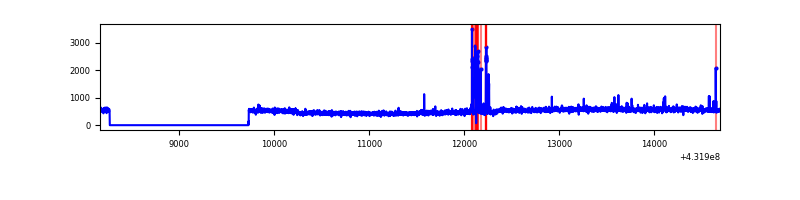 |
| D | 6522 | 5061 | 299 | 299 | 4.58% | 5.91% | 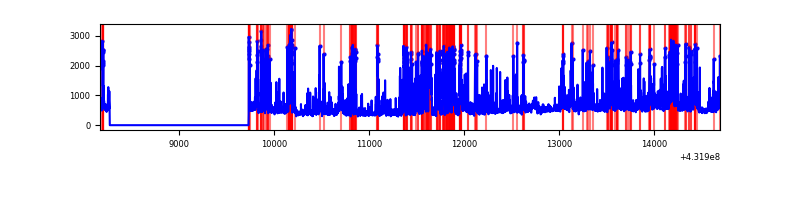 |
Top three noisy pixels from each quadrant. If the there are fewer than three noisy pixels in the level2.evt file, extra rows are filled as -1
| Pixel properties | Quadrant properties | ||||||
|---|---|---|---|---|---|---|---|
| Quadrant | DetID | PixID | Counts | Sigma | Mean | Median | Sigma |
| A | 10 | 83 | 460445 | 3352.45 | 610 | 599 | 137.2 |
| A | 15 | 237 | 276655 | 2012.55 | 610 | 599 | 137.2 |
| A | 15 | 222 | 18455 | 130.18 | 610 | 599 | 137.2 |
| B | 4 | 81 | 8493560 | 181647.88 | 219 | 214 | 46.8 |
| B | 4 | 171 | 1280182 | 27374.78 | 219 | 214 | 46.8 |
| B | 0 | 186 | 46743 | 995.12 | 219 | 214 | 46.8 |
| C | 15 | 214 | 202047 | 1366.22 | 595 | 602 | 147.4 |
| C | 14 | 254 | 98934 | 666.9 | 595 | 602 | 147.4 |
| C | 0 | 239 | 17052 | 111.57 | 595 | 602 | 147.4 |
| D | 12 | 2 | 770568 | 4946.29 | 585 | 569 | 155.7 |
| D | 1 | 47 | 370073 | 2373.6 | 585 | 569 | 155.7 |
| D | 1 | 52 | 239863 | 1537.17 | 585 | 569 | 155.7 |
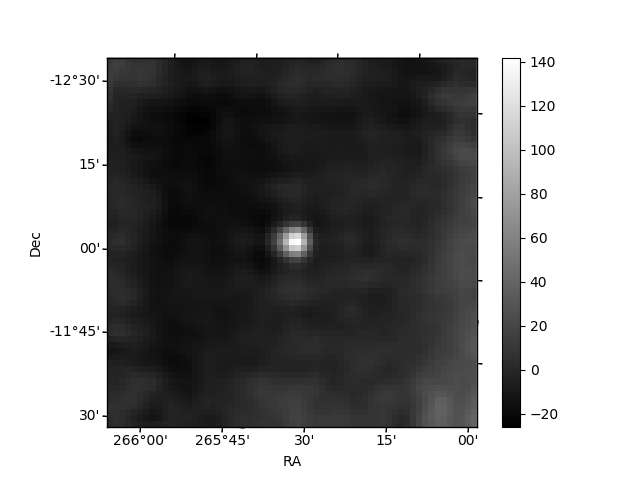
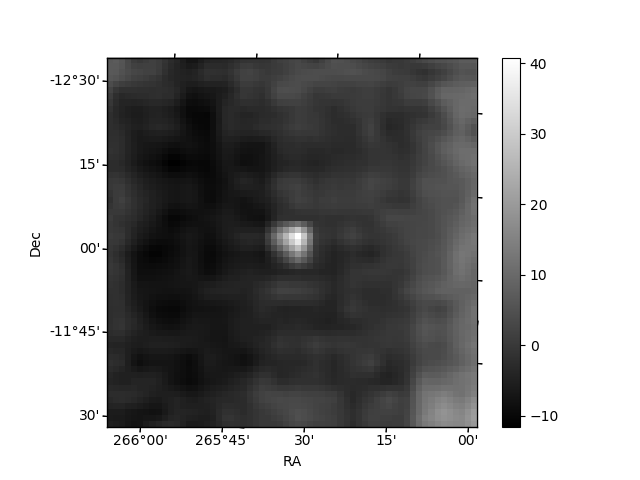
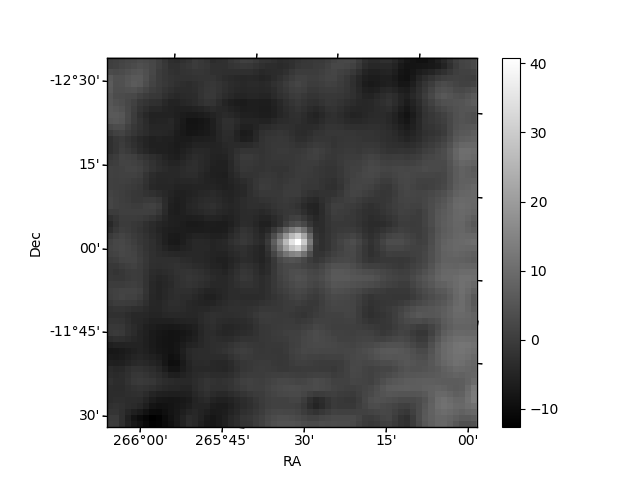
Histogram calculated using DETX and DETY for each event in the final _common_clean file
| Quadrant A | 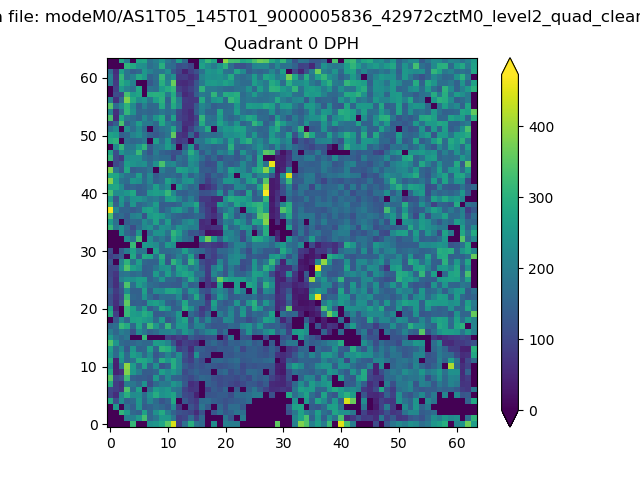 |
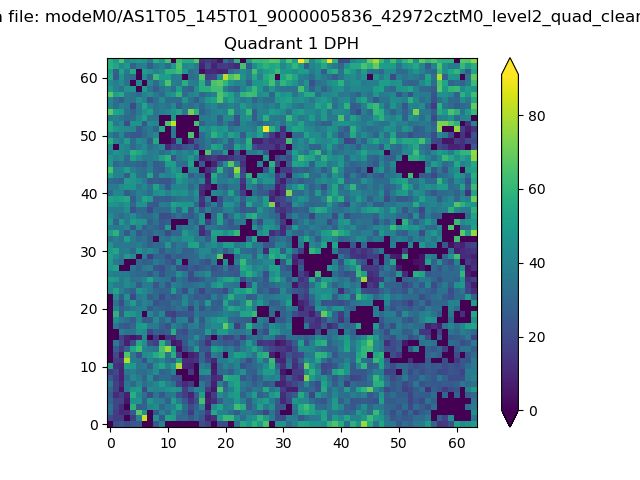 |
Quadrant B |
|---|---|---|---|
| Quadrant D | 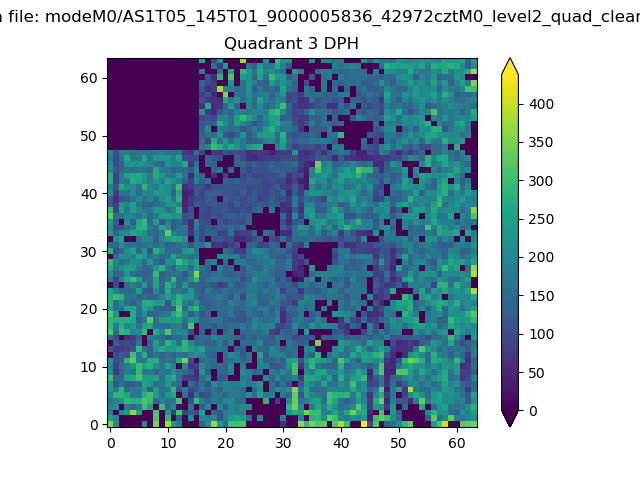 |
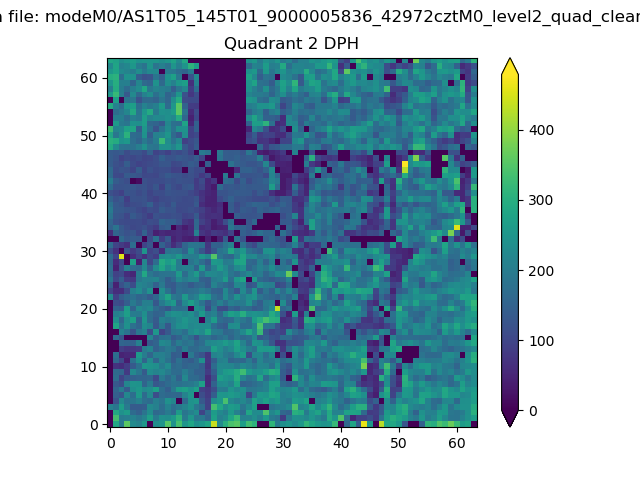 |
Quadrant C |
| Plot type | Count rate plots | Images |
|---|---|---|
| Comparison with Poisson distribution Blue bars denote a histogram of data divided into 1 sec bins. Red curve is a Poisson curve with rate = median count rate of data. |
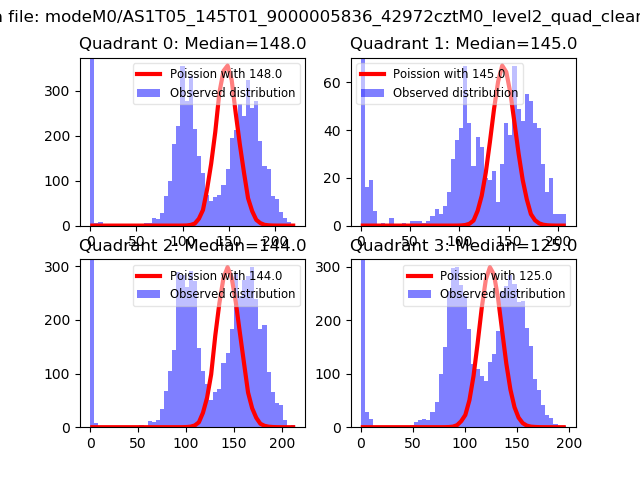 |
 |
| Quadrant-wise count rates Data is divided into 100 sec bins |
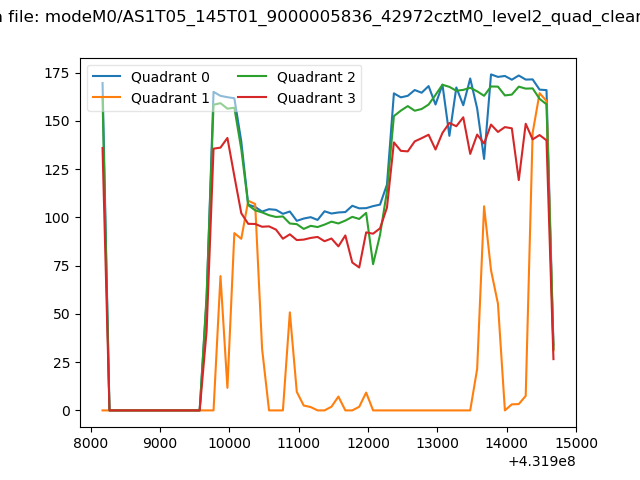 |
|
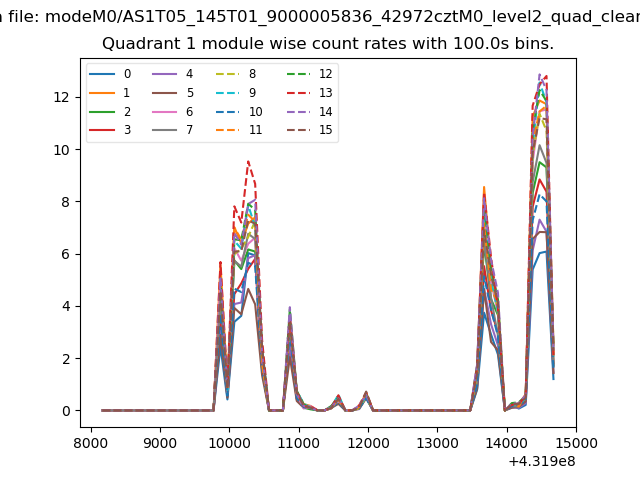
| Module-wise count rates for Quadrant A Data is divided into 100 sec bins |
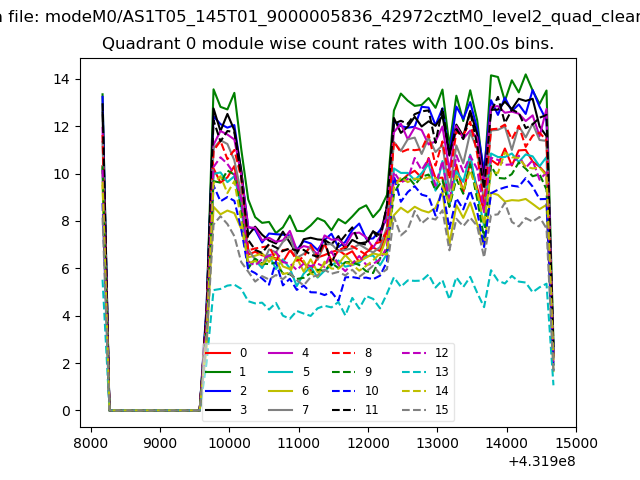 |
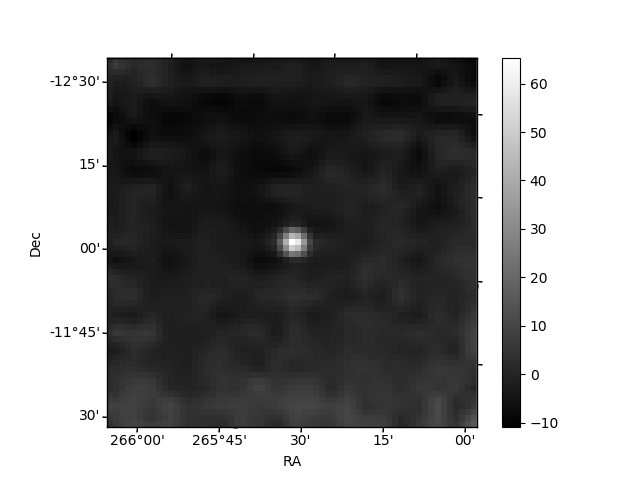 |
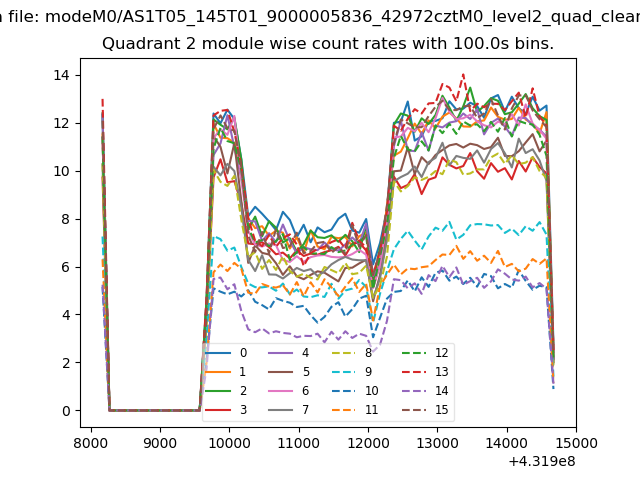
| Module-wise count rates for Quadrant B Data is divided into 100 sec bins |
 |
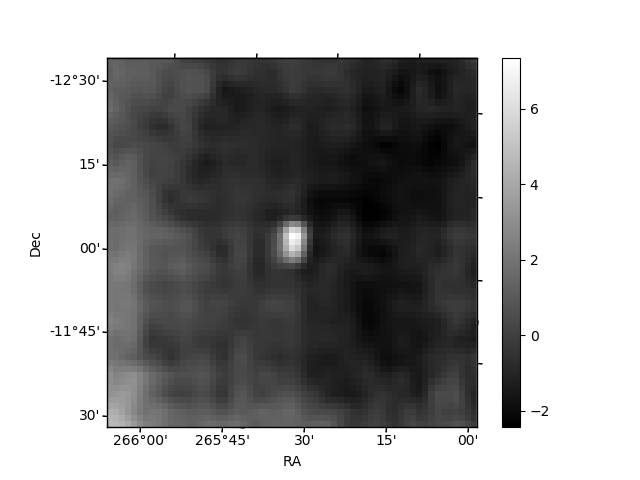 |
| Module-wise count rates for Quadrant C Data is divided into 100 sec bins |
 |
 |
| Module-wise count rates for Quadrant D Data is divided into 100 sec bins |
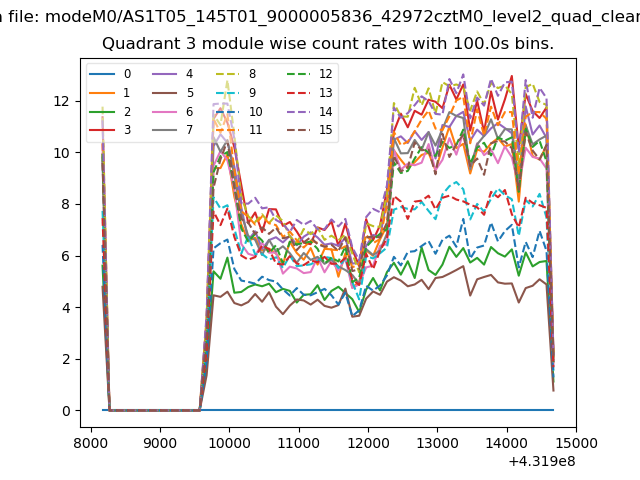 |
 |
| Parameter | Plot |
|---|---|
| CZT HV Monitor | 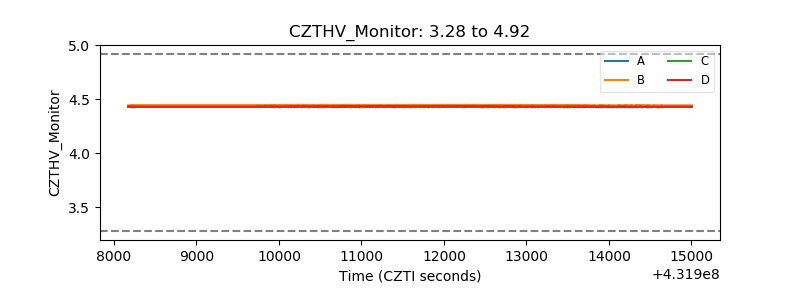 |
| D_VDD | 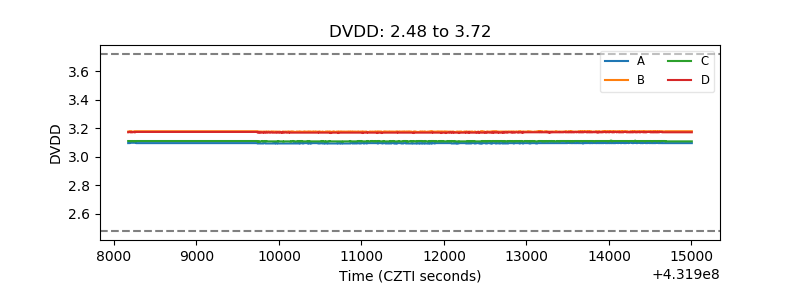 |
| Temperature 1 | 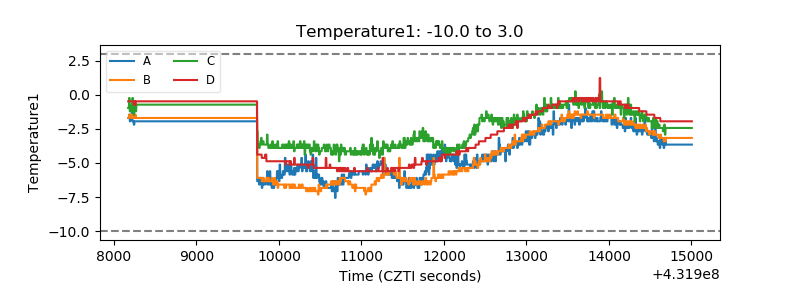 |
| Veto HV Monitor | 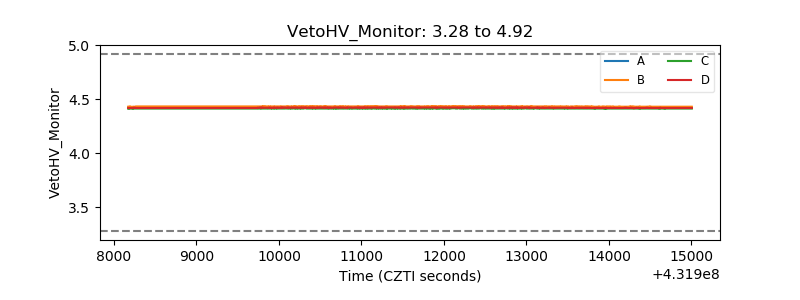 |
| Veto LLD | 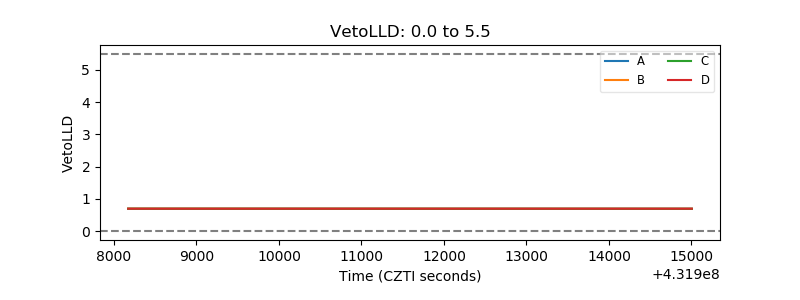 |
| Alpha Counter | 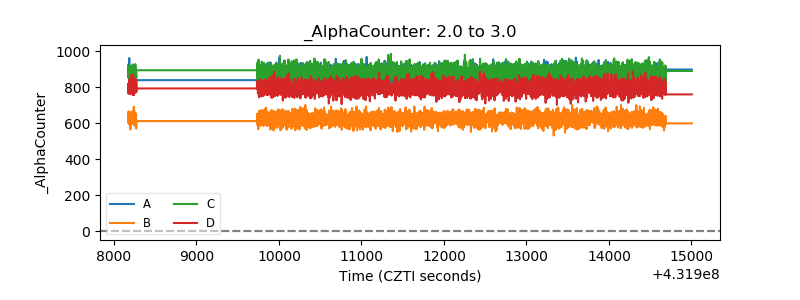 |
| _CPM_Rate | 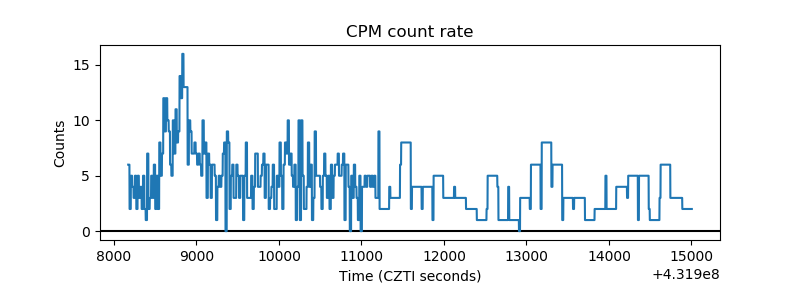 |
| CZT Counter | 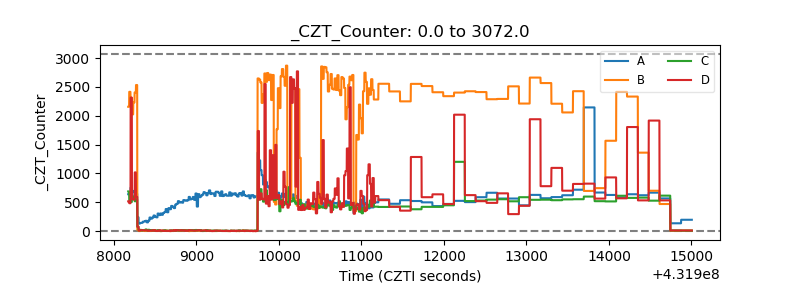 |
| +2.5 Volts monitor | 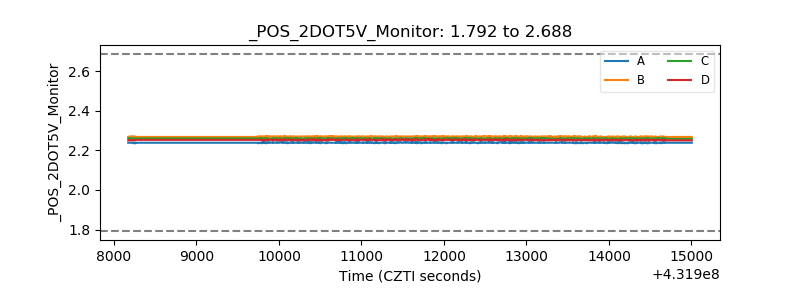 |
| +5 Volts monitor |  |
| _ROLL_ROT | 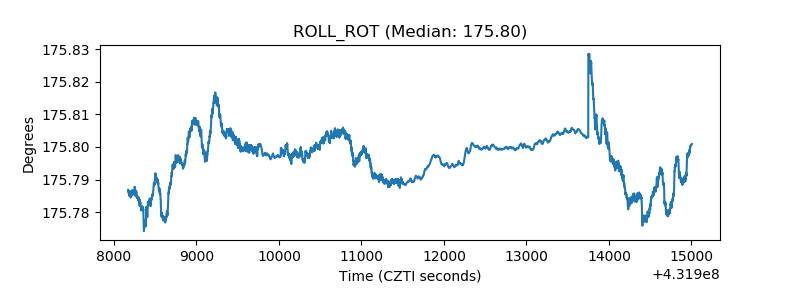 |
| _Roll_DEC | 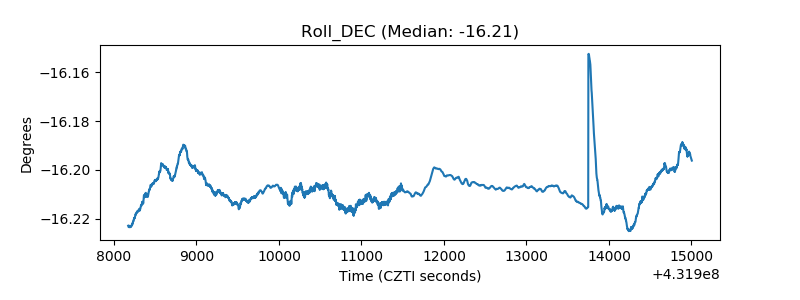 |
| _Roll_RA | 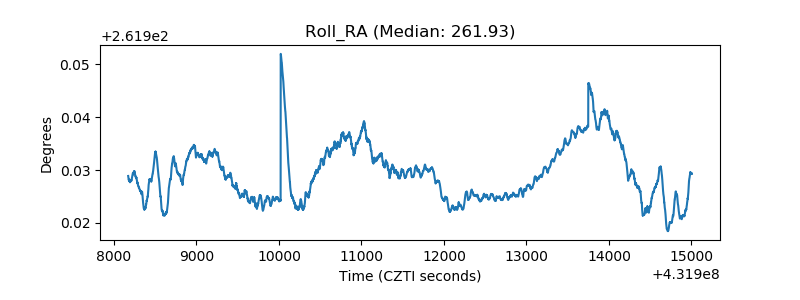 |
| Veto Counter | 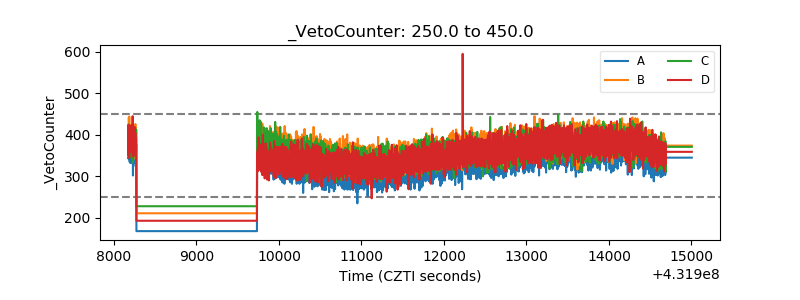 |