| Param | Original file | Final file |
|---|---|---|
| Filename | modeM0/AS1T05_148T01_9000005838_42975cztM0_level2.fits | modeM0/AS1T05_148T01_9000005838_42975cztM0_level2_quad_clean.evt |
| Size (bytes) | 1,132,830,720 | 303,416,640 |
| Size | 1.1 GB | 289.4 MB |
| Events in quadrant A | 9,185,135 | 2,161,734 |
| Events in quadrant B | 13,772,471 | 1,986,309 |
| Events in quadrant C | 7,966,161 | 2,098,197 |
| Events in quadrant D | 9,797,361 | 1,860,132 |
| Mode M9 | |||
|---|---|---|---|
| Quadrant | BADHDUFLAG | Total packets | Discarded packets |
| A | 0 | 42 | 0 |
| B | 0 | 43 | 0 |
| C | 0 | 43 | 0 |
| D | 0 | 43 | 0 |
| Mode SS | |||
|---|---|---|---|
| Quadrant | BADHDUFLAG | Total packets | Discarded packets |
| A | 0 | 320 | 0 |
| B | 0 | 320 | 0 |
| C | 0 | 320 | 0 |
| D | 0 | 320 | 0 |
| Mode M0 | |||
|---|---|---|---|
| Quadrant | BADHDUFLAG | Total packets | Discarded packets |
| A | 0 | 37422 | 4 |
| B | 0 | 51151 | 4 |
| C | 0 | 32320 | 6 |
| D | 0 | 39705 | 4 |
| Quadrant | Total seconds | Saturated seconds | Saturation percentage |
|---|---|---|---|
| A | 15677 | 63 | 0.401863% |
| B | 15677 | 2003 | 12.776679% |
| C | 15676 | 18 | 0.114825% |
| D | 15676 | 501 | 3.195968% |
Noise dominated data is calculated using 1-second bins in cleaned event files. If a bin has >2000 counts, and if more than 50% of those come from <1% of pixels, then it is considered to be noise-dominated and hence unusable.
| Quadrant | # 1 sec bins | Bins with >0 counts | Bins with >2000 counts | High rate bins dominated by noise | Noise dominated (total time) | Noise dominated (detector-on time) | Marked lightcurve |
|---|---|---|---|---|---|---|---|
| A | 19763 | 15680 | 42 | 42 | 0.21% | 0.27% | 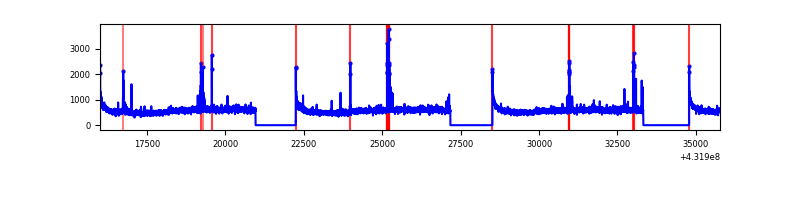 |
| B | 19763 | 15680 | 1483 | 1483 | 7.50% | 9.46% | 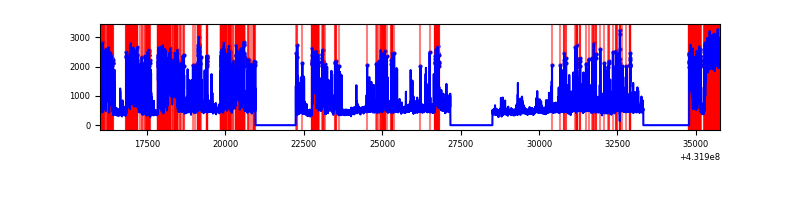 |
| C | 19762 | 15678 | 13 | 13 | 0.07% | 0.08% | 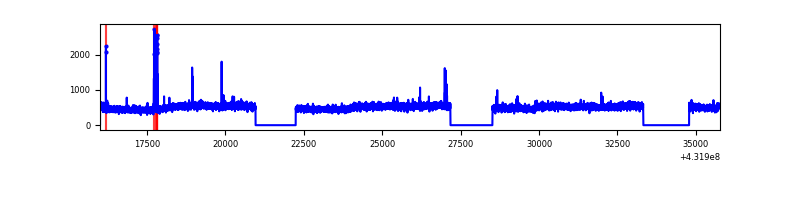 |
| D | 19762 | 15679 | 436 | 436 | 2.21% | 2.78% | 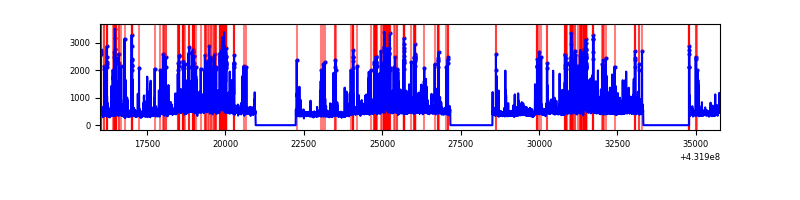 |
Top three noisy pixels from each quadrant. If the there are fewer than three noisy pixels in the level2.evt file, extra rows are filled as -1
| Pixel properties | Quadrant properties | ||||||
|---|---|---|---|---|---|---|---|
| Quadrant | DetID | PixID | Counts | Sigma | Mean | Median | Sigma |
| A | 10 | 83 | 1523199 | 3607.47 | 1915 | 1886 | 421.7 |
| A | 15 | 237 | 195643 | 459.45 | 1915 | 1886 | 421.7 |
| A | 15 | 222 | 50612 | 115.54 | 1915 | 1886 | 421.7 |
| B | 4 | 81 | 4749858 | 12564.17 | 1804 | 1761 | 377.9 |
| B | 4 | 171 | 1119051 | 2956.52 | 1804 | 1761 | 377.9 |
| B | 0 | 186 | 686173 | 1811.06 | 1804 | 1761 | 377.9 |
| C | 15 | 214 | 629889 | 1343.51 | 1860 | 1873 | 467.4 |
| C | 14 | 254 | 72441 | 150.97 | 1860 | 1873 | 467.4 |
| C | 15 | 111 | 17461 | 33.35 | 1860 | 1873 | 467.4 |
| D | 1 | 47 | 756454 | 1575.11 | 1823 | 1763 | 479.1 |
| D | 13 | 249 | 723679 | 1506.71 | 1823 | 1763 | 479.1 |
| D | 12 | 16 | 297091 | 616.38 | 1823 | 1763 | 479.1 |
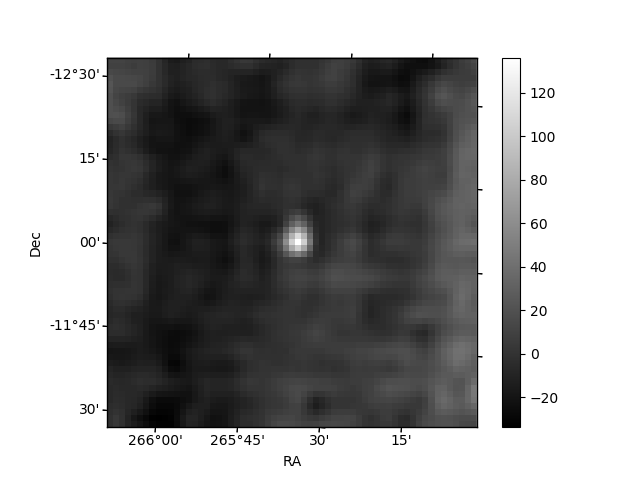
Histogram calculated using DETX and DETY for each event in the final _common_clean file
| Quadrant A | 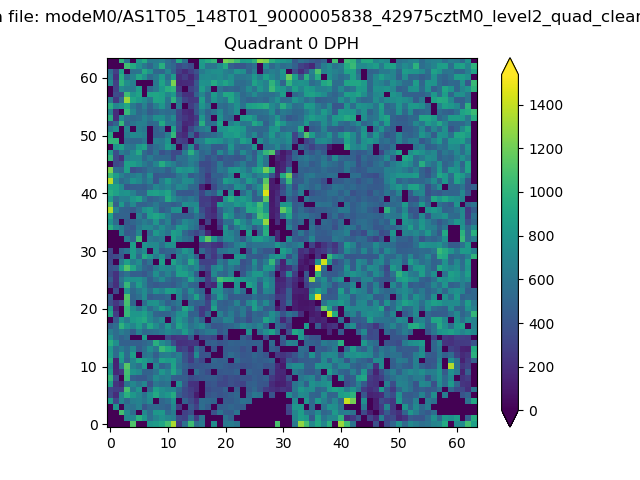 |
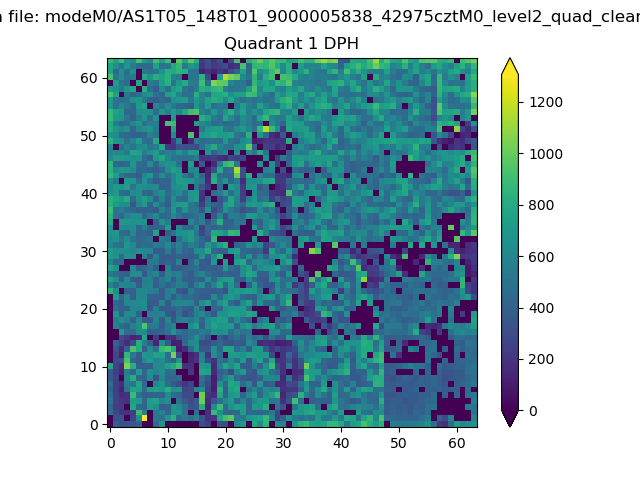 |
Quadrant B |
|---|---|---|---|
| Quadrant D | 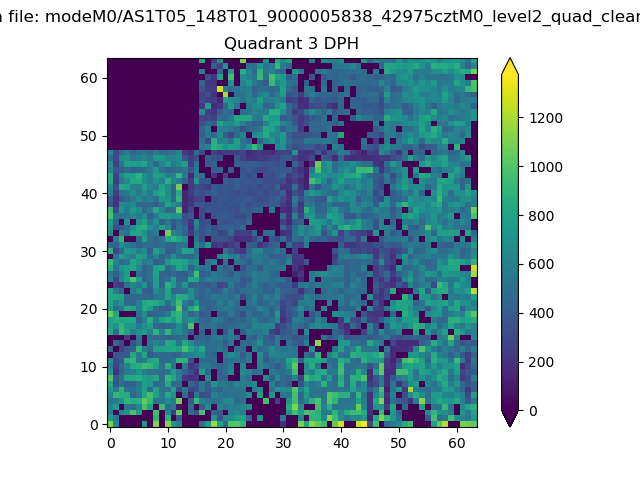 |
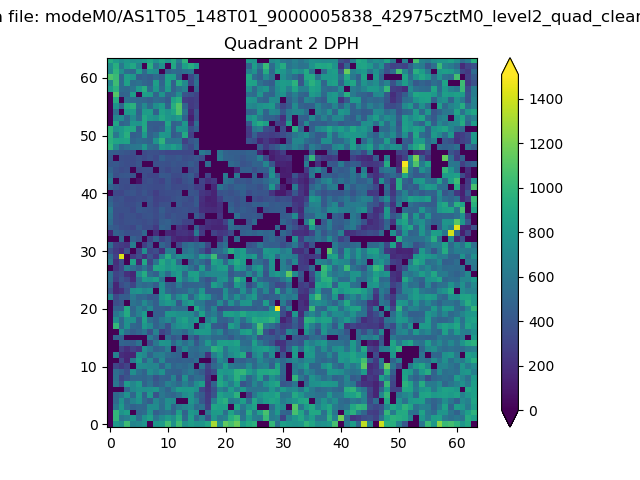 |
Quadrant C |
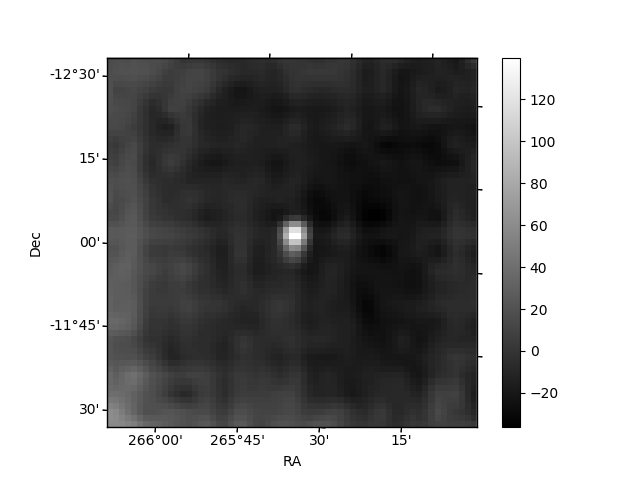
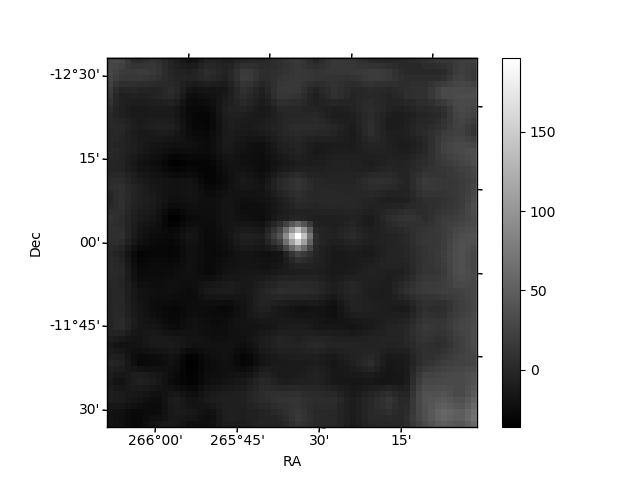
| Plot type | Count rate plots | Images |
|---|---|---|
| Comparison with Poisson distribution Blue bars denote a histogram of data divided into 1 sec bins. Red curve is a Poisson curve with rate = median count rate of data. |
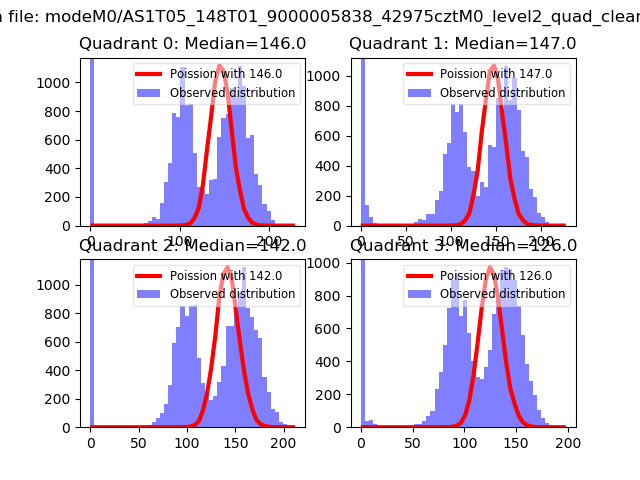 |
 |
| Quadrant-wise count rates Data is divided into 100 sec bins |
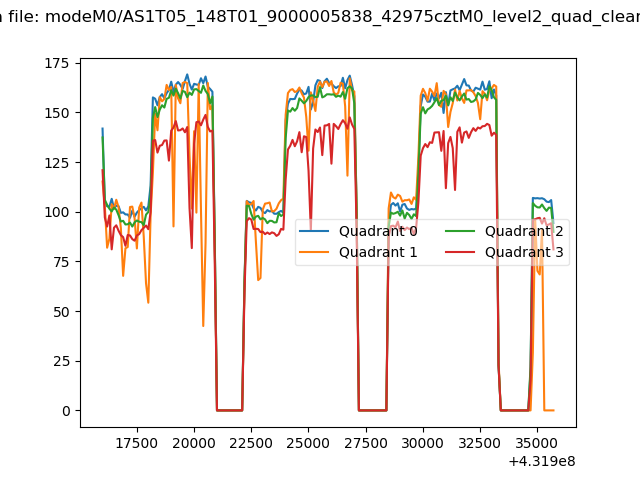 |
|
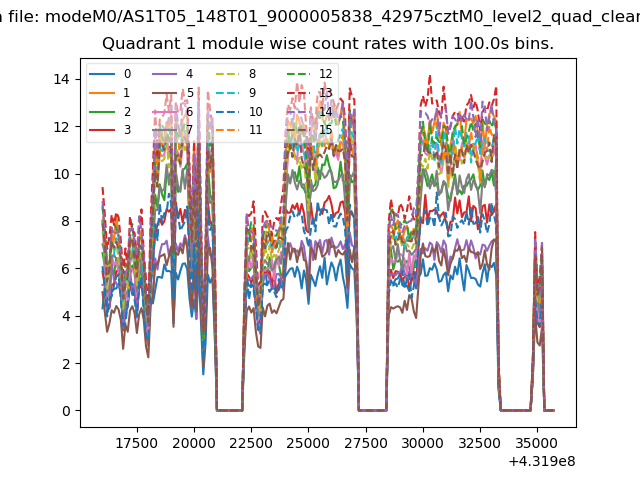
| Module-wise count rates for Quadrant A Data is divided into 100 sec bins |
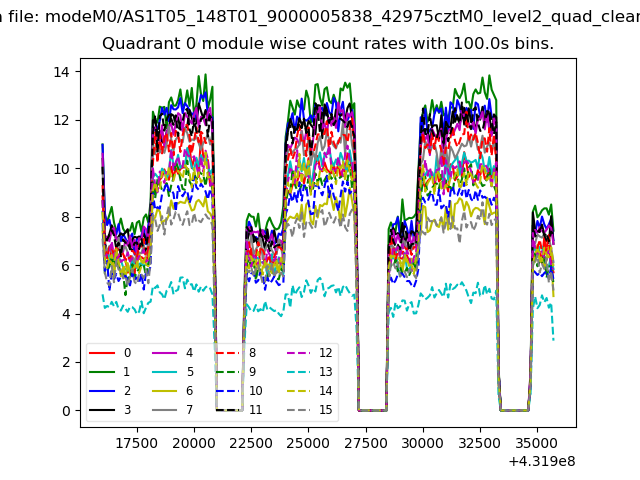 |
 |
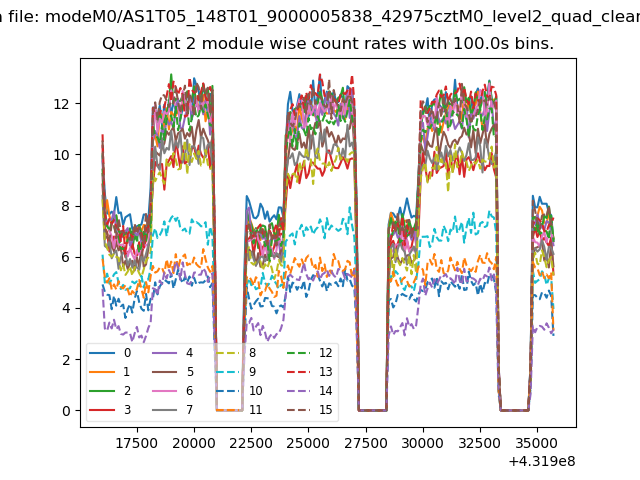
| Module-wise count rates for Quadrant B Data is divided into 100 sec bins |
 |
 |
| Module-wise count rates for Quadrant C Data is divided into 100 sec bins |
 |
 |
| Module-wise count rates for Quadrant D Data is divided into 100 sec bins |
 |
 |
| Parameter | Plot |
|---|---|
| CZT HV Monitor |  |
| D_VDD | 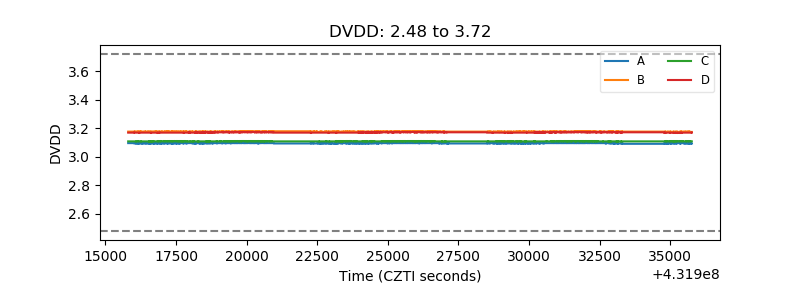 |
| Temperature 1 | 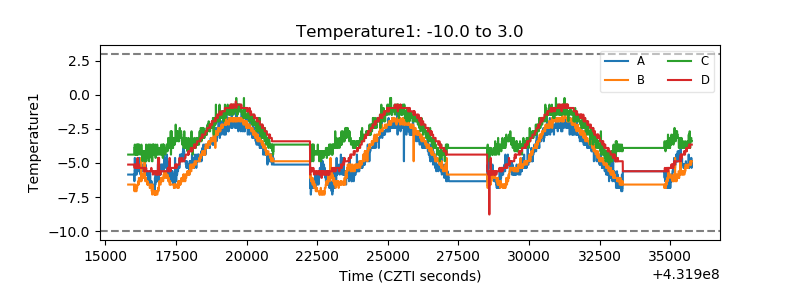 |
| Veto HV Monitor | 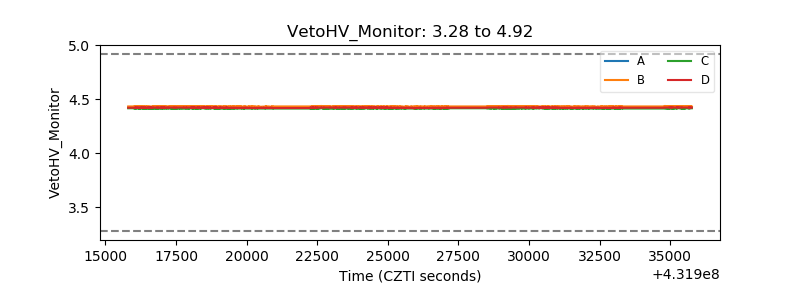 |
| Veto LLD | 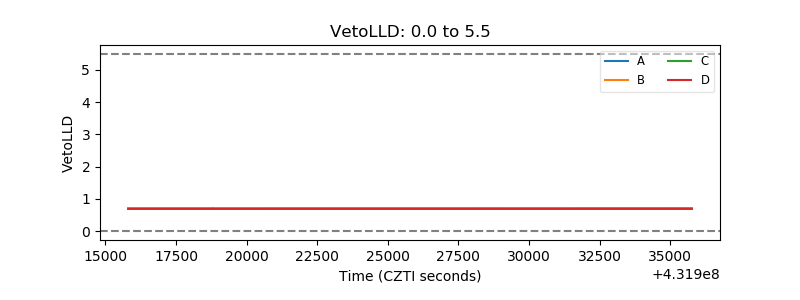 |
| Alpha Counter |  |
| _CPM_Rate | 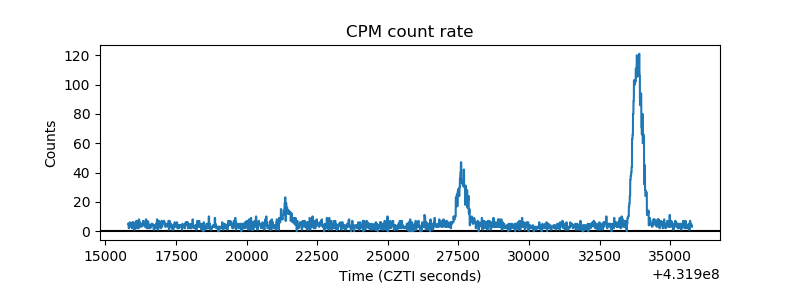 |
| CZT Counter |  |
| +2.5 Volts monitor |  |
| +5 Volts monitor |  |
| _ROLL_ROT | 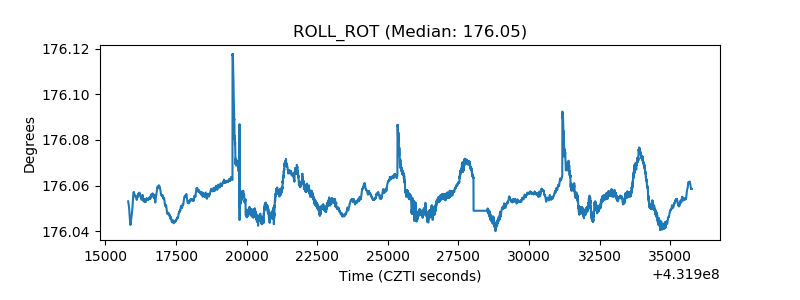 |
| _Roll_DEC | 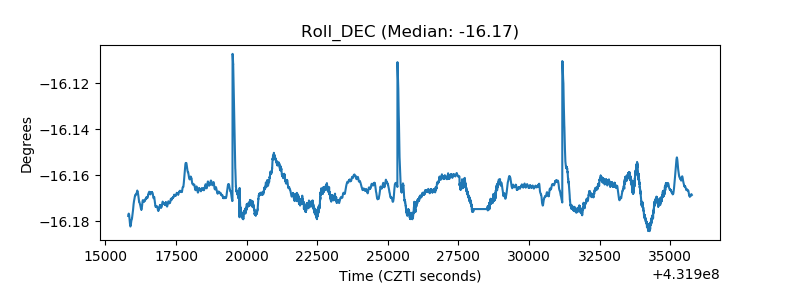 |
| _Roll_RA | 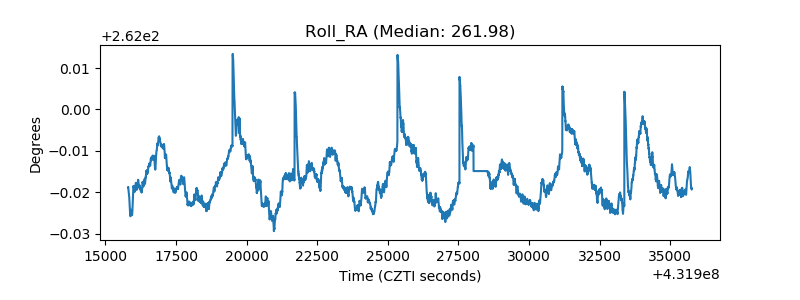 |
| Veto Counter |  |