| Param | Original file | Final file |
|---|---|---|
| Filename | modeM0/AS1T05_148T01_9000005838_42976cztM0_level2.fits | modeM0/AS1T05_148T01_9000005838_42976cztM0_level2_quad_clean.evt |
| Size (bytes) | 465,528,960 | 118,494,720 |
| Size | 444.0 MB | 113.0 MB |
| Events in quadrant A | 3,546,244 | 884,052 |
| Events in quadrant B | 6,885,885 | 677,911 |
| Events in quadrant C | 3,053,269 | 857,529 |
| Events in quadrant D | 3,292,693 | 760,601 |
| Mode M9 | |||
|---|---|---|---|
| Quadrant | BADHDUFLAG | Total packets | Discarded packets |
| A | 0 | 30 | 0 |
| B | 0 | 30 | 0 |
| C | 0 | 30 | 0 |
| D | 0 | 30 | 0 |
| Mode SS | |||
|---|---|---|---|
| Quadrant | BADHDUFLAG | Total packets | Discarded packets |
| A | 0 | 122 | 0 |
| B | 0 | 122 | 0 |
| C | 0 | 122 | 0 |
| D | 0 | 122 | 0 |
| Mode M0 | |||
|---|---|---|---|
| Quadrant | BADHDUFLAG | Total packets | Discarded packets |
| A | 0 | 14292 | 2 |
| B | 0 | 24302 | 2 |
| C | 0 | 12083 | 2 |
| D | 0 | 13391 | 2 |
| Quadrant | Total seconds | Saturated seconds | Saturation percentage |
|---|---|---|---|
| A | 5841 | 22 | 0.376648% |
| B | 5841 | 1632 | 27.940421% |
| C | 5840 | 5 | 0.085616% |
| D | 5840 | 79 | 1.352740% |
Noise dominated data is calculated using 1-second bins in cleaned event files. If a bin has >2000 counts, and if more than 50% of those come from <1% of pixels, then it is considered to be noise-dominated and hence unusable.
| Quadrant | # 1 sec bins | Bins with >0 counts | Bins with >2000 counts | High rate bins dominated by noise | Noise dominated (total time) | Noise dominated (detector-on time) | Marked lightcurve |
|---|---|---|---|---|---|---|---|
| A | 8885 | 5843 | 6 | 6 | 0.07% | 0.10% | 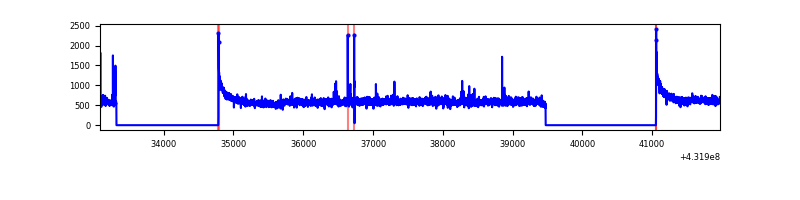 |
| B | 8885 | 5843 | 1361 | 1361 | 15.32% | 23.29% | 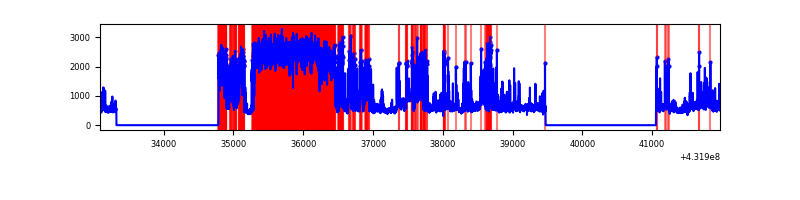 |
| C | 8884 | 5842 | 0 | 0 | 0.00% | 0.00% | 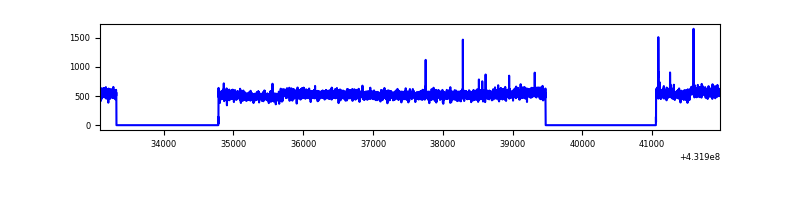 |
| D | 8884 | 5842 | 68 | 68 | 0.77% | 1.16% |  |
Top three noisy pixels from each quadrant. If the there are fewer than three noisy pixels in the level2.evt file, extra rows are filled as -1
| Pixel properties | Quadrant properties | ||||||
|---|---|---|---|---|---|---|---|
| Quadrant | DetID | PixID | Counts | Sigma | Mean | Median | Sigma |
| A | 10 | 83 | 620293 | 3636.27 | 740 | 725 | 170.4 |
| A | 15 | 222 | 29648 | 169.75 | 740 | 725 | 170.4 |
| A | 15 | 237 | 27790 | 158.85 | 740 | 725 | 170.4 |
| B | 4 | 81 | 3687276 | 27392.09 | 612 | 598 | 134.6 |
| B | 4 | 171 | 495500 | 3677.13 | 612 | 598 | 134.6 |
| B | 0 | 186 | 213309 | 1580.45 | 612 | 598 | 134.6 |
| C | 15 | 214 | 241145 | 1286.72 | 717 | 718 | 186.9 |
| C | 14 | 254 | 6005 | 28.29 | 717 | 718 | 186.9 |
| C | 13 | 61 | 4671 | 21.15 | 717 | 718 | 186.9 |
| D | 1 | 52 | 176536 | 915.66 | 709 | 684 | 192.0 |
| D | 13 | 249 | 164693 | 853.99 | 709 | 684 | 192.0 |
| D | 2 | 249 | 91554 | 473.16 | 709 | 684 | 192.0 |
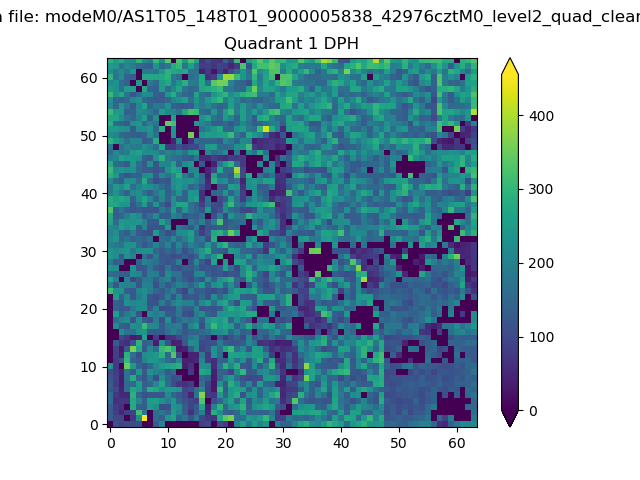
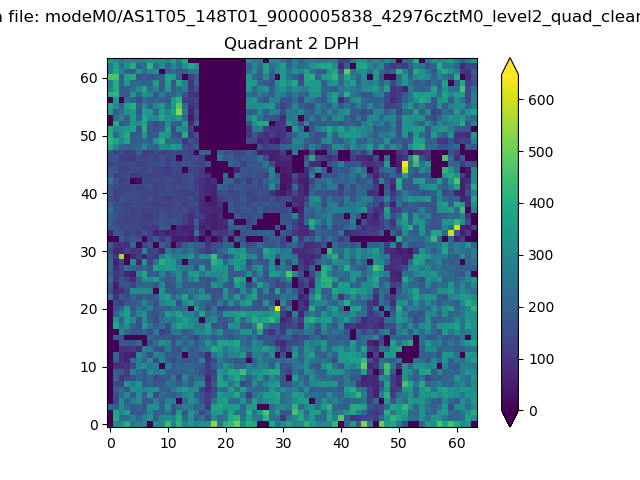
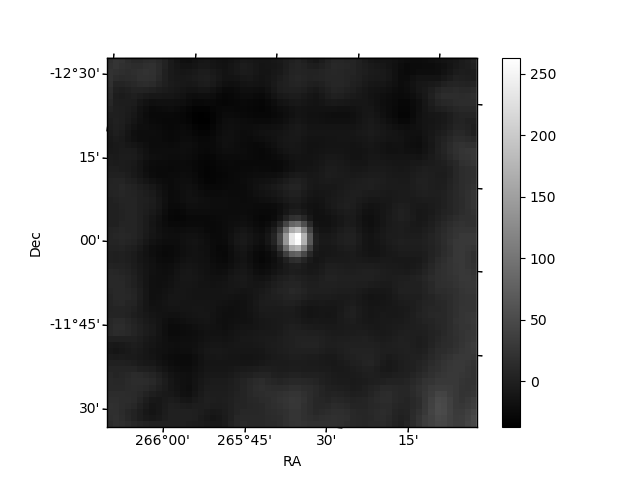
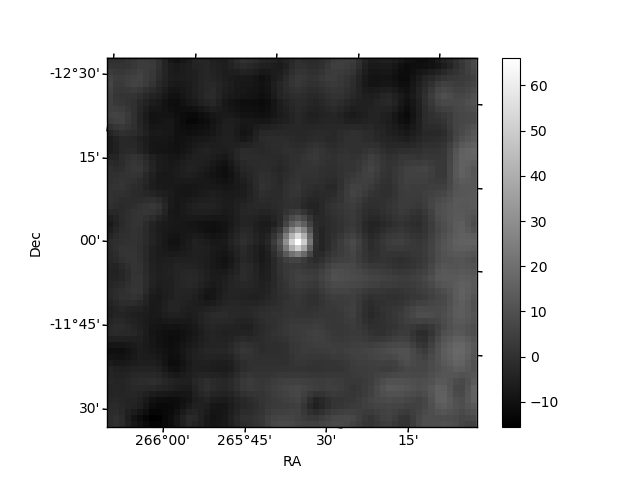
Histogram calculated using DETX and DETY for each event in the final _common_clean file
| Quadrant A | 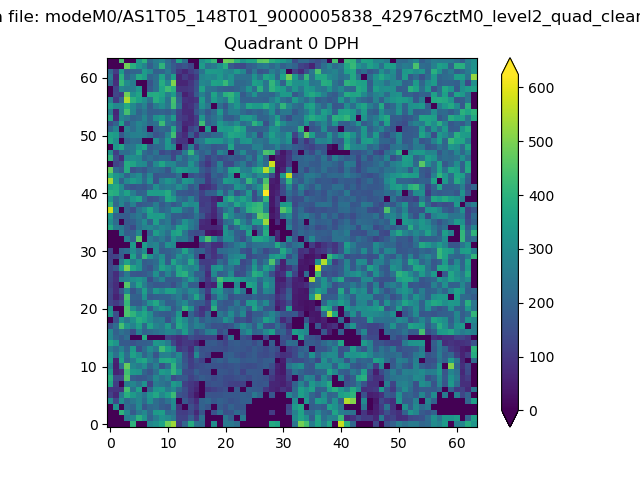 |
 |
Quadrant B |
|---|---|---|---|
| Quadrant D | 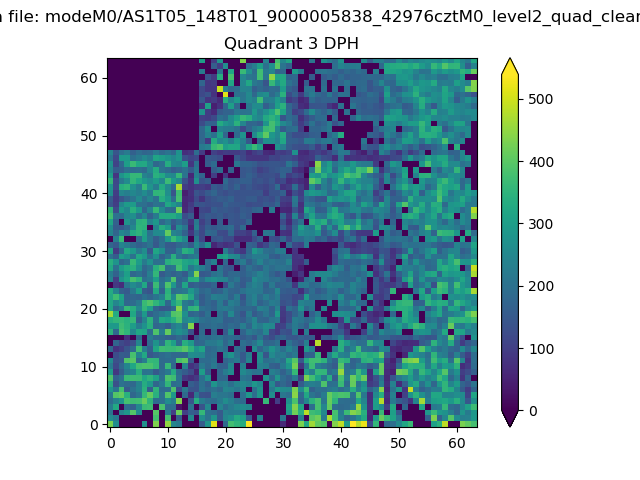 |
 |
Quadrant C |
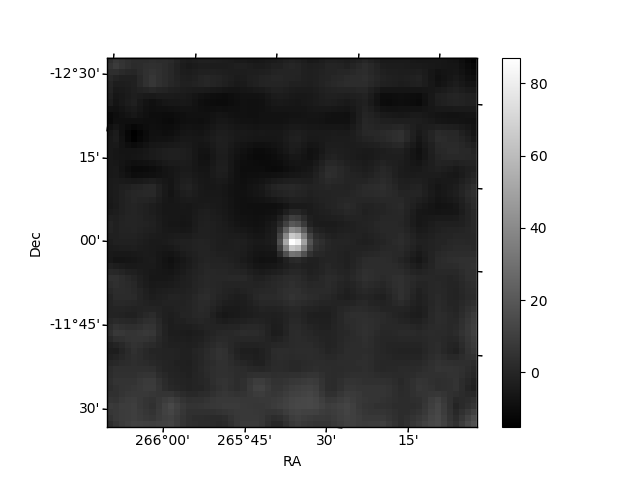
| Plot type | Count rate plots | Images |
|---|---|---|
| Comparison with Poisson distribution Blue bars denote a histogram of data divided into 1 sec bins. Red curve is a Poisson curve with rate = median count rate of data. |
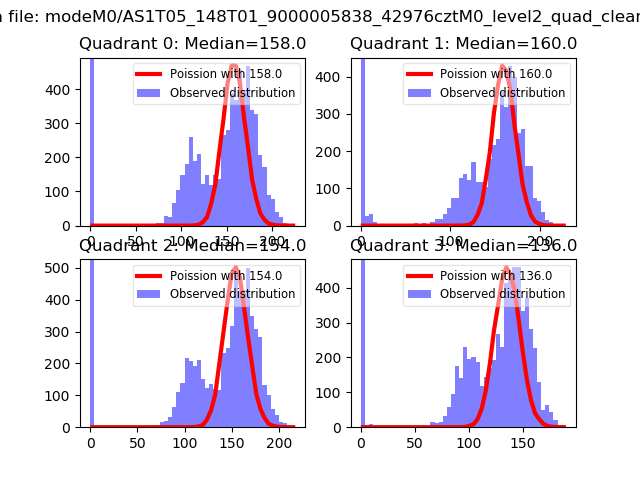 |
 |
| Quadrant-wise count rates Data is divided into 100 sec bins |
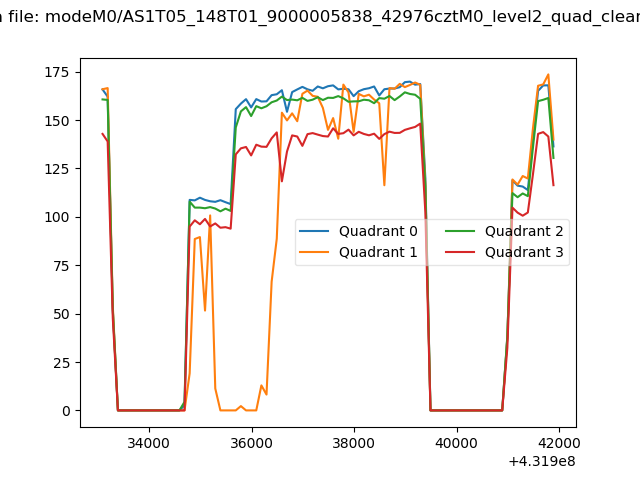 |
|
| Module-wise count rates for Quadrant A Data is divided into 100 sec bins |
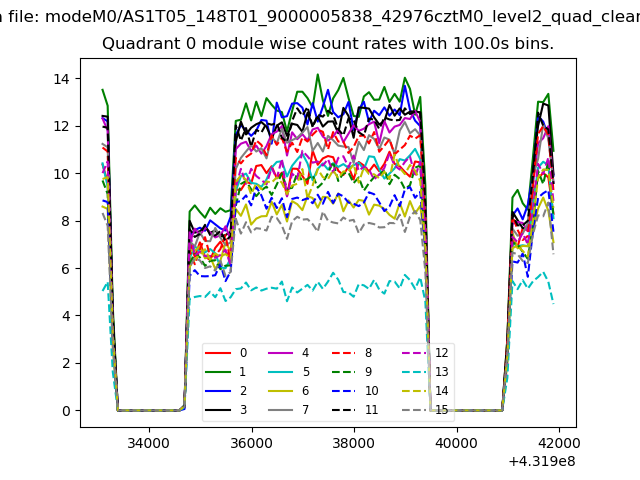 |
 |
| Module-wise count rates for Quadrant B Data is divided into 100 sec bins |
 |
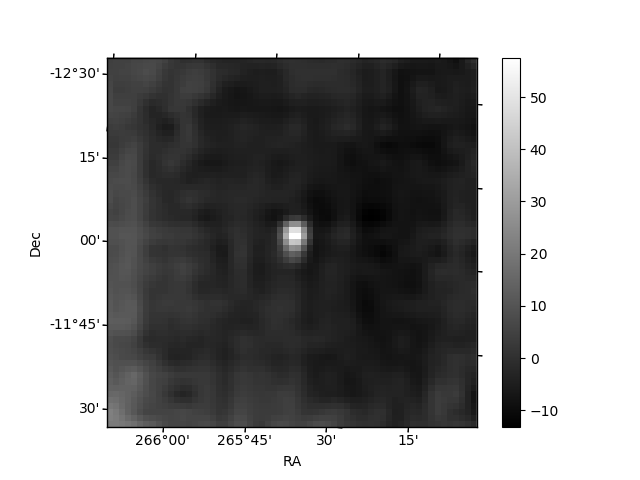 |
| Module-wise count rates for Quadrant C Data is divided into 100 sec bins |
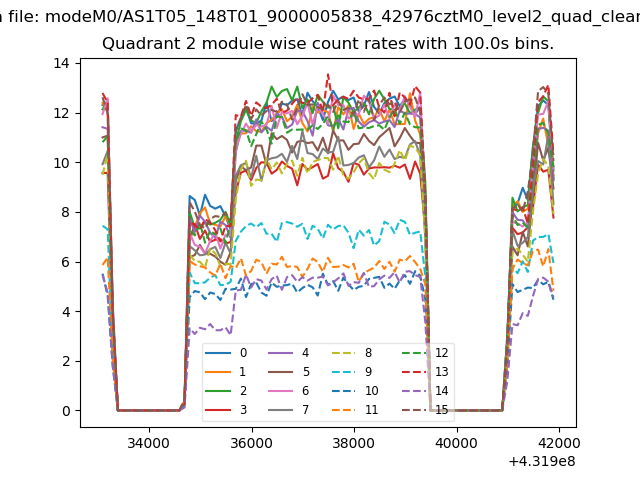 |
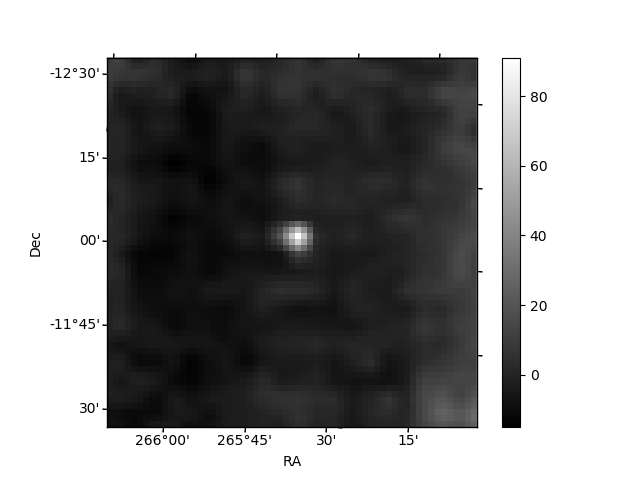 |
| Module-wise count rates for Quadrant D Data is divided into 100 sec bins |
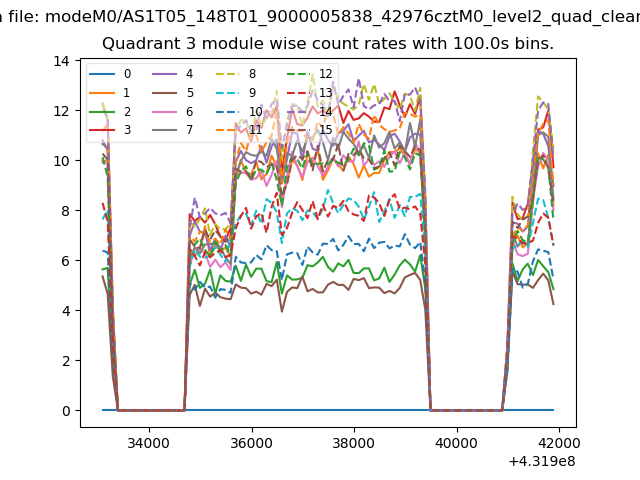 |
 |
| Parameter | Plot |
|---|---|
| CZT HV Monitor | 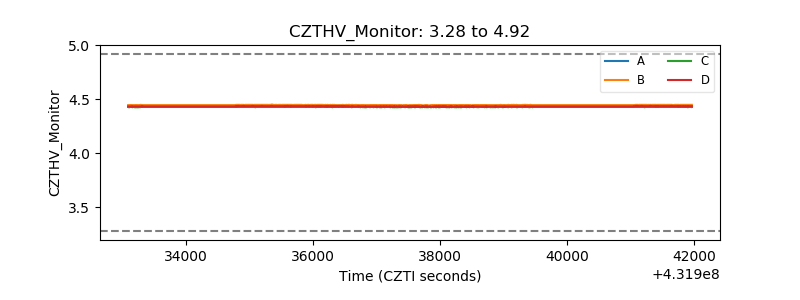 |
| D_VDD | 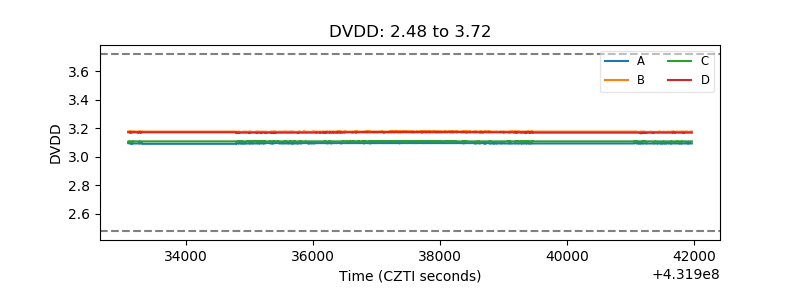 |
| Temperature 1 | 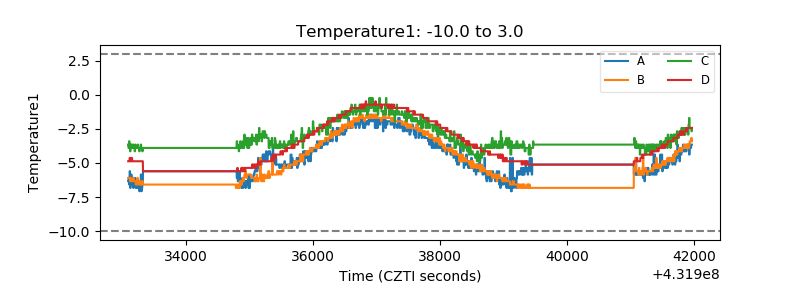 |
| Veto HV Monitor |  |
| Veto LLD | 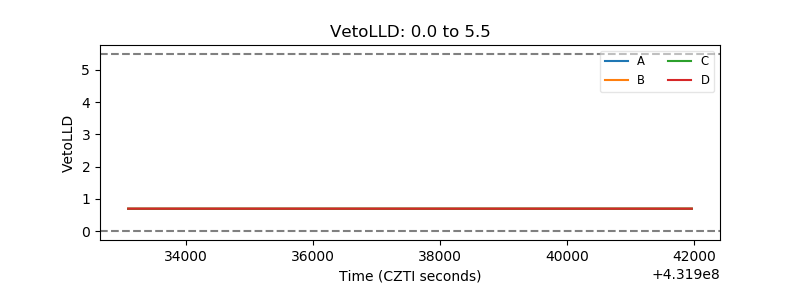 |
| Alpha Counter |  |
| _CPM_Rate |  |
| CZT Counter | 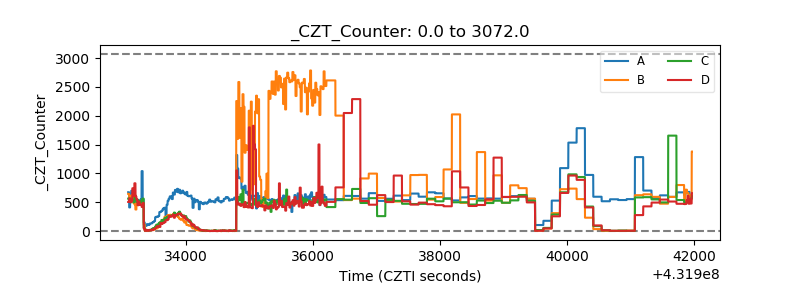 |
| +2.5 Volts monitor | 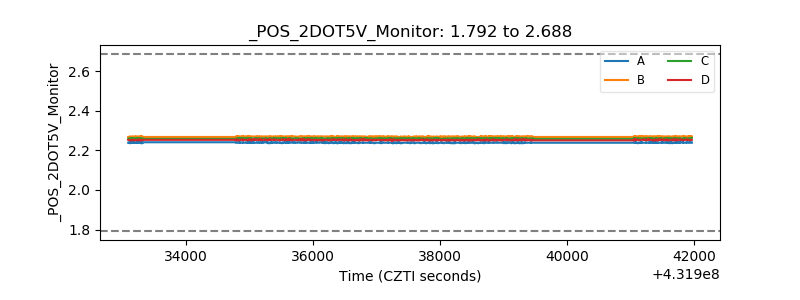 |
| +5 Volts monitor |  |
| _ROLL_ROT | 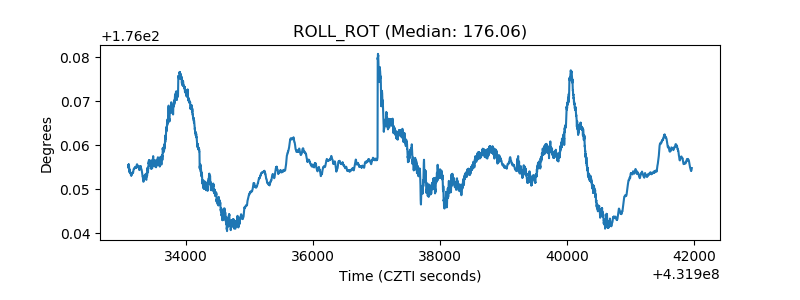 |
| _Roll_DEC | 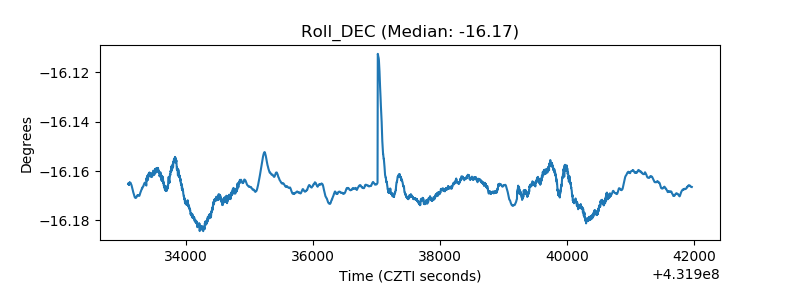 |
| _Roll_RA | 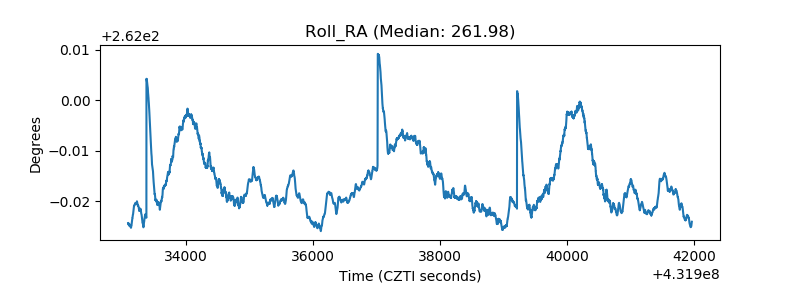 |
| Veto Counter | 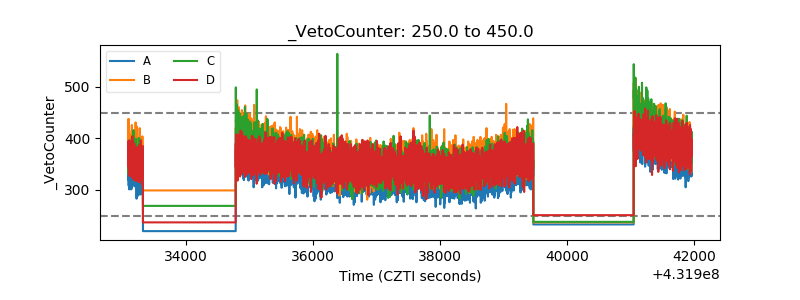 |