| Param | Original file | Final file |
|---|---|---|
| Filename | modeM0/AS1T05_148T01_9000005838_42977cztM0_level2.fits | modeM0/AS1T05_148T01_9000005838_42977cztM0_level2_quad_clean.evt |
| Size (bytes) | 482,495,040 | 111,853,440 |
| Size | 460.1 MB | 106.7 MB |
| Events in quadrant A | 3,495,721 | 867,273 |
| Events in quadrant B | 7,833,751 | 547,577 |
| Events in quadrant C | 2,953,999 | 842,137 |
| Events in quadrant D | 3,153,242 | 749,369 |
| Mode M9 | |||
|---|---|---|---|
| Quadrant | BADHDUFLAG | Total packets | Discarded packets |
| A | 0 | 30 | 0 |
| B | 0 | 31 | 0 |
| C | 0 | 31 | 0 |
| D | 0 | 31 | 0 |
| Mode SS | |||
|---|---|---|---|
| Quadrant | BADHDUFLAG | Total packets | Discarded packets |
| A | 0 | 110 | 0 |
| B | 0 | 110 | 0 |
| C | 0 | 110 | 0 |
| D | 0 | 110 | 0 |
| Mode M0 | |||
|---|---|---|---|
| Quadrant | BADHDUFLAG | Total packets | Discarded packets |
| A | 0 | 14055 | 2 |
| B | 0 | 27041 | 6 |
| C | 0 | 11806 | 2 |
| D | 0 | 12664 | 2 |
| Quadrant | Total seconds | Saturated seconds | Saturation percentage |
|---|---|---|---|
| A | 5449 | 64 | 1.174527% |
| B | 5448 | 2214 | 40.638767% |
| C | 5448 | 3 | 0.055066% |
| D | 5448 | 73 | 1.339941% |
Noise dominated data is calculated using 1-second bins in cleaned event files. If a bin has >2000 counts, and if more than 50% of those come from <1% of pixels, then it is considered to be noise-dominated and hence unusable.
| Quadrant | # 1 sec bins | Bins with >0 counts | Bins with >2000 counts | High rate bins dominated by noise | Noise dominated (total time) | Noise dominated (detector-on time) | Marked lightcurve |
|---|---|---|---|---|---|---|---|
| A | 7182 | 5450 | 29 | 29 | 0.40% | 0.53% | 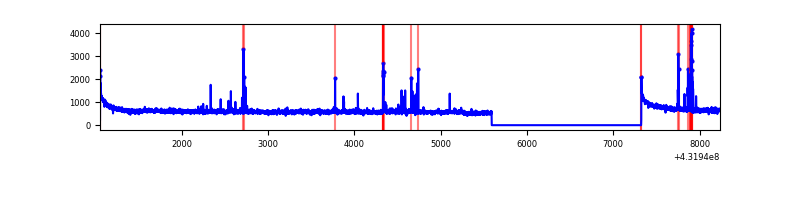 |
| B | 7181 | 5449 | 1756 | 1756 | 24.45% | 32.23% | 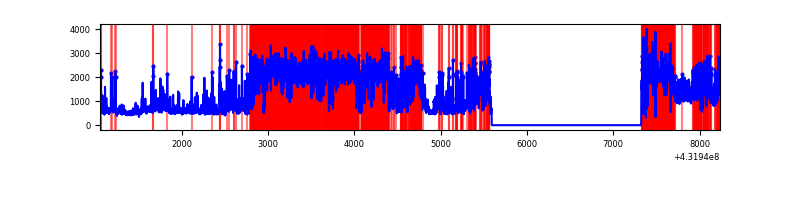 |
| C | 7181 | 5449 | 0 | 0 | 0.00% | 0.00% | 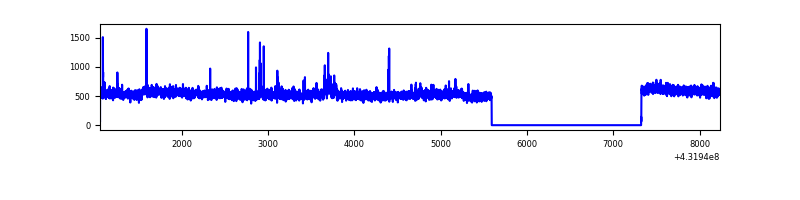 |
| D | 7181 | 5449 | 69 | 69 | 0.96% | 1.27% | 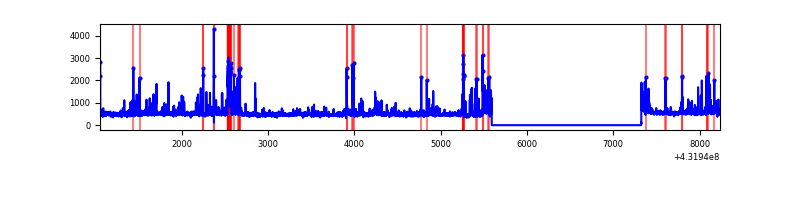 |
Top three noisy pixels from each quadrant. If the there are fewer than three noisy pixels in the level2.evt file, extra rows are filled as -1
| Pixel properties | Quadrant properties | ||||||
|---|---|---|---|---|---|---|---|
| Quadrant | DetID | PixID | Counts | Sigma | Mean | Median | Sigma |
| A | 10 | 83 | 585406 | 3501.31 | 706 | 690 | 167.0 |
| A | 15 | 237 | 102570 | 610.06 | 706 | 690 | 167.0 |
| A | 10 | 255 | 43244 | 254.82 | 706 | 690 | 167.0 |
| B | 4 | 81 | 5206275 | 41324.32 | 566 | 553 | 126.0 |
| B | 4 | 171 | 327692 | 2596.91 | 566 | 553 | 126.0 |
| B | 0 | 186 | 46716 | 366.45 | 566 | 553 | 126.0 |
| C | 15 | 214 | 225558 | 1239.17 | 686 | 690 | 181.5 |
| C | 0 | 239 | 25012 | 134.03 | 686 | 690 | 181.5 |
| C | 14 | 254 | 11983 | 62.23 | 686 | 690 | 181.5 |
| D | 12 | 6 | 118416 | 628.78 | 680 | 653 | 187.3 |
| D | 1 | 47 | 111706 | 592.95 | 680 | 653 | 187.3 |
| D | 13 | 249 | 110839 | 588.32 | 680 | 653 | 187.3 |
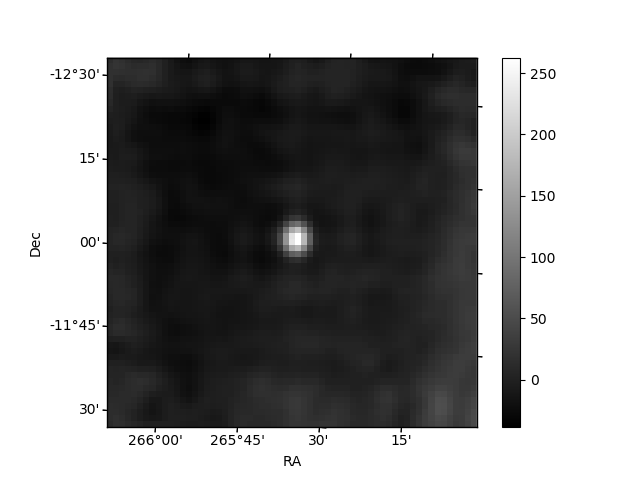
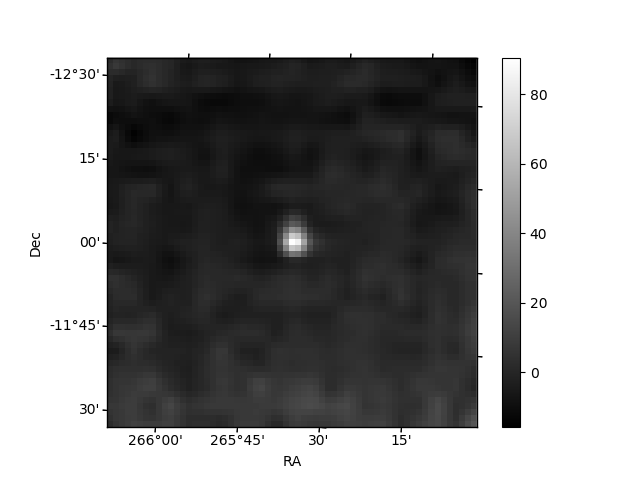
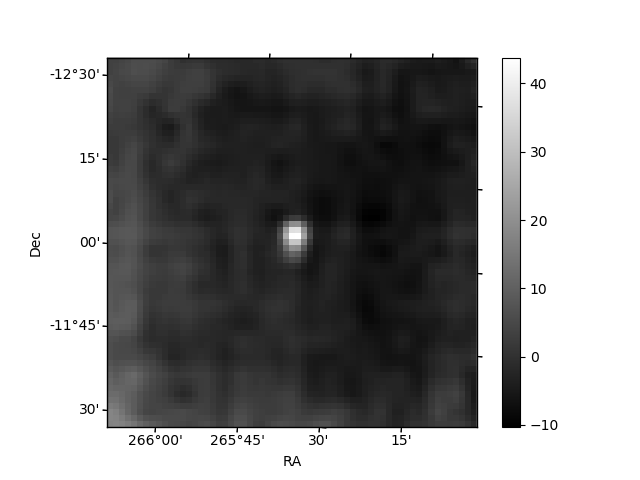
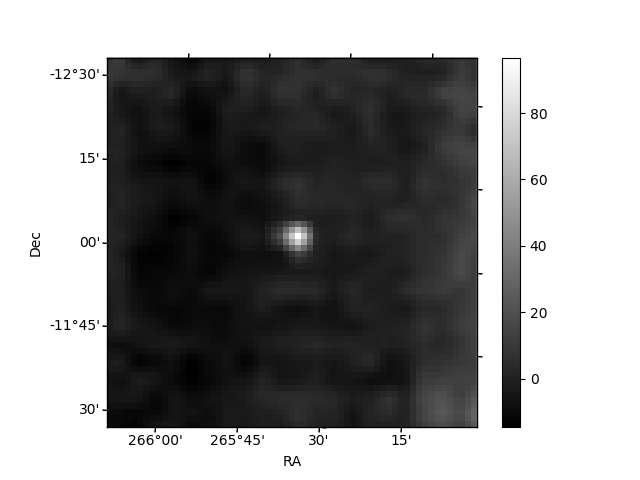
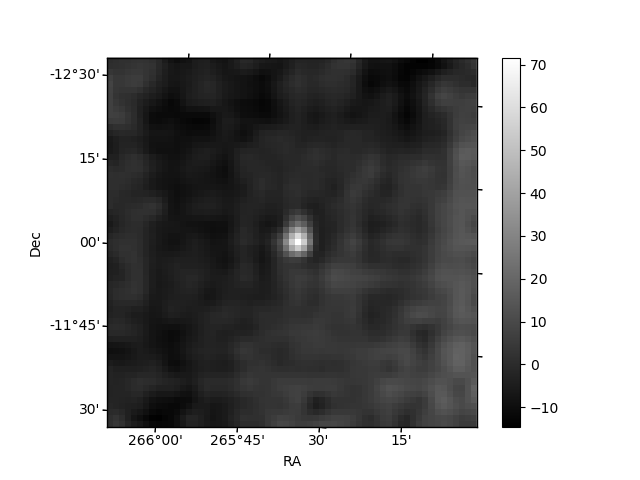
Histogram calculated using DETX and DETY for each event in the final _common_clean file
| Quadrant A | 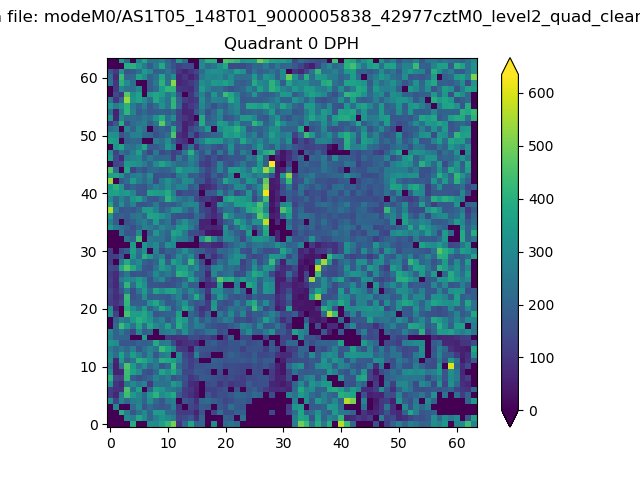 |
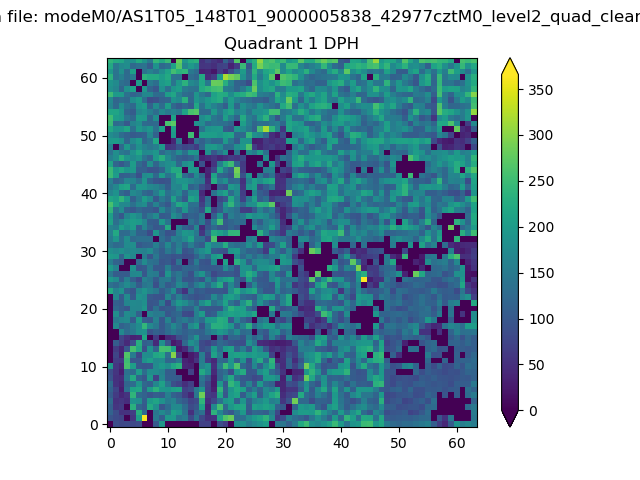 |
Quadrant B |
|---|---|---|---|
| Quadrant D | 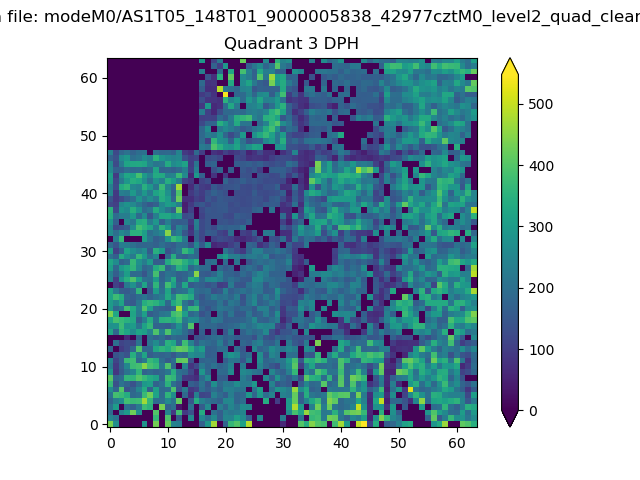 |
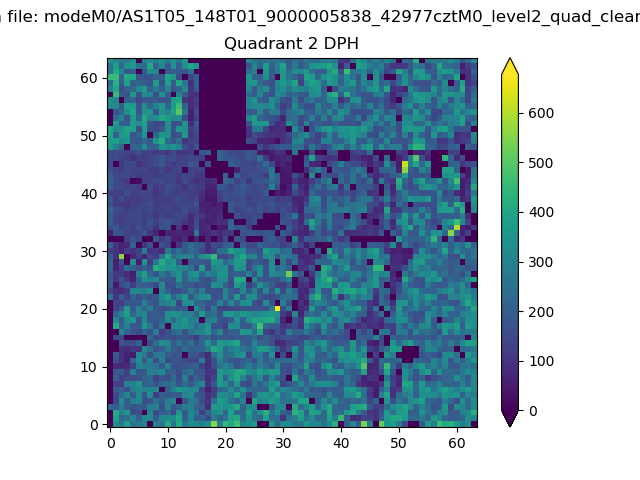 |
Quadrant C |
| Plot type | Count rate plots | Images |
|---|---|---|
| Comparison with Poisson distribution Blue bars denote a histogram of data divided into 1 sec bins. Red curve is a Poisson curve with rate = median count rate of data. |
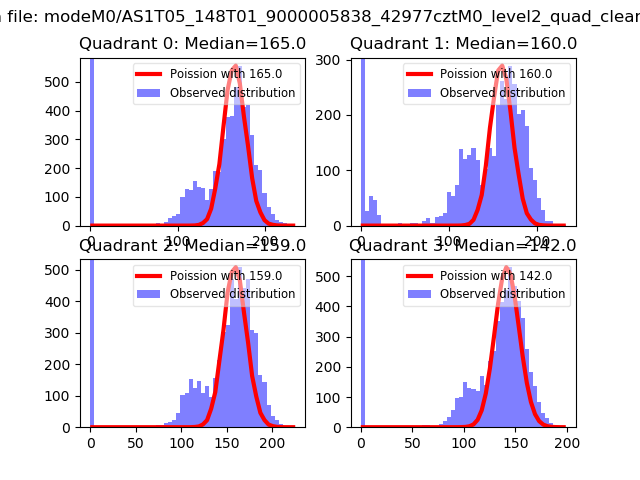 |
 |
| Quadrant-wise count rates Data is divided into 100 sec bins |
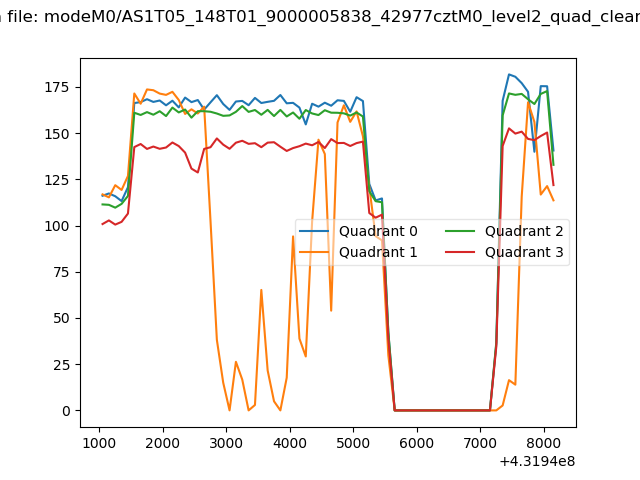 |
|
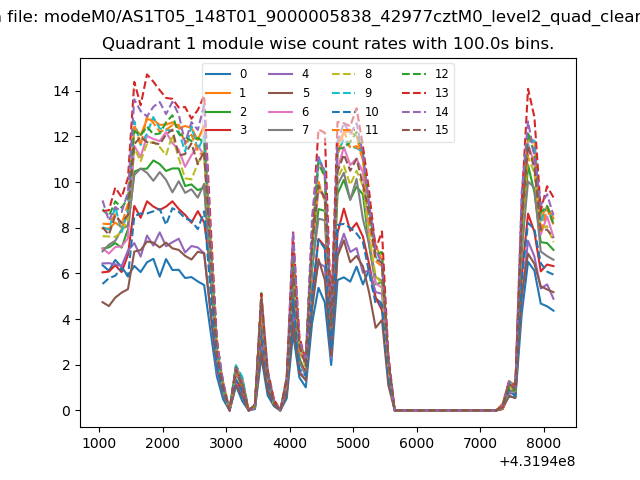
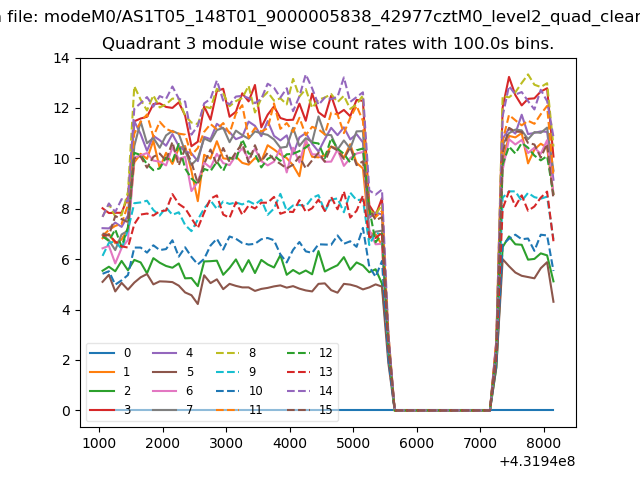
| Module-wise count rates for Quadrant A Data is divided into 100 sec bins |
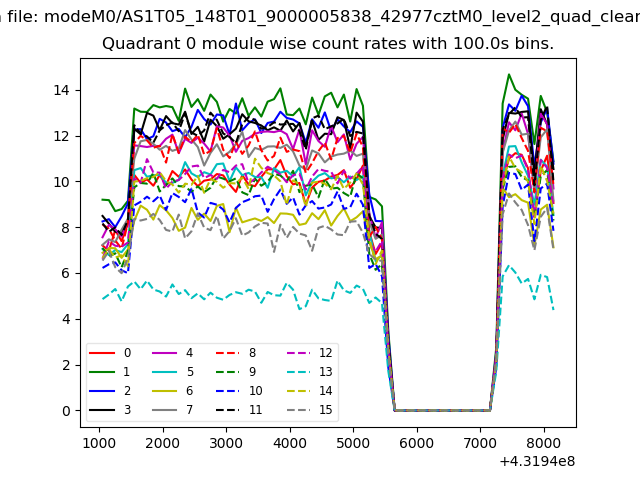 |
 |
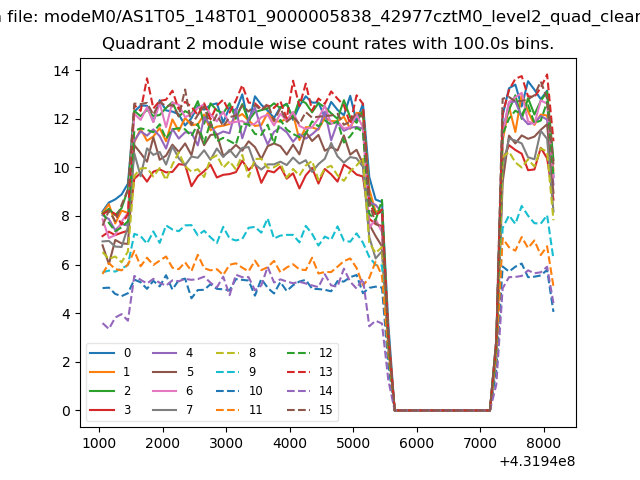
| Module-wise count rates for Quadrant B Data is divided into 100 sec bins |
 |
 |
| Module-wise count rates for Quadrant C Data is divided into 100 sec bins |
 |
 |
| Module-wise count rates for Quadrant D Data is divided into 100 sec bins |
 |
 |
| Parameter | Plot |
|---|---|
| CZT HV Monitor | 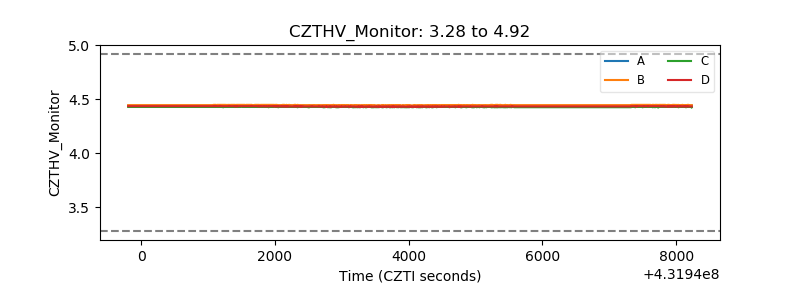 |
| D_VDD | 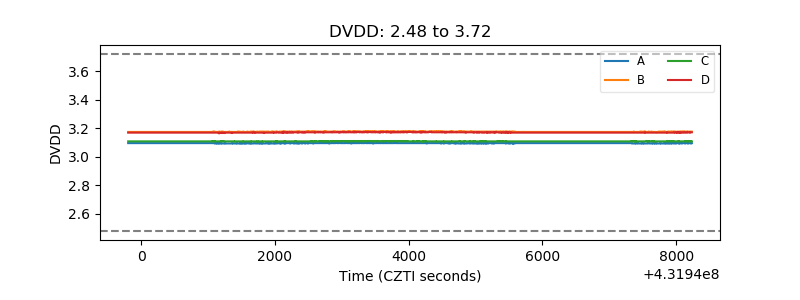 |
| Temperature 1 | 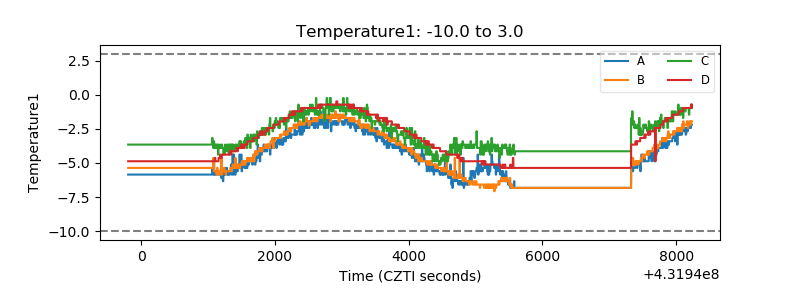 |
| Veto HV Monitor | 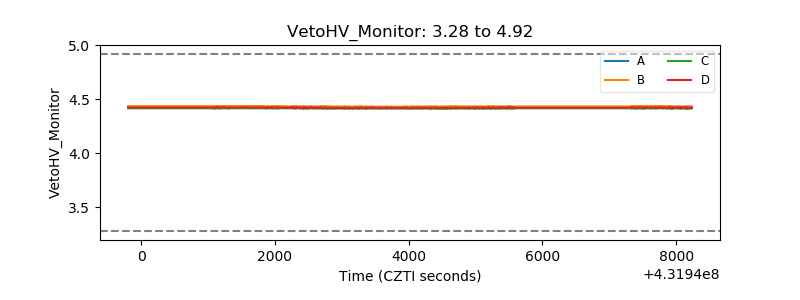 |
| Veto LLD | 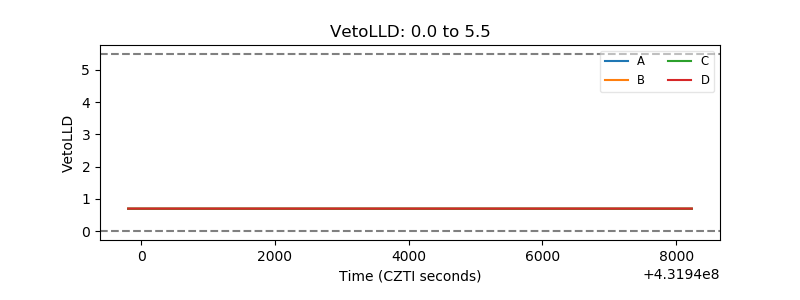 |
| Alpha Counter | 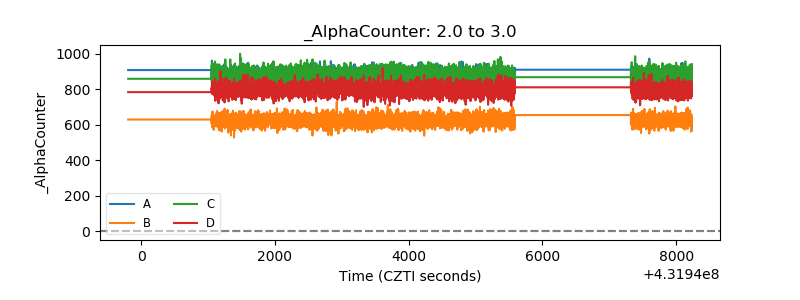 |
| _CPM_Rate | 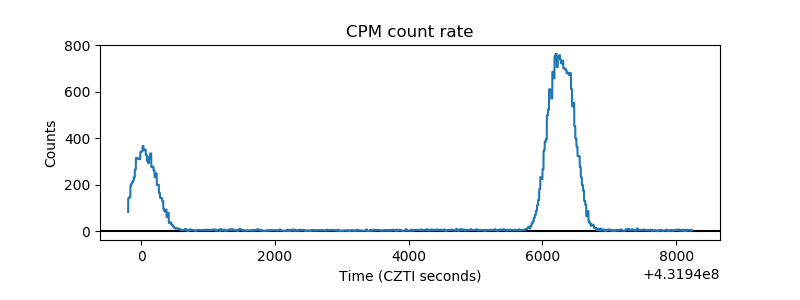 |
| CZT Counter | 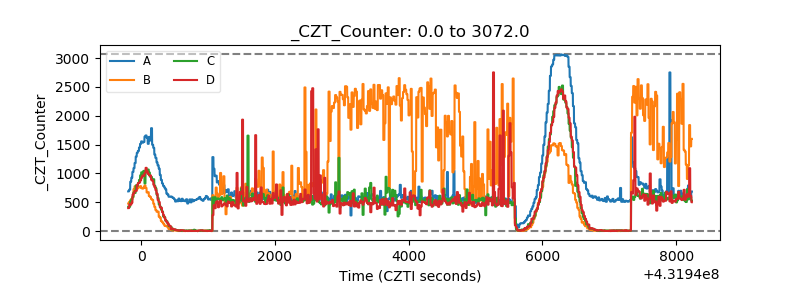 |
| +2.5 Volts monitor | 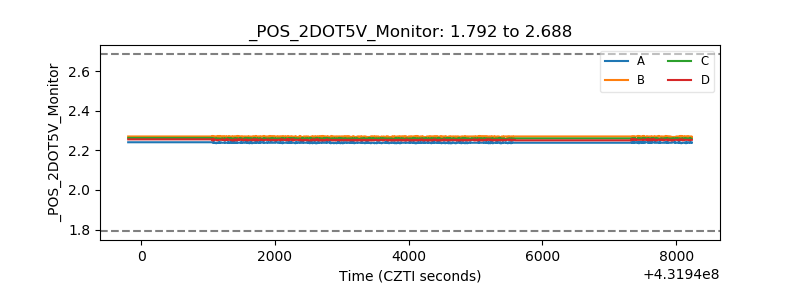 |
| +5 Volts monitor |  |
| _ROLL_ROT | 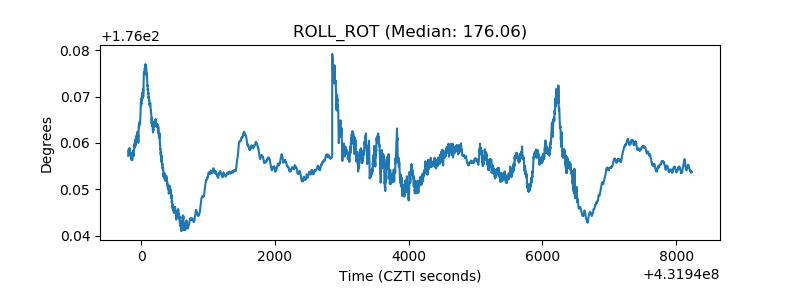 |
| _Roll_DEC | 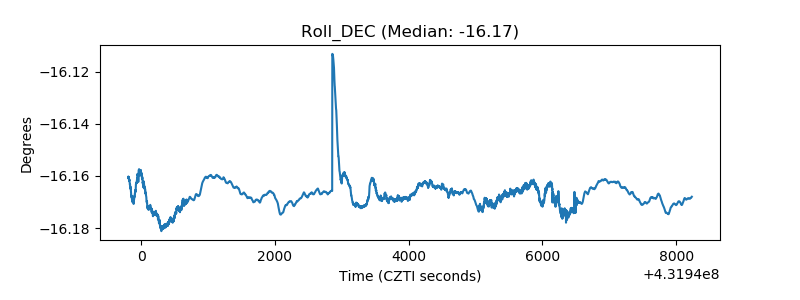 |
| _Roll_RA | 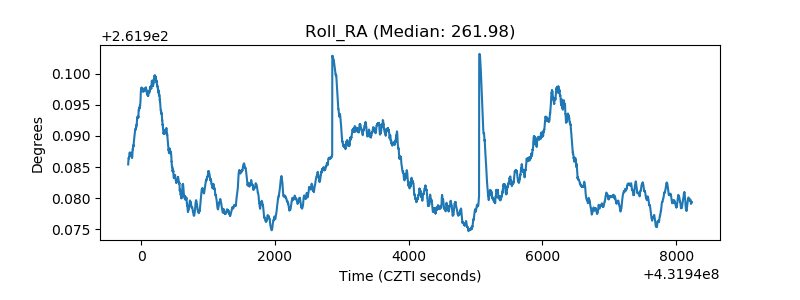 |
| Veto Counter | 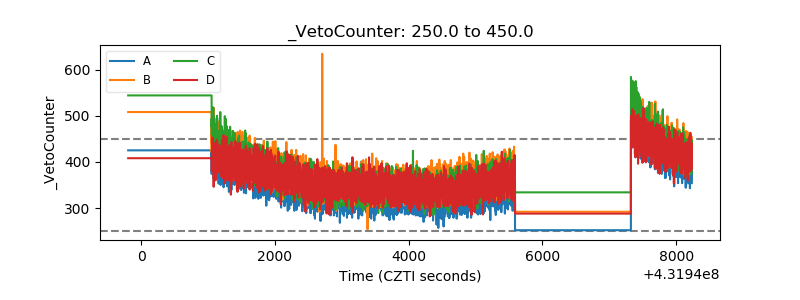 |