| Param | Original file | Final file |
|---|---|---|
| Filename | modeM0/AS1T05_148T01_9000005838_42979cztM0_level2.fits | modeM0/AS1T05_148T01_9000005838_42979cztM0_level2_quad_clean.evt |
| Size (bytes) | 586,857,600 | 102,574,080 |
| Size | 559.7 MB | 97.8 MB |
| Events in quadrant A | 3,488,665 | 886,407 |
| Events in quadrant B | 10,582,454 | 263,929 |
| Events in quadrant C | 3,016,059 | 857,206 |
| Events in quadrant D | 4,224,624 | 728,114 |
| Mode M9 | |||
|---|---|---|---|
| Quadrant | BADHDUFLAG | Total packets | Discarded packets |
| A | 0 | 28 | 0 |
| B | 0 | 29 | 0 |
| C | 0 | 29 | 0 |
| D | 0 | 29 | 0 |
| Mode SS | |||
|---|---|---|---|
| Quadrant | BADHDUFLAG | Total packets | Discarded packets |
| A | 0 | 108 | 0 |
| B | 0 | 108 | 0 |
| C | 0 | 108 | 0 |
| D | 0 | 108 | 0 |
| Mode M0 | |||
|---|---|---|---|
| Quadrant | BADHDUFLAG | Total packets | Discarded packets |
| A | 0 | 13945 | 2 |
| B | 0 | 35111 | 2 |
| C | 0 | 12196 | 2 |
| D | 0 | 16024 | 2 |
| Quadrant | Total seconds | Saturated seconds | Saturation percentage |
|---|---|---|---|
| A | 5296 | 66 | 1.246224% |
| B | 5295 | 3857 | 72.842304% |
| C | 5295 | 19 | 0.358829% |
| D | 5295 | 366 | 6.912181% |
Noise dominated data is calculated using 1-second bins in cleaned event files. If a bin has >2000 counts, and if more than 50% of those come from <1% of pixels, then it is considered to be noise-dominated and hence unusable.
| Quadrant | # 1 sec bins | Bins with >0 counts | Bins with >2000 counts | High rate bins dominated by noise | Noise dominated (total time) | Noise dominated (detector-on time) | Marked lightcurve |
|---|---|---|---|---|---|---|---|
| A | 7119 | 5297 | 34 | 34 | 0.48% | 0.64% | 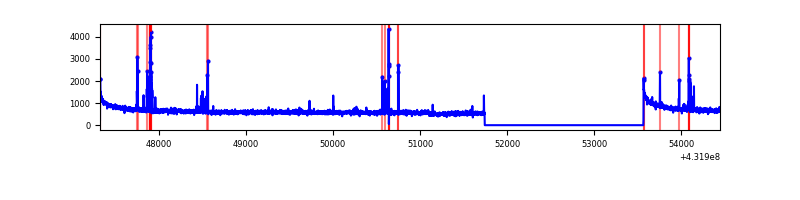 |
| B | 7118 | 5296 | 2983 | 2983 | 41.91% | 56.33% | 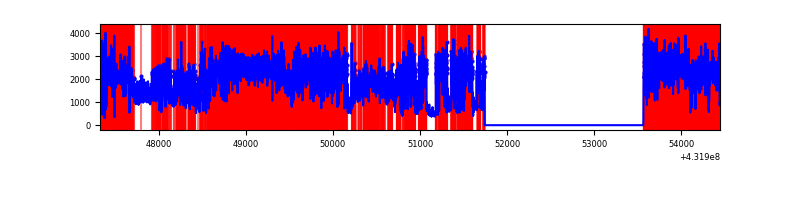 |
| C | 7118 | 5296 | 16 | 16 | 0.22% | 0.30% | 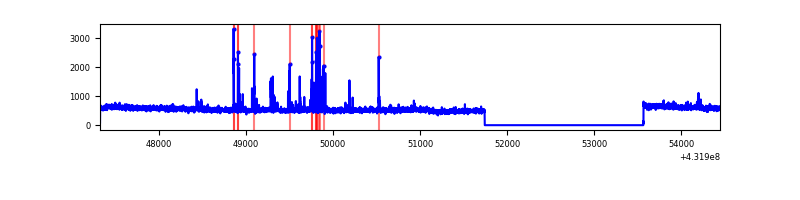 |
| D | 7118 | 5296 | 354 | 354 | 4.97% | 6.68% | 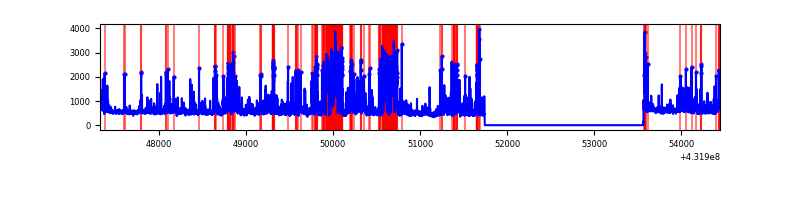 |
Top three noisy pixels from each quadrant. If the there are fewer than three noisy pixels in the level2.evt file, extra rows are filled as -1
| Pixel properties | Quadrant properties | ||||||
|---|---|---|---|---|---|---|---|
| Quadrant | DetID | PixID | Counts | Sigma | Mean | Median | Sigma |
| A | 10 | 83 | 585235 | 3549.02 | 706 | 691 | 164.7 |
| A | 15 | 237 | 148483 | 897.31 | 706 | 691 | 164.7 |
| A | 15 | 222 | 15200 | 88.09 | 706 | 691 | 164.7 |
| B | 4 | 81 | 8513251 | 95285.36 | 395 | 385 | 89.3 |
| B | 4 | 171 | 388708 | 4346.54 | 395 | 385 | 89.3 |
| B | 0 | 186 | 63995 | 711.99 | 395 | 385 | 89.3 |
| C | 15 | 214 | 216921 | 1193.78 | 681 | 684 | 181.1 |
| C | 14 | 254 | 119970 | 658.54 | 681 | 684 | 181.1 |
| C | 7 | 173 | 8968 | 45.73 | 681 | 684 | 181.1 |
| D | 13 | 249 | 1054404 | 5705.65 | 662 | 636 | 184.7 |
| D | 1 | 52 | 225309 | 1216.5 | 662 | 636 | 184.7 |
| D | 12 | 6 | 109998 | 592.14 | 662 | 636 | 184.7 |
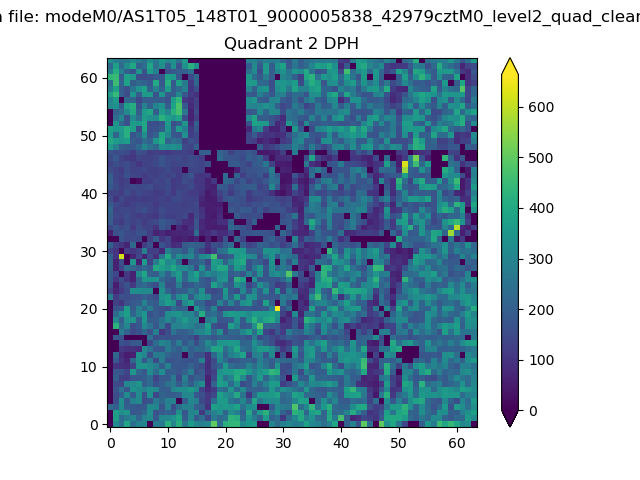
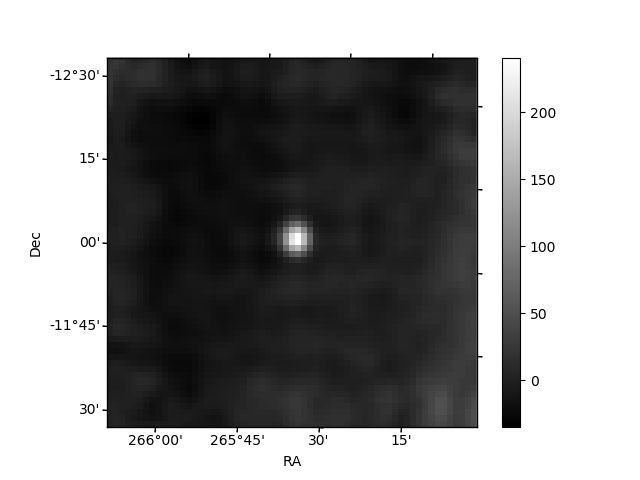
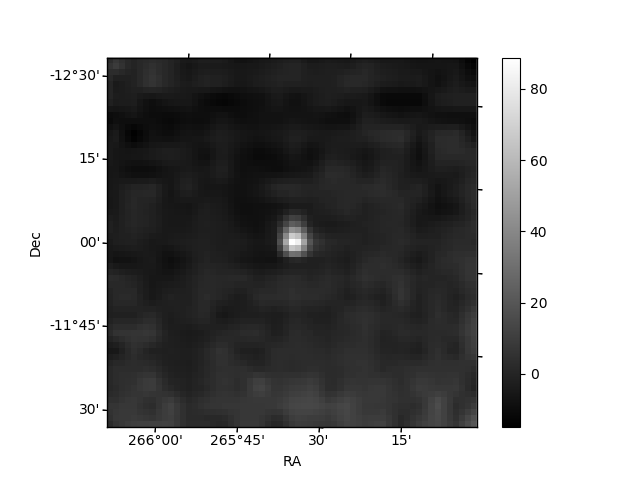
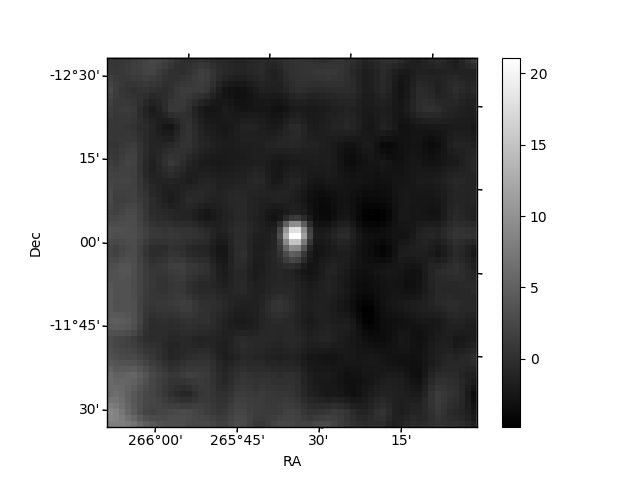
Histogram calculated using DETX and DETY for each event in the final _common_clean file
| Quadrant A | 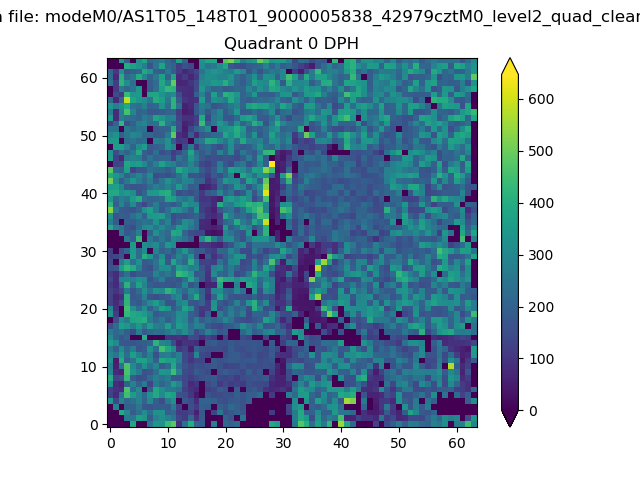 |
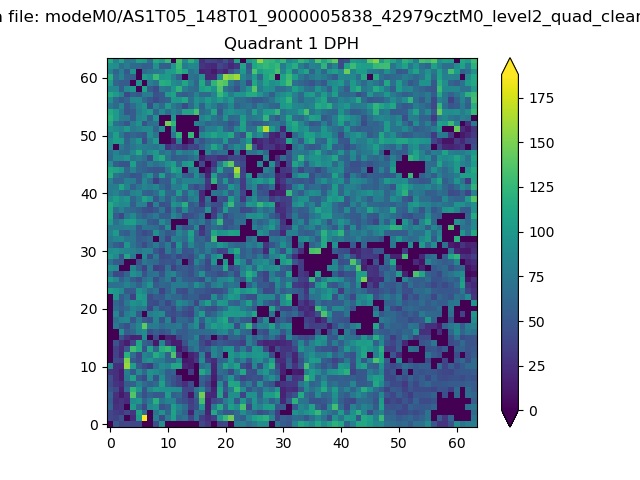 |
Quadrant B |
|---|---|---|---|
| Quadrant D | 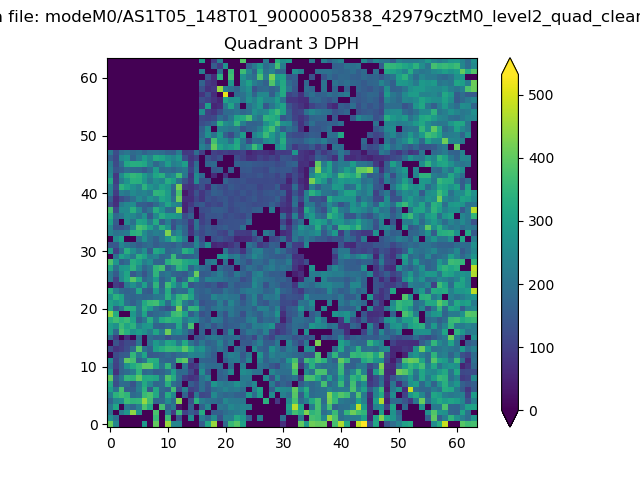 |
 |
Quadrant C |
| Plot type | Count rate plots | Images |
|---|---|---|
| Comparison with Poisson distribution Blue bars denote a histogram of data divided into 1 sec bins. Red curve is a Poisson curve with rate = median count rate of data. |
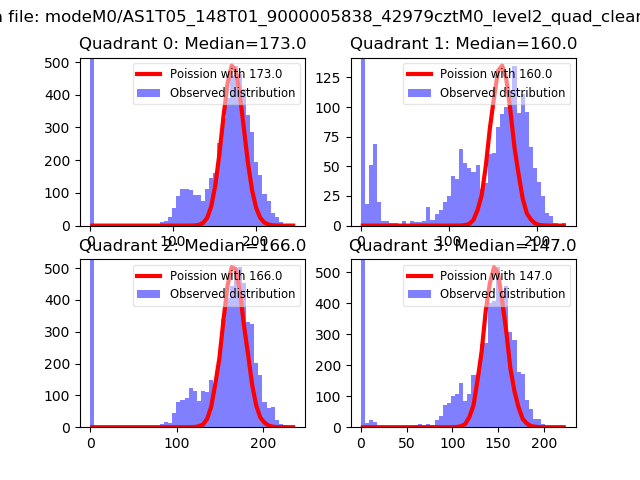 |
 |
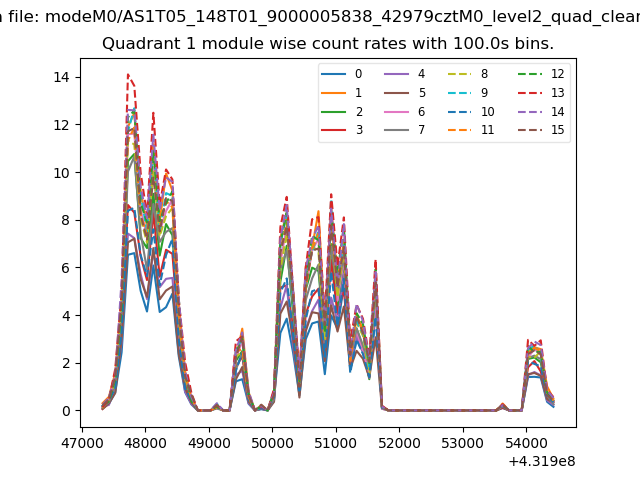
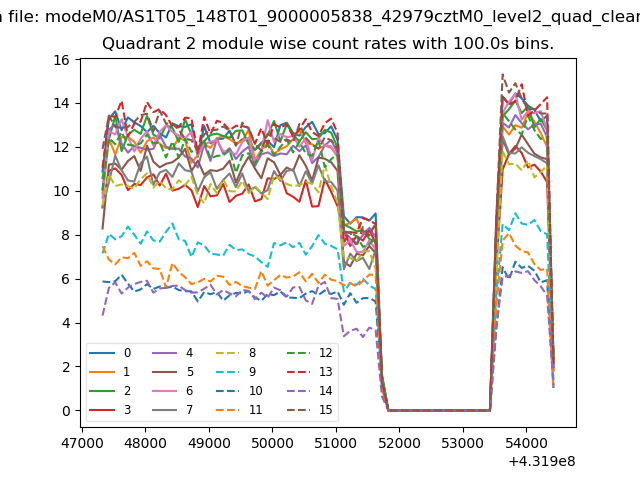
| Quadrant-wise count rates Data is divided into 100 sec bins |
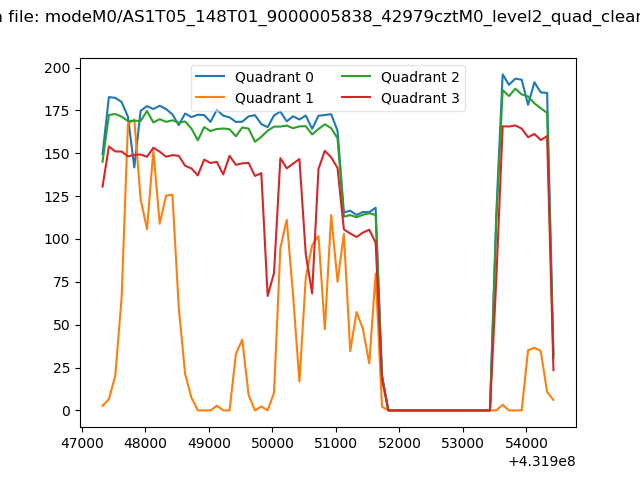 |
|
| Module-wise count rates for Quadrant A Data is divided into 100 sec bins |
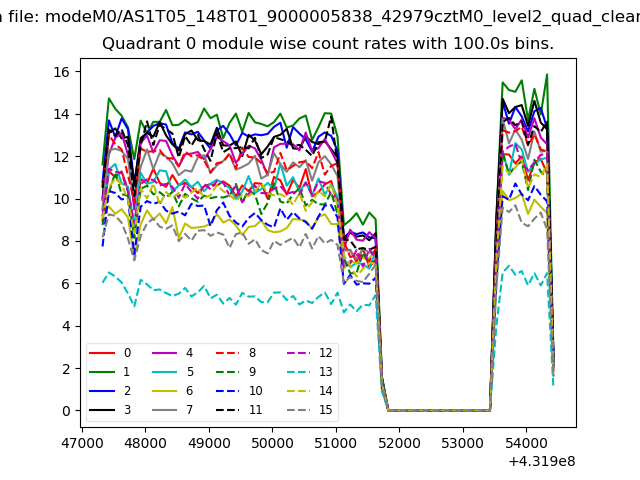 |
 |
| Module-wise count rates for Quadrant B Data is divided into 100 sec bins |
 |
 |
| Module-wise count rates for Quadrant C Data is divided into 100 sec bins |
 |
 |
| Module-wise count rates for Quadrant D Data is divided into 100 sec bins |
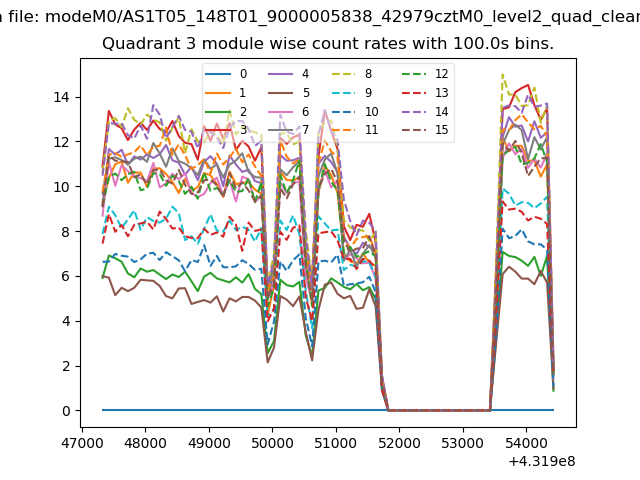 |
 |
| Parameter | Plot |
|---|---|
| CZT HV Monitor | 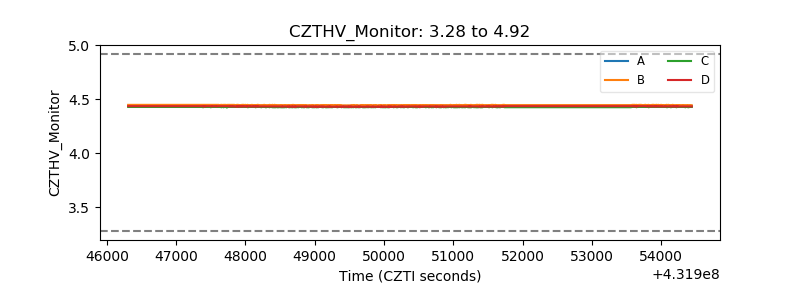 |
| D_VDD | 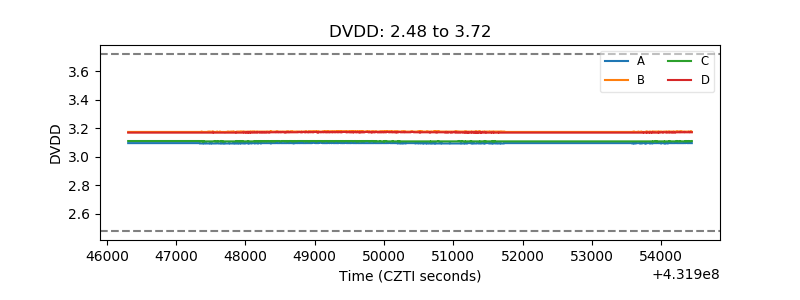 |
| Temperature 1 | 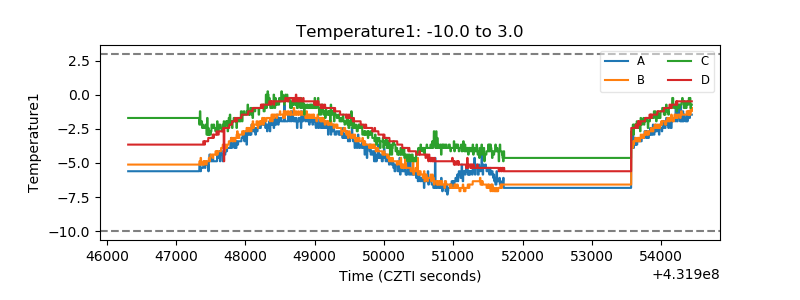 |
| Veto HV Monitor | 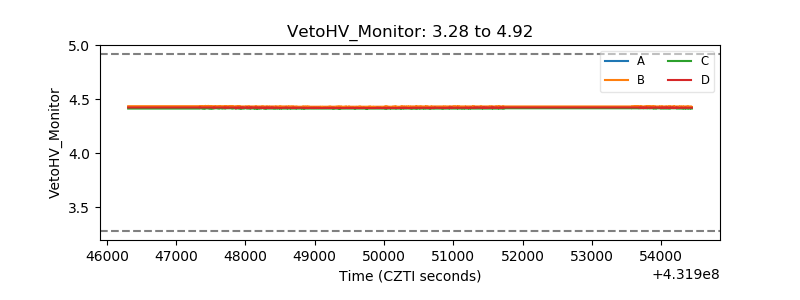 |
| Veto LLD | 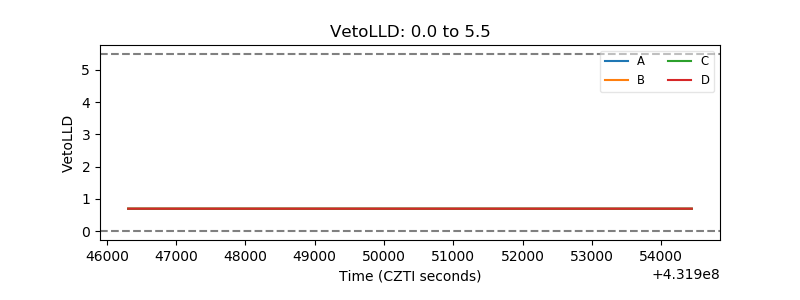 |
| Alpha Counter | 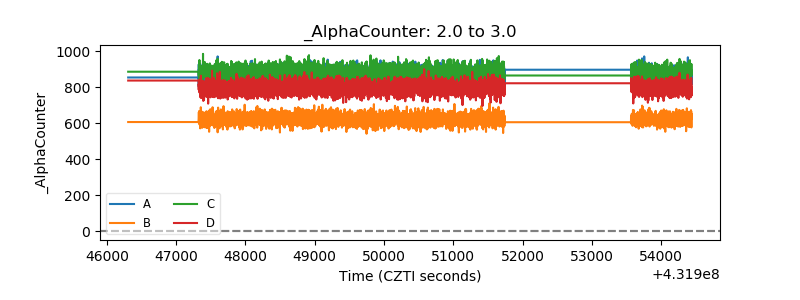 |
| _CPM_Rate | 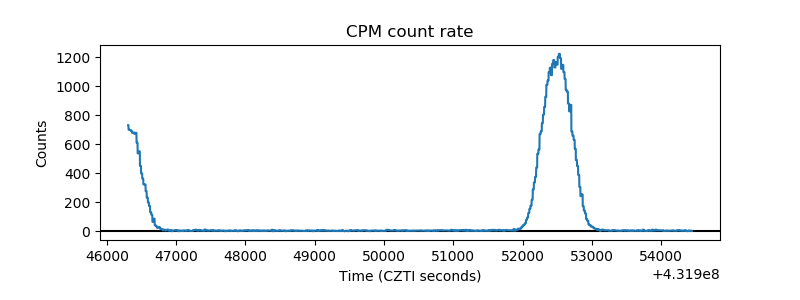 |
| CZT Counter | 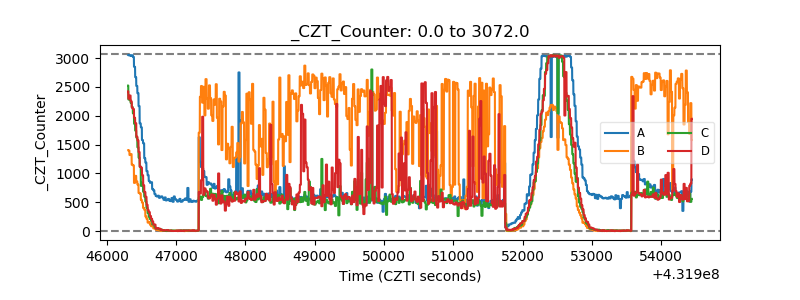 |
| +2.5 Volts monitor | 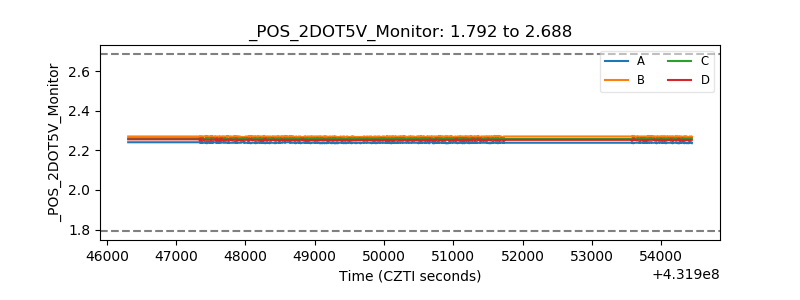 |
| +5 Volts monitor |  |
| _ROLL_ROT | 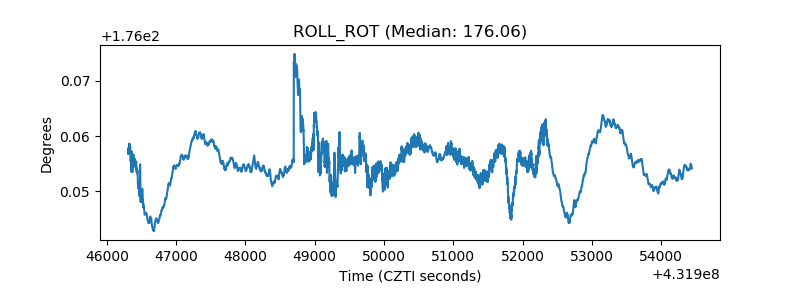 |
| _Roll_DEC | 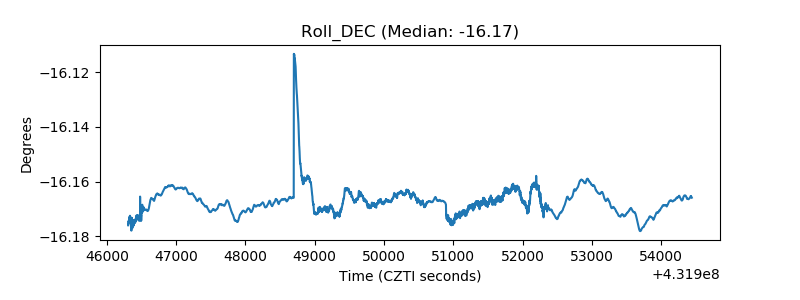 |
| _Roll_RA | 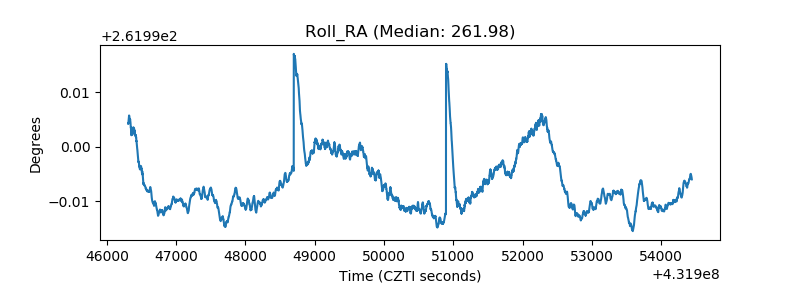 |
| Veto Counter | 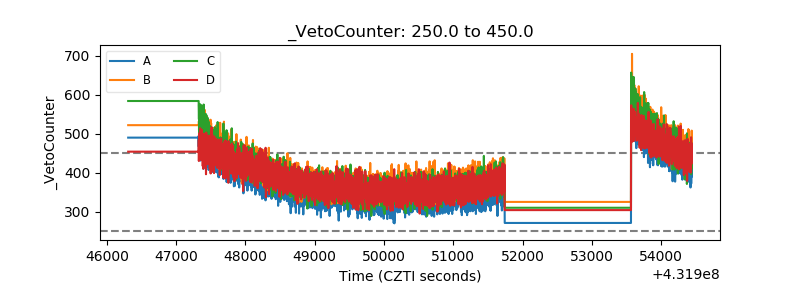 |