| Param | Original file | Final file |
|---|---|---|
| Filename | modeM0/AS1T05_148T01_9000005838_42980cztM0_level2.fits | modeM0/AS1T05_148T01_9000005838_42980cztM0_level2_quad_clean.evt |
| Size (bytes) | 475,565,760 | 109,601,280 |
| Size | 453.5 MB | 104.5 MB |
| Events in quadrant A | 3,403,228 | 859,899 |
| Events in quadrant B | 6,657,758 | 580,721 |
| Events in quadrant C | 2,800,658 | 832,022 |
| Events in quadrant D | 4,346,172 | 690,231 |
| Mode M9 | |||
|---|---|---|---|
| Quadrant | BADHDUFLAG | Total packets | Discarded packets |
| A | 0 | 20 | 0 |
| B | 0 | 20 | 0 |
| C | 0 | 20 | 0 |
| D | 0 | 20 | 0 |
| Mode SS | |||
|---|---|---|---|
| Quadrant | BADHDUFLAG | Total packets | Discarded packets |
| A | 0 | 102 | 0 |
| B | 0 | 102 | 0 |
| C | 0 | 102 | 0 |
| D | 0 | 102 | 0 |
| Mode M0 | |||
|---|---|---|---|
| Quadrant | BADHDUFLAG | Total packets | Discarded packets |
| A | 0 | 13770 | 1 |
| B | 0 | 23263 | 1 |
| C | 0 | 11345 | 1 |
| D | 0 | 16332 | 1 |
| Quadrant | Total seconds | Saturated seconds | Saturation percentage |
|---|---|---|---|
| A | 5091 | 91 | 1.787468% |
| B | 5092 | 1744 | 34.249804% |
| C | 5092 | 5 | 0.098193% |
| D | 5092 | 494 | 9.701493% |
Noise dominated data is calculated using 1-second bins in cleaned event files. If a bin has >2000 counts, and if more than 50% of those come from <1% of pixels, then it is considered to be noise-dominated and hence unusable.
| Quadrant | # 1 sec bins | Bins with >0 counts | Bins with >2000 counts | High rate bins dominated by noise | Noise dominated (total time) | Noise dominated (detector-on time) | Marked lightcurve |
|---|---|---|---|---|---|---|---|
| A | 7065 | 5092 | 59 | 59 | 0.84% | 1.16% | 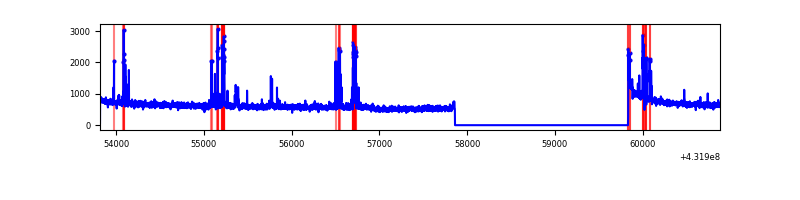 |
| B | 7066 | 5093 | 1440 | 1440 | 20.38% | 28.27% | 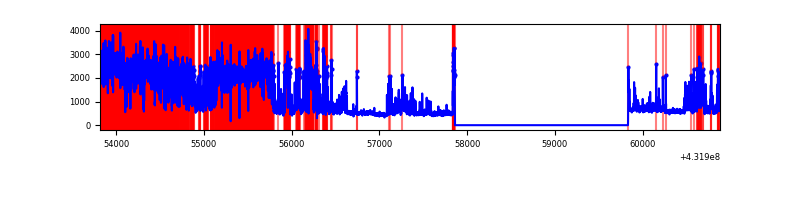 |
| C | 7066 | 5093 | 2 | 2 | 0.03% | 0.04% | 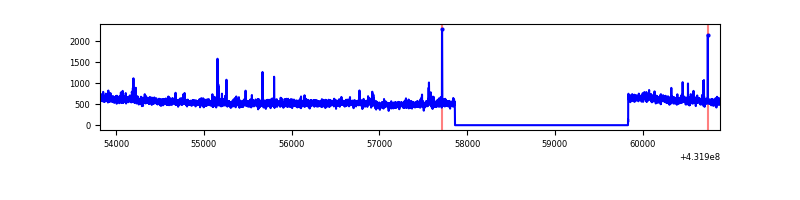 |
| D | 7066 | 5093 | 431 | 431 | 6.10% | 8.46% | 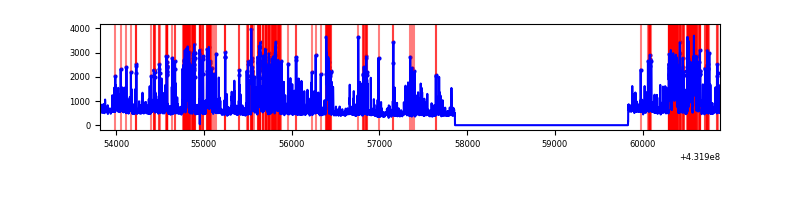 |
Top three noisy pixels from each quadrant. If the there are fewer than three noisy pixels in the level2.evt file, extra rows are filled as -1
| Pixel properties | Quadrant properties | ||||||
|---|---|---|---|---|---|---|---|
| Quadrant | DetID | PixID | Counts | Sigma | Mean | Median | Sigma |
| A | 10 | 83 | 518448 | 3289.14 | 678 | 664 | 157.4 |
| A | 15 | 237 | 220229 | 1394.75 | 678 | 664 | 157.4 |
| A | 7 | 3 | 15622 | 95.02 | 678 | 664 | 157.4 |
| B | 4 | 81 | 3028260 | 25912.59 | 532 | 519 | 116.8 |
| B | 4 | 171 | 1417682 | 12128.63 | 532 | 519 | 116.8 |
| B | 5 | 255 | 36970 | 311.96 | 532 | 519 | 116.8 |
| C | 15 | 214 | 205059 | 1186.68 | 654 | 658 | 172.2 |
| C | 14 | 254 | 36810 | 209.89 | 654 | 658 | 172.2 |
| C | 7 | 220 | 10376 | 56.42 | 654 | 658 | 172.2 |
| D | 13 | 249 | 1458569 | 8521.88 | 625 | 602 | 171.1 |
| D | 1 | 52 | 216079 | 1259.47 | 625 | 602 | 171.1 |
| D | 1 | 47 | 108560 | 631.02 | 625 | 602 | 171.1 |
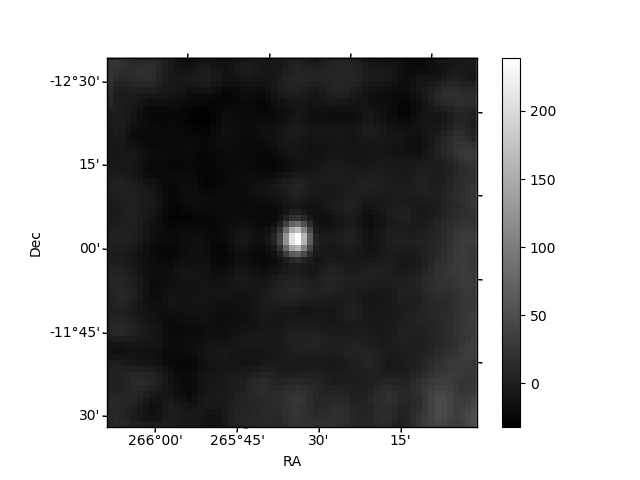
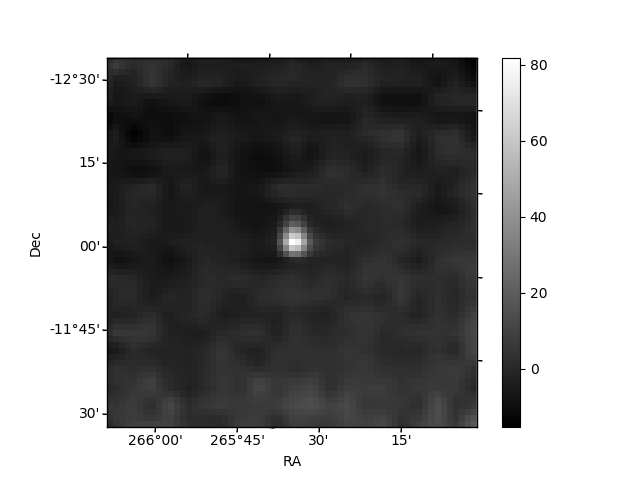
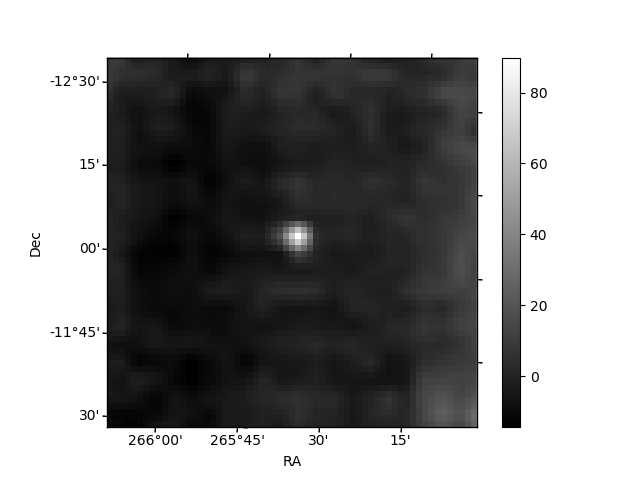
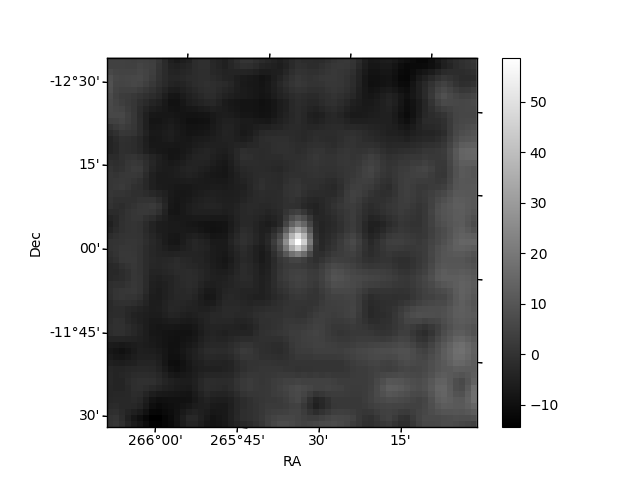
Histogram calculated using DETX and DETY for each event in the final _common_clean file
| Quadrant A | 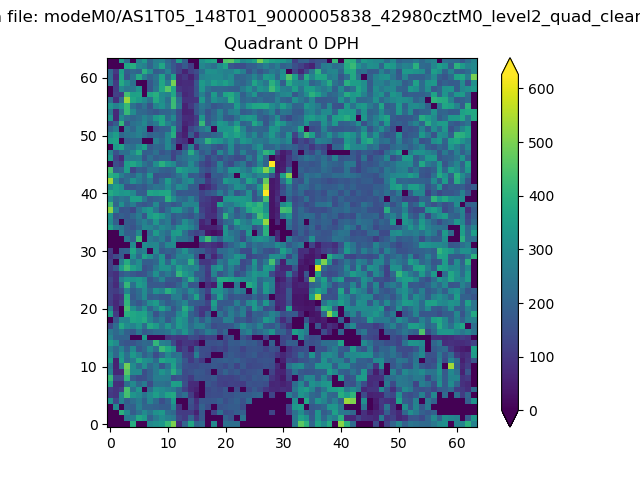 |
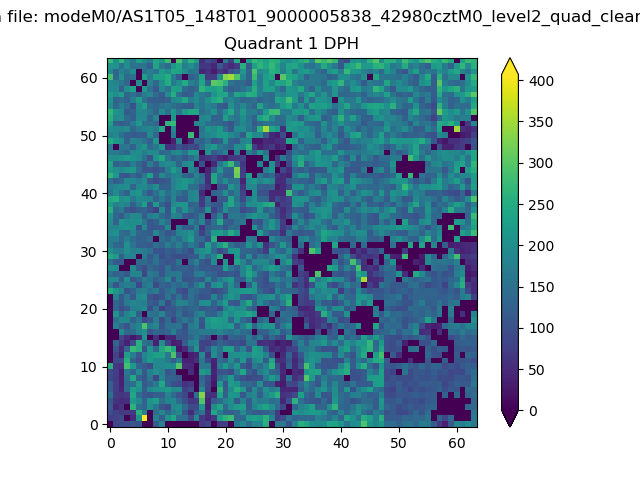 |
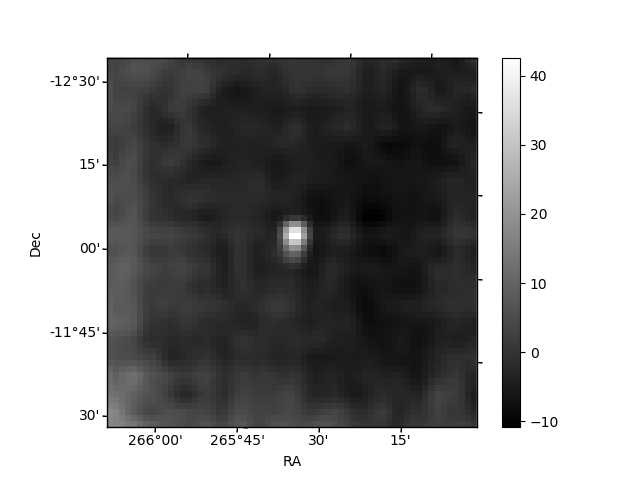
Quadrant B |
|---|---|---|---|
| Quadrant D | 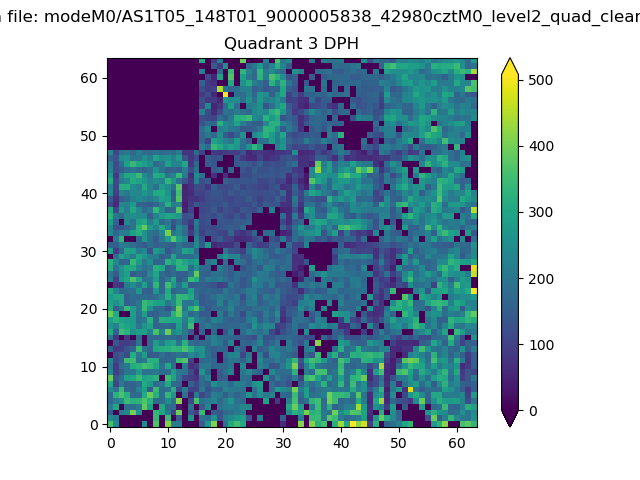 |
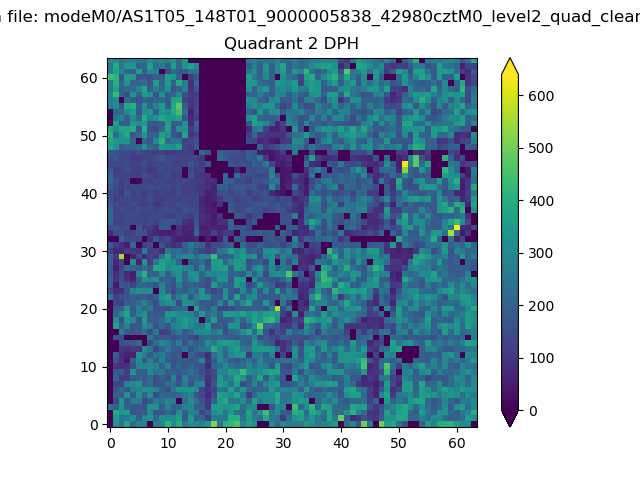 |
Quadrant C |
| Plot type | Count rate plots | Images |
|---|---|---|
| Comparison with Poisson distribution Blue bars denote a histogram of data divided into 1 sec bins. Red curve is a Poisson curve with rate = median count rate of data. |
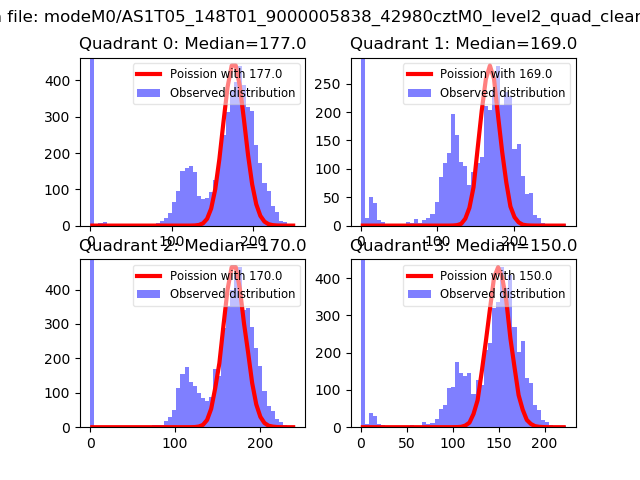 |
 |
| Quadrant-wise count rates Data is divided into 100 sec bins |
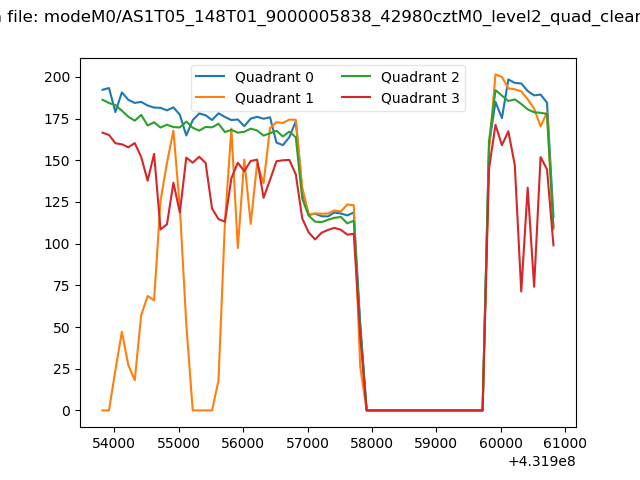 |
|
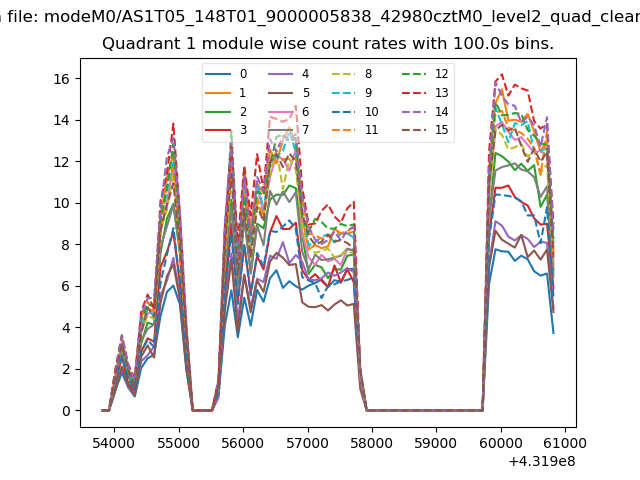
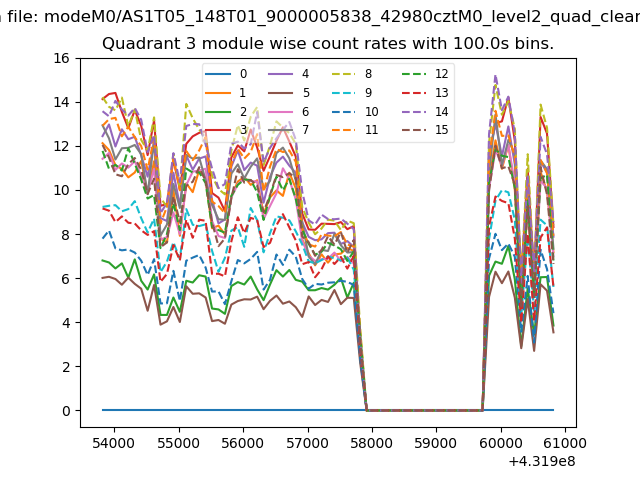
| Module-wise count rates for Quadrant A Data is divided into 100 sec bins |
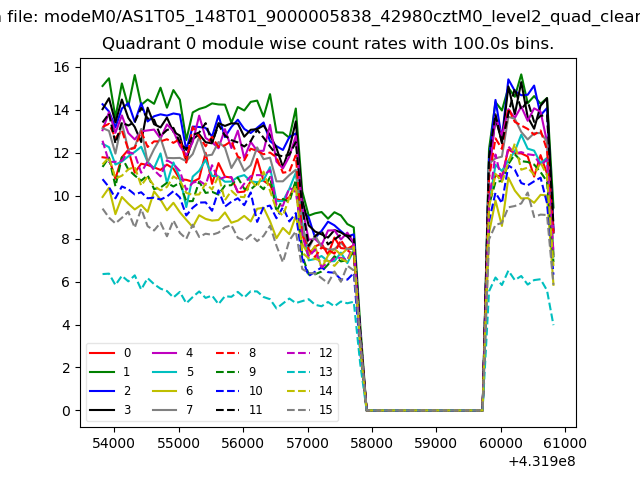 |
 |
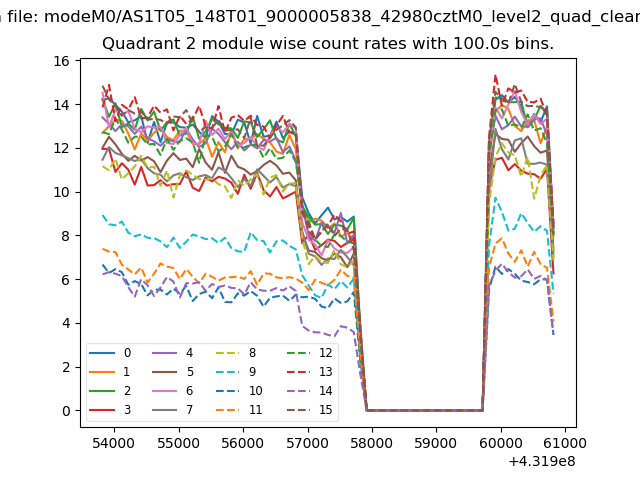
| Module-wise count rates for Quadrant B Data is divided into 100 sec bins |
 |
 |
| Module-wise count rates for Quadrant C Data is divided into 100 sec bins |
 |
 |
| Module-wise count rates for Quadrant D Data is divided into 100 sec bins |
 |
 |
| Parameter | Plot |
|---|---|
| CZT HV Monitor |  |
| D_VDD | 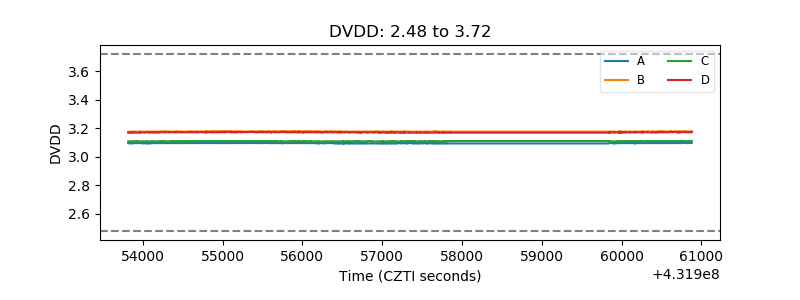 |
| Temperature 1 | 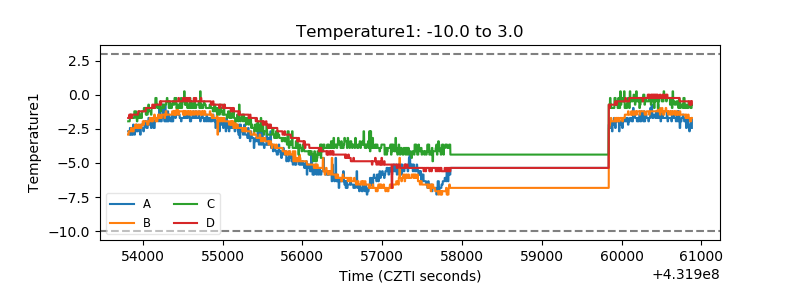 |
| Veto HV Monitor | 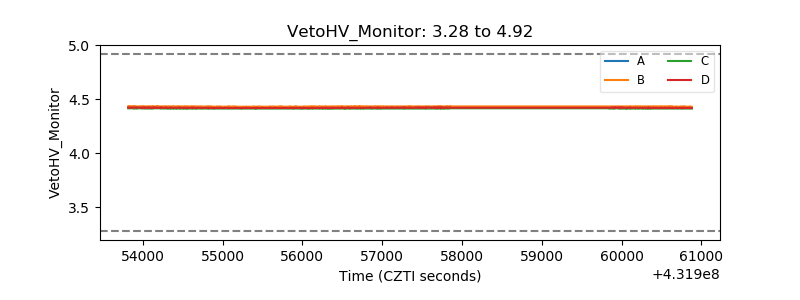 |
| Veto LLD | 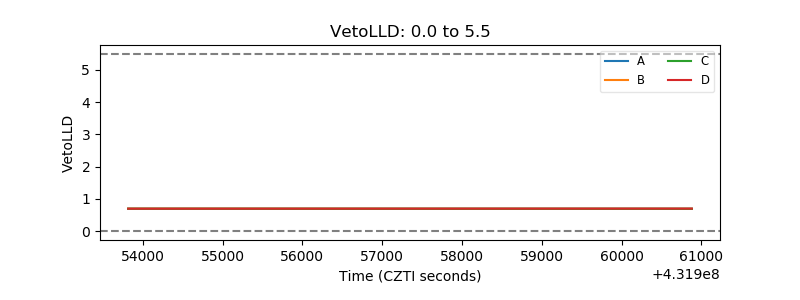 |
| Alpha Counter | 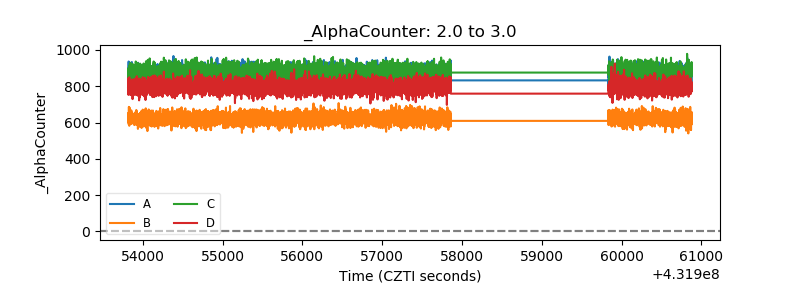 |
| _CPM_Rate | 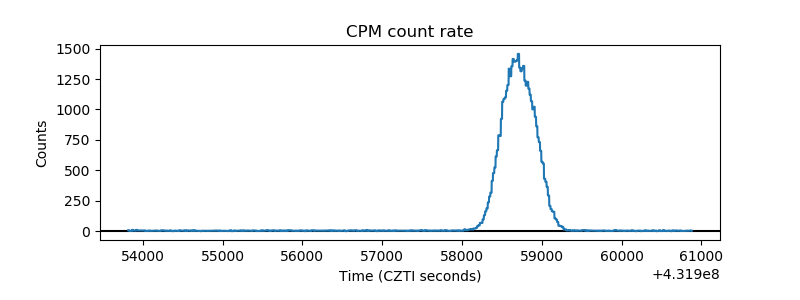 |
| CZT Counter | 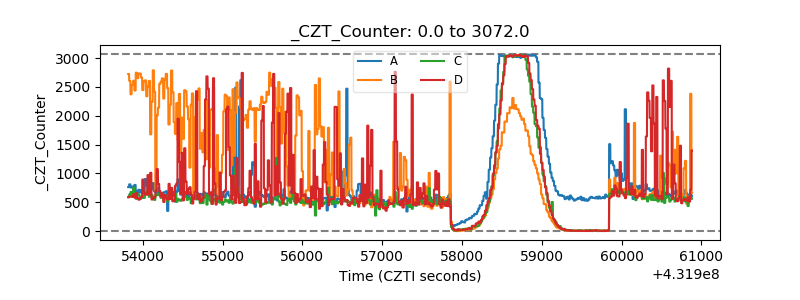 |
| +2.5 Volts monitor | 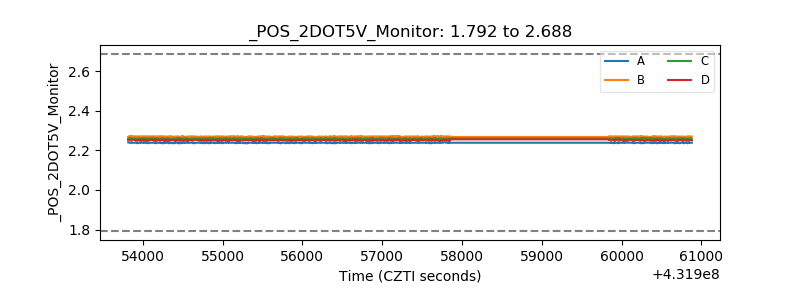 |
| +5 Volts monitor | 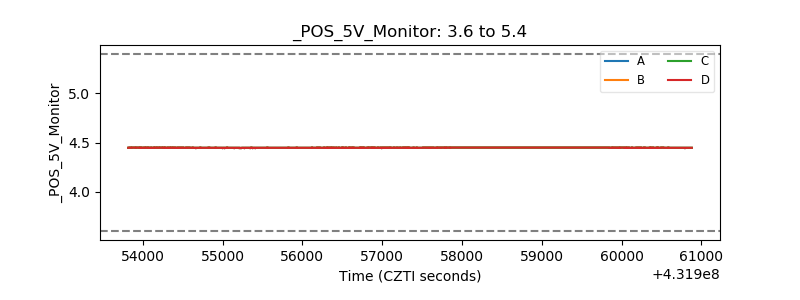 |
| _ROLL_ROT | 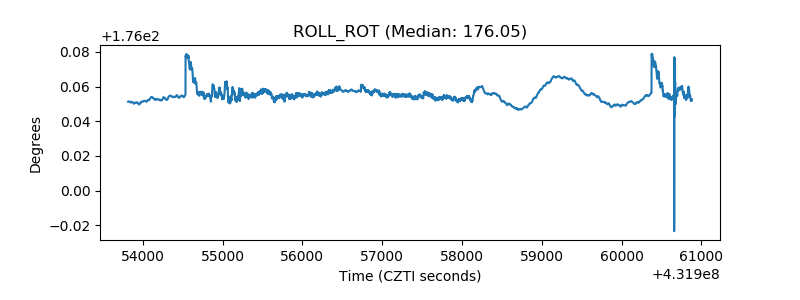 |
| _Roll_DEC | 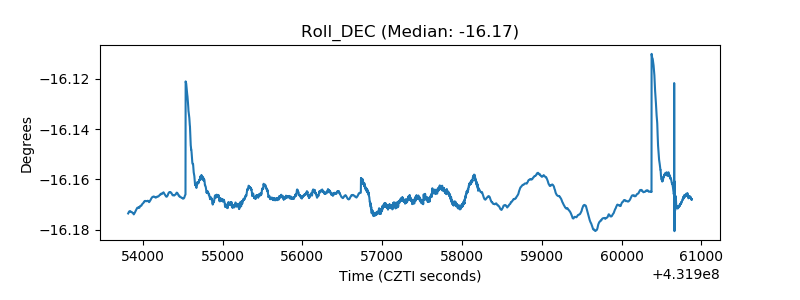 |
| _Roll_RA | 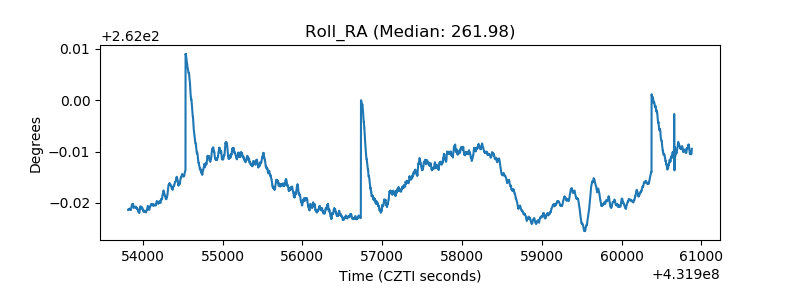 |
| Veto Counter | 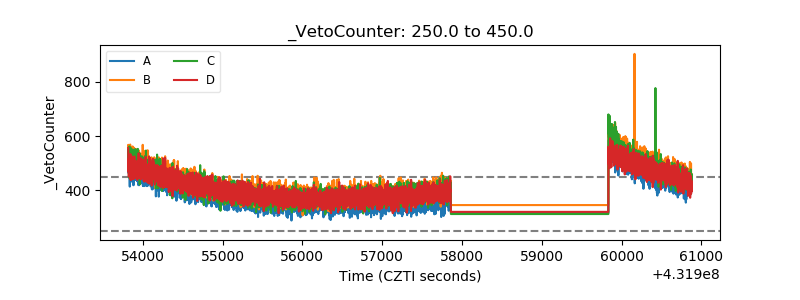 |