| Param | Original file | Final file |
|---|---|---|
| Filename | modeM0/AS1T05_148T01_9000005838_42981cztM0_level2.fits | modeM0/AS1T05_148T01_9000005838_42981cztM0_level2_quad_clean.evt |
| Size (bytes) | 414,014,400 | 111,006,720 |
| Size | 394.8 MB | 105.9 MB |
| Events in quadrant A | 3,392,321 | 819,291 |
| Events in quadrant B | 4,263,302 | 755,894 |
| Events in quadrant C | 2,675,114 | 796,703 |
| Events in quadrant D | 4,607,862 | 640,643 |
| Mode M9 | |||
|---|---|---|---|
| Quadrant | BADHDUFLAG | Total packets | Discarded packets |
| A | 0 | 20 | 0 |
| B | 0 | 20 | 0 |
| C | 0 | 20 | 0 |
| D | 0 | 20 | 0 |
| Mode SS | |||
|---|---|---|---|
| Quadrant | BADHDUFLAG | Total packets | Discarded packets |
| A | 0 | 104 | 0 |
| B | 0 | 104 | 0 |
| C | 0 | 104 | 0 |
| D | 0 | 104 | 0 |
| Mode M0 | |||
|---|---|---|---|
| Quadrant | BADHDUFLAG | Total packets | Discarded packets |
| A | 0 | 13426 | 1 |
| B | 0 | 16054 | 1 |
| C | 0 | 10794 | 1 |
| D | 0 | 17015 | 1 |
| Quadrant | Total seconds | Saturated seconds | Saturation percentage |
|---|---|---|---|
| A | 4975 | 136 | 2.733668% |
| B | 4976 | 488 | 9.807074% |
| C | 4976 | 5 | 0.100482% |
| D | 4976 | 632 | 12.700965% |
Noise dominated data is calculated using 1-second bins in cleaned event files. If a bin has >2000 counts, and if more than 50% of those come from <1% of pixels, then it is considered to be noise-dominated and hence unusable.
| Quadrant | # 1 sec bins | Bins with >0 counts | Bins with >2000 counts | High rate bins dominated by noise | Noise dominated (total time) | Noise dominated (detector-on time) | Marked lightcurve |
|---|---|---|---|---|---|---|---|
| A | 7037 | 4976 | 104 | 104 | 1.48% | 2.09% | 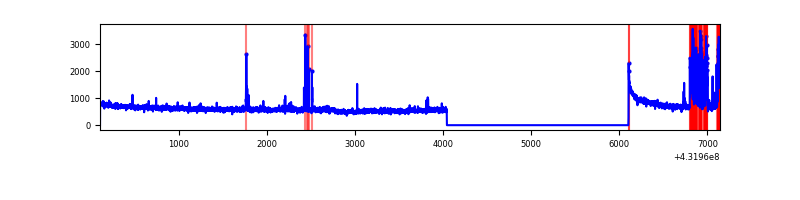 |
| B | 7038 | 4977 | 412 | 412 | 5.85% | 8.28% | 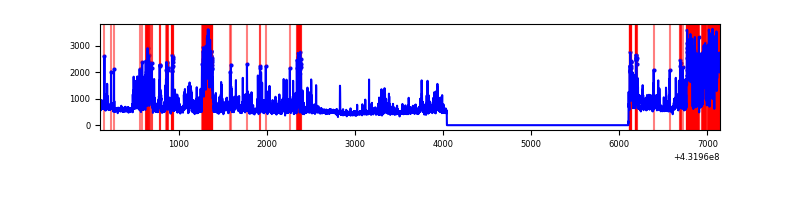 |
| C | 7038 | 4977 | 1 | 1 | 0.01% | 0.02% | 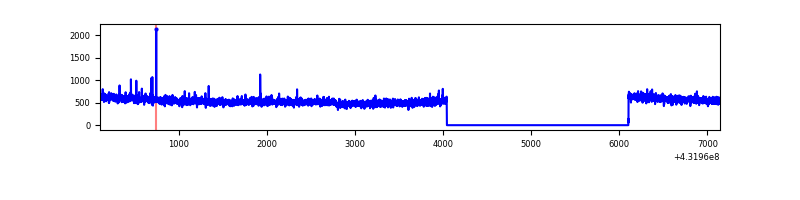 |
| D | 7038 | 4977 | 569 | 569 | 8.08% | 11.43% | 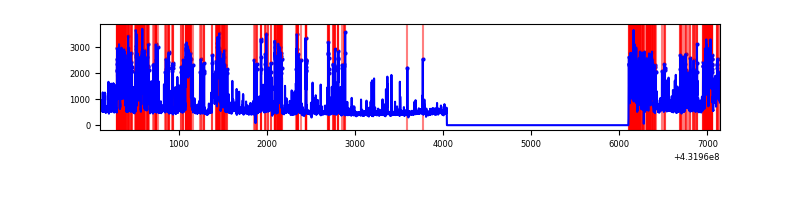 |
Top three noisy pixels from each quadrant. If the there are fewer than three noisy pixels in the level2.evt file, extra rows are filled as -1
| Pixel properties | Quadrant properties | ||||||
|---|---|---|---|---|---|---|---|
| Quadrant | DetID | PixID | Counts | Sigma | Mean | Median | Sigma |
| A | 10 | 83 | 511280 | 3412.66 | 650 | 636 | 149.6 |
| A | 15 | 237 | 315713 | 2105.68 | 650 | 636 | 149.6 |
| A | 15 | 222 | 21993 | 142.73 | 650 | 636 | 149.6 |
| B | 4 | 171 | 1066958 | 8081.3 | 614 | 602 | 132.0 |
| B | 4 | 81 | 581219 | 4400.16 | 614 | 602 | 132.0 |
| B | 0 | 186 | 127734 | 963.46 | 614 | 602 | 132.0 |
| C | 15 | 214 | 198947 | 1215.34 | 629 | 632 | 163.2 |
| C | 14 | 254 | 16622 | 97.99 | 629 | 632 | 163.2 |
| C | 7 | 220 | 6915 | 38.5 | 629 | 632 | 163.2 |
| D | 13 | 249 | 1241146 | 7774.25 | 590 | 570 | 159.6 |
| D | 10 | 118 | 694500 | 4348.62 | 590 | 570 | 159.6 |
| D | 1 | 52 | 159383 | 995.23 | 590 | 570 | 159.6 |
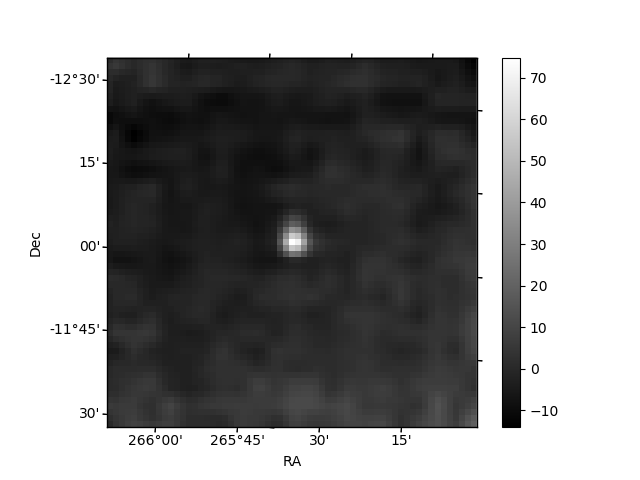
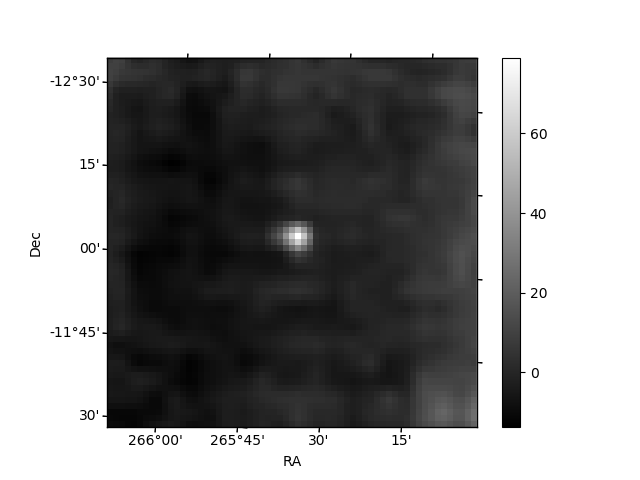
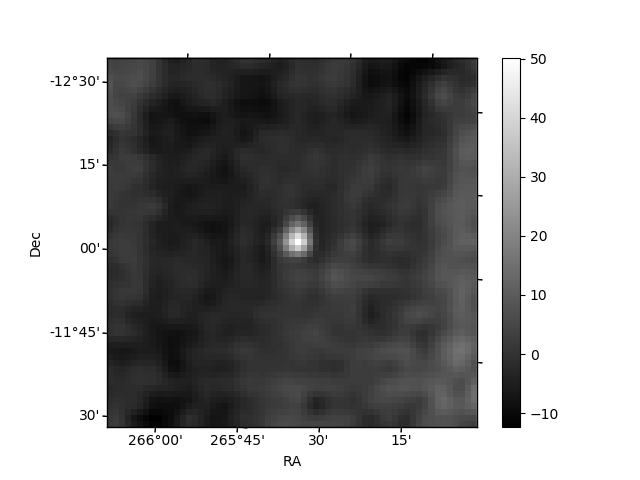
Histogram calculated using DETX and DETY for each event in the final _common_clean file
| Quadrant A | 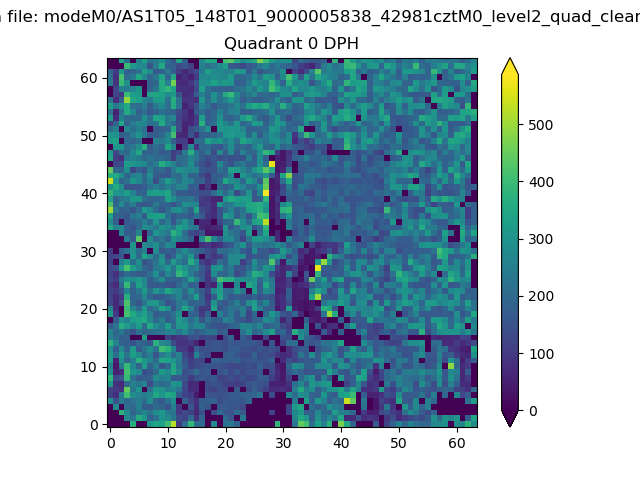 |
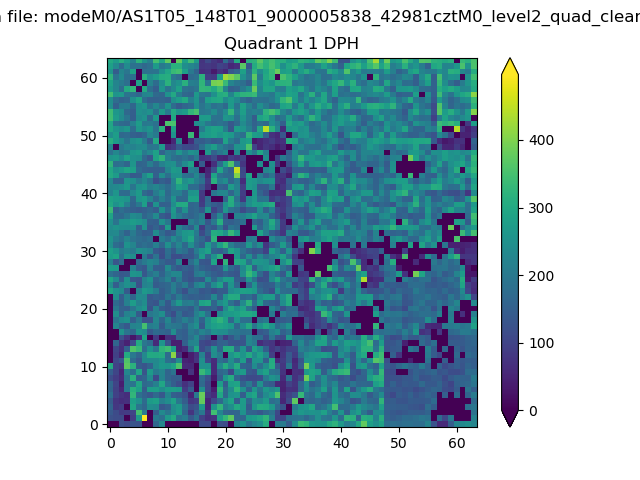 |
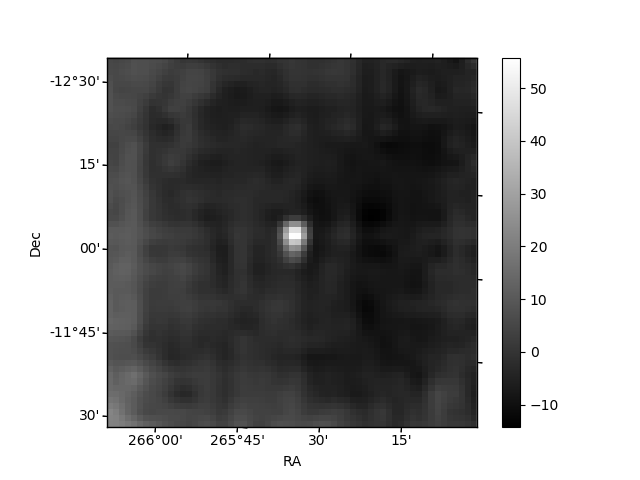
Quadrant B |
|---|---|---|---|
| Quadrant D | 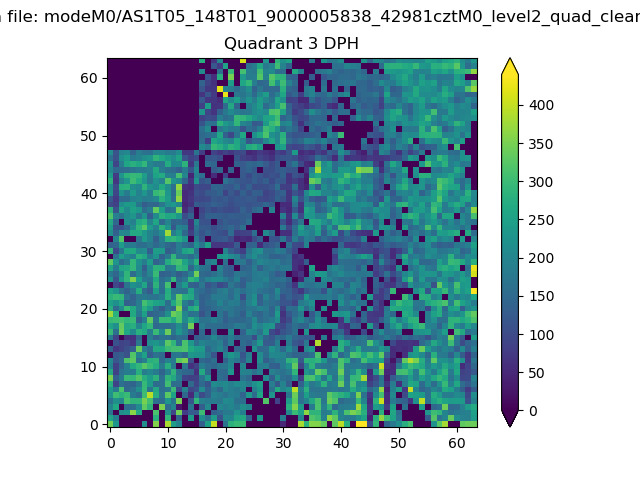 |
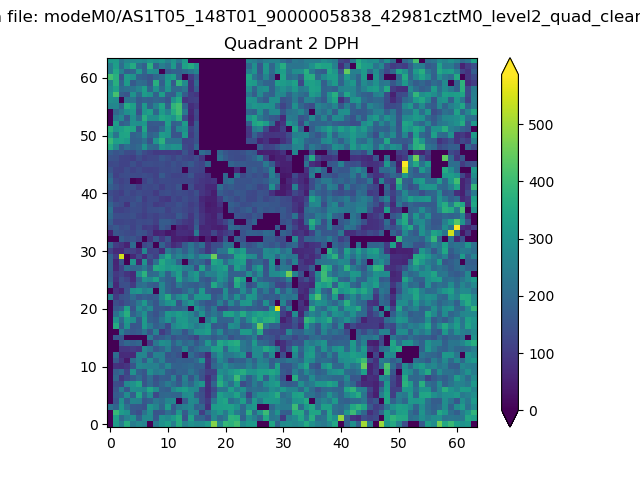 |
Quadrant C |
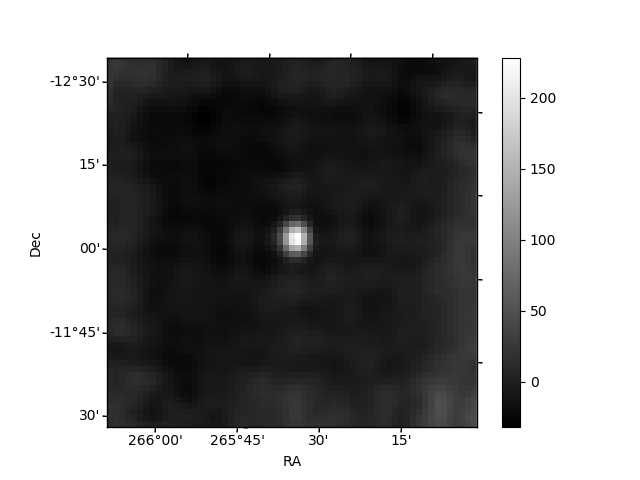
| Plot type | Count rate plots | Images |
|---|---|---|
| Comparison with Poisson distribution Blue bars denote a histogram of data divided into 1 sec bins. Red curve is a Poisson curve with rate = median count rate of data. |
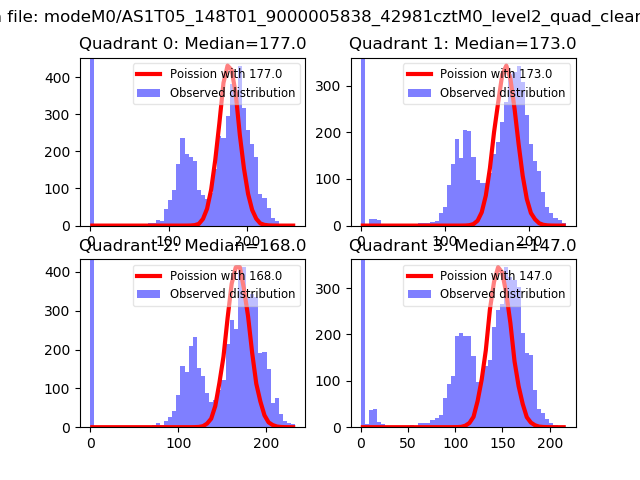 |
 |
| Quadrant-wise count rates Data is divided into 100 sec bins |
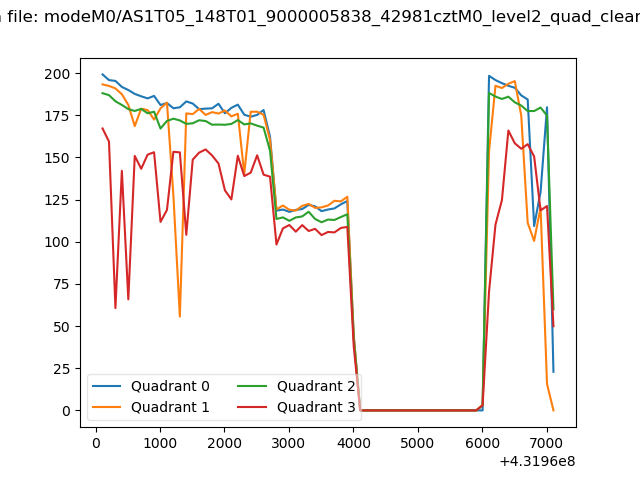 |
|
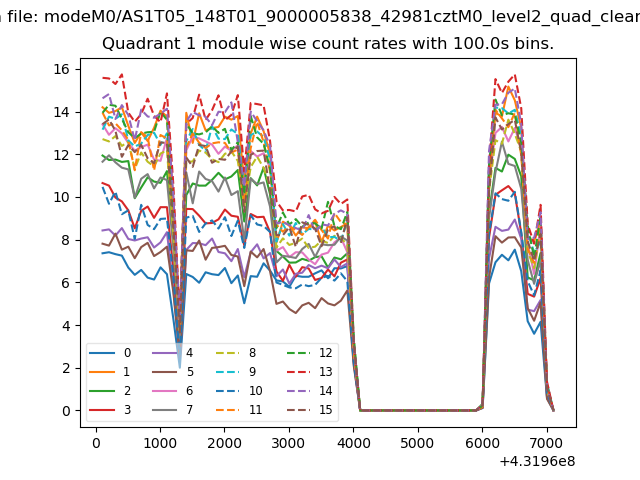
| Module-wise count rates for Quadrant A Data is divided into 100 sec bins |
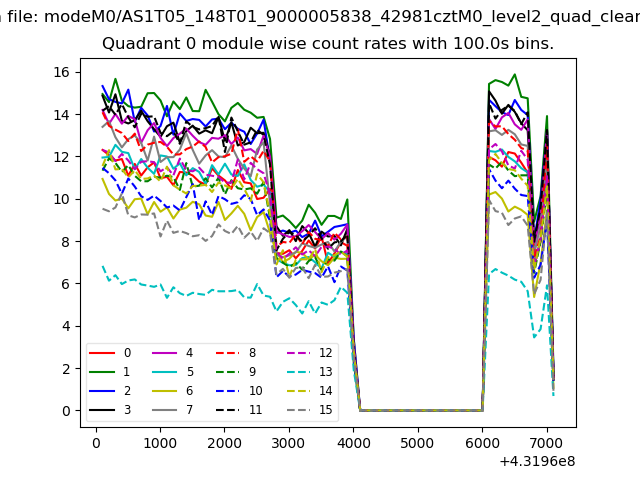 |
 |
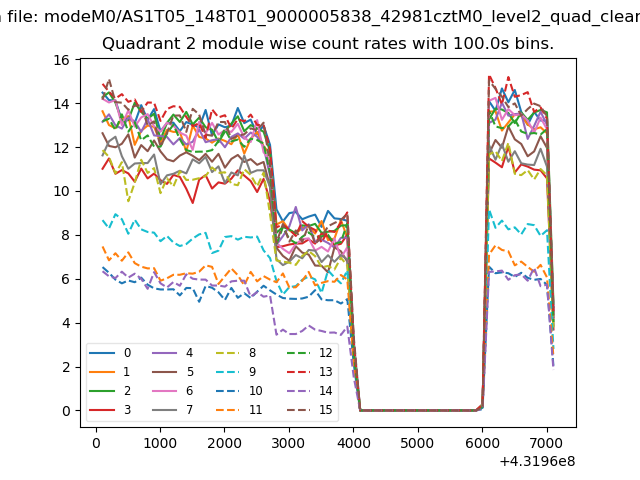
| Module-wise count rates for Quadrant B Data is divided into 100 sec bins |
 |
 |
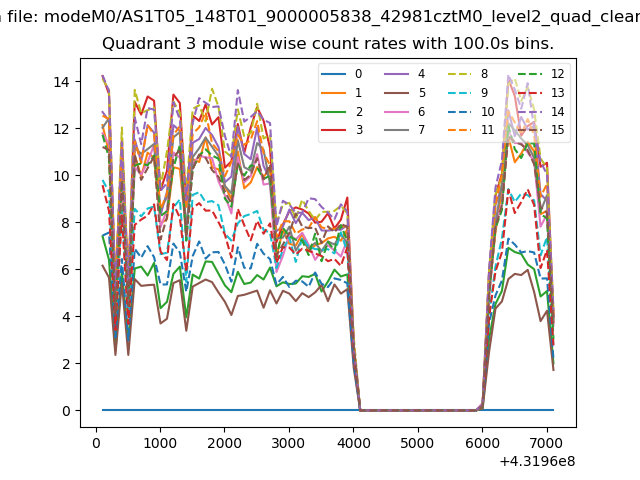
| Module-wise count rates for Quadrant C Data is divided into 100 sec bins |
 |
 |
| Module-wise count rates for Quadrant D Data is divided into 100 sec bins |
 |
 |
| Parameter | Plot |
|---|---|
| CZT HV Monitor | 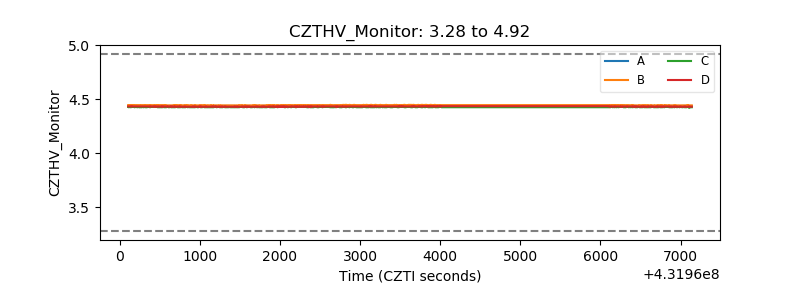 |
| D_VDD | 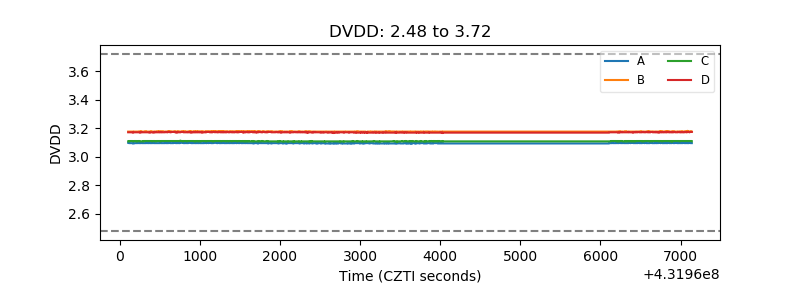 |
| Temperature 1 | 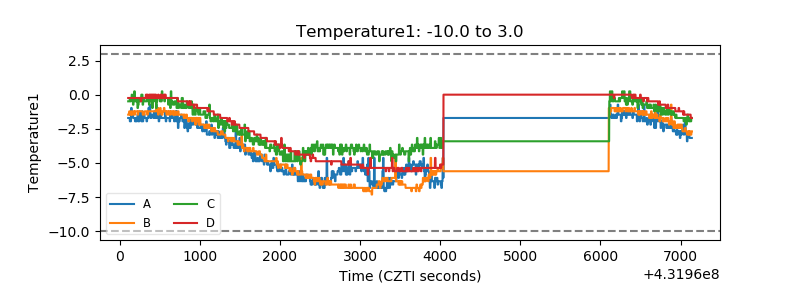 |
| Veto HV Monitor |  |
| Veto LLD | 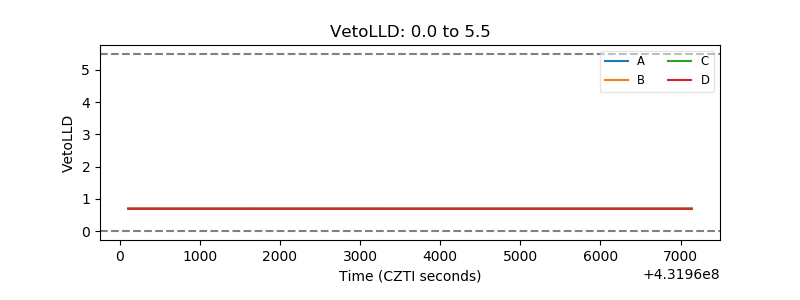 |
| Alpha Counter | 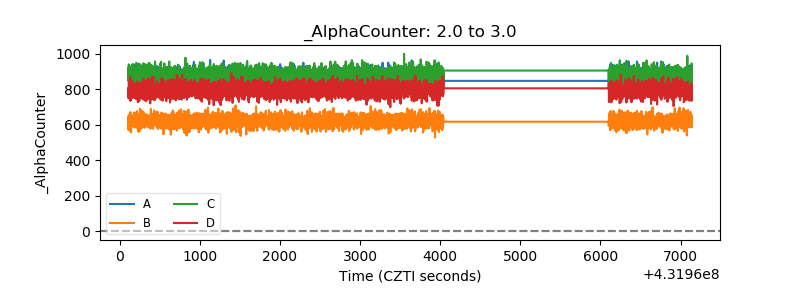 |
| _CPM_Rate | 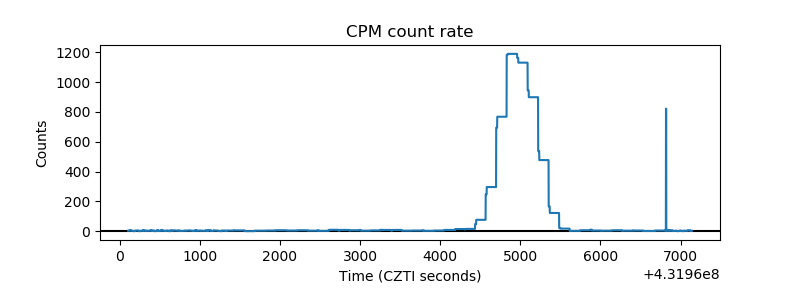 |
| CZT Counter | 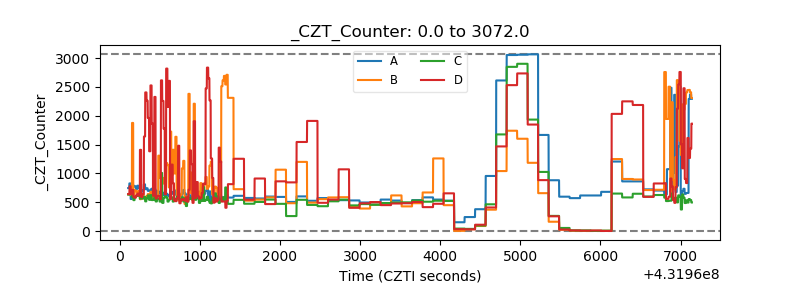 |
| +2.5 Volts monitor | 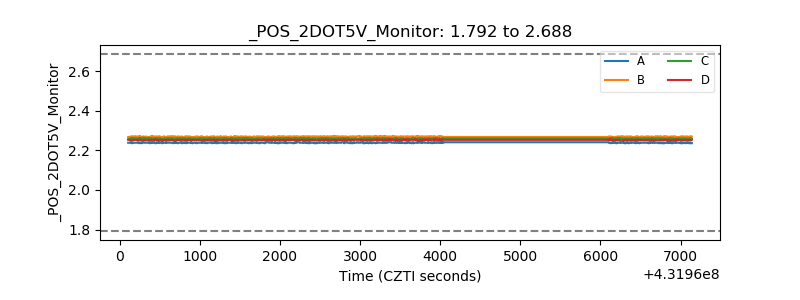 |
| +5 Volts monitor | 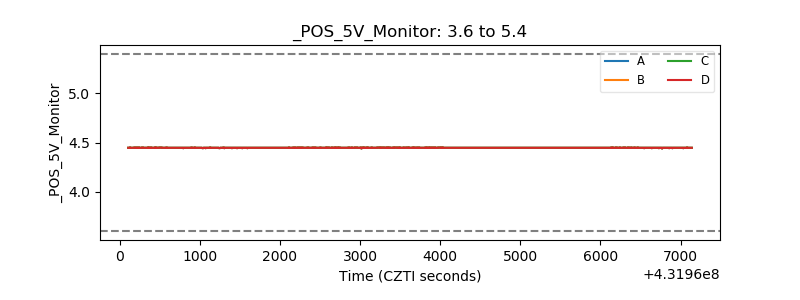 |
| _ROLL_ROT | 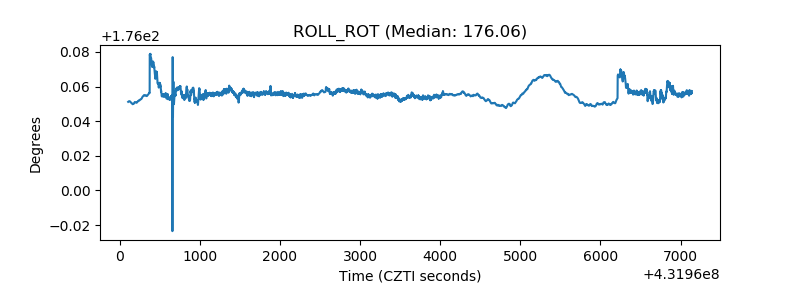 |
| _Roll_DEC | 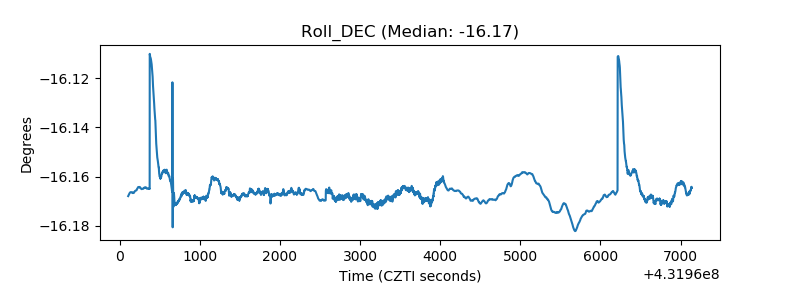 |
| _Roll_RA | 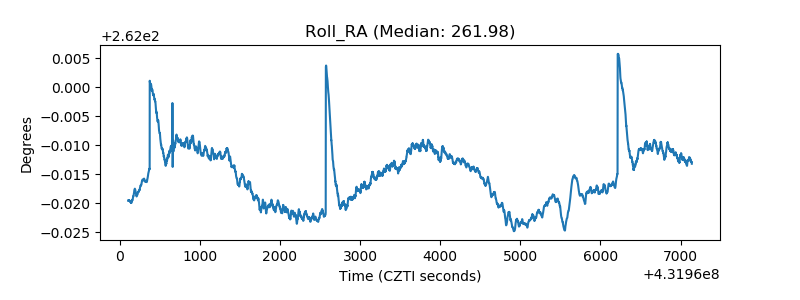 |
| Veto Counter | 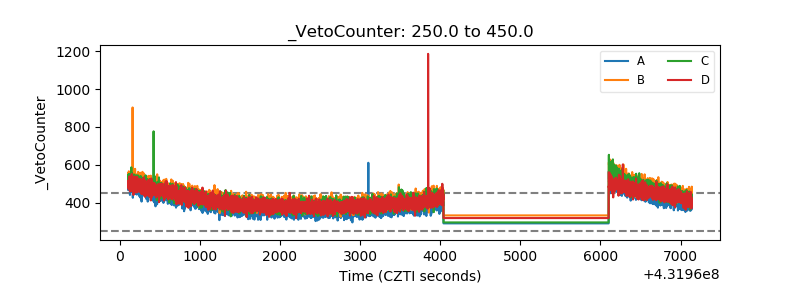 |