| Param | Original file | Final file |
|---|---|---|
| Filename | modeM0/AS1T05_148T01_9000005838_42982cztM0_level2.fits | modeM0/AS1T05_148T01_9000005838_42982cztM0_level2_quad_clean.evt |
| Size (bytes) | 482,564,160 | 105,727,680 |
| Size | 460.2 MB | 100.8 MB |
| Events in quadrant A | 3,620,564 | 794,685 |
| Events in quadrant B | 6,153,036 | 635,539 |
| Events in quadrant C | 2,694,137 | 786,123 |
| Events in quadrant D | 4,999,676 | 628,250 |
| Mode M9 | |||
|---|---|---|---|
| Quadrant | BADHDUFLAG | Total packets | Discarded packets |
| A | 0 | 22 | 0 |
| B | 0 | 23 | 0 |
| C | 0 | 23 | 0 |
| D | 0 | 23 | 0 |
| Mode SS | |||
|---|---|---|---|
| Quadrant | BADHDUFLAG | Total packets | Discarded packets |
| A | 0 | 106 | 0 |
| B | 0 | 106 | 0 |
| C | 0 | 106 | 0 |
| D | 0 | 106 | 0 |
| Mode M0 | |||
|---|---|---|---|
| Quadrant | BADHDUFLAG | Total packets | Discarded packets |
| A | 0 | 14077 | 2 |
| B | 0 | 21859 | 2 |
| C | 0 | 10936 | 2 |
| D | 0 | 18267 | 2 |
| Quadrant | Total seconds | Saturated seconds | Saturation percentage |
|---|---|---|---|
| A | 5093 | 191 | 3.750245% |
| B | 5093 | 1366 | 26.821127% |
| C | 5093 | 6 | 0.117809% |
| D | 5093 | 700 | 13.744355% |
Noise dominated data is calculated using 1-second bins in cleaned event files. If a bin has >2000 counts, and if more than 50% of those come from <1% of pixels, then it is considered to be noise-dominated and hence unusable.
| Quadrant | # 1 sec bins | Bins with >0 counts | Bins with >2000 counts | High rate bins dominated by noise | Noise dominated (total time) | Noise dominated (detector-on time) | Marked lightcurve |
|---|---|---|---|---|---|---|---|
| A | 7217 | 5094 | 148 | 148 | 2.05% | 2.91% | 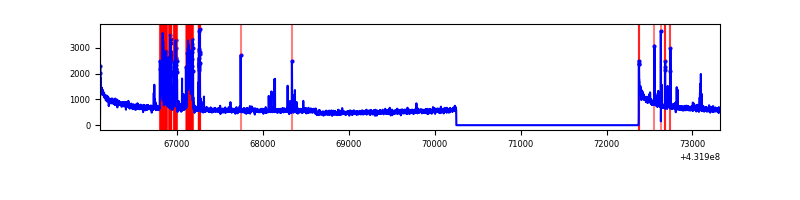 |
| B | 7217 | 5094 | 1075 | 1075 | 14.90% | 21.10% | 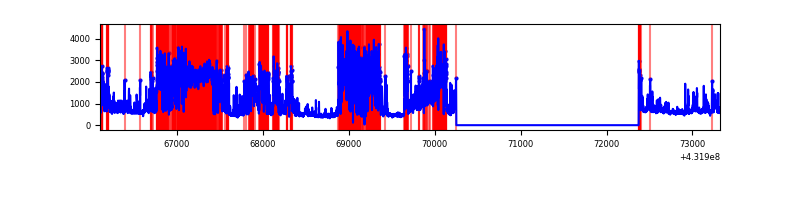 |
| C | 7217 | 5094 | 2 | 2 | 0.03% | 0.04% |  |
| D | 7217 | 5094 | 675 | 675 | 9.35% | 13.25% | 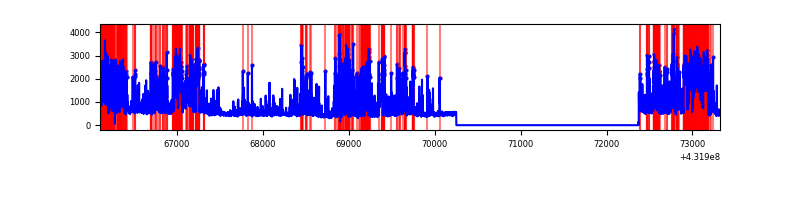 |
Top three noisy pixels from each quadrant. If the there are fewer than three noisy pixels in the level2.evt file, extra rows are filled as -1
| Pixel properties | Quadrant properties | ||||||
|---|---|---|---|---|---|---|---|
| Quadrant | DetID | PixID | Counts | Sigma | Mean | Median | Sigma |
| A | 10 | 83 | 594088 | 4048.42 | 643 | 629 | 146.6 |
| A | 15 | 237 | 470863 | 3207.81 | 643 | 629 | 146.6 |
| A | 15 | 222 | 38463 | 258.09 | 643 | 629 | 146.6 |
| B | 4 | 81 | 2378263 | 19742.87 | 551 | 539 | 120.4 |
| B | 4 | 171 | 1122154 | 9313.07 | 551 | 539 | 120.4 |
| B | 0 | 186 | 429239 | 3559.61 | 551 | 539 | 120.4 |
| C | 15 | 214 | 207300 | 1280.89 | 630 | 636 | 161.3 |
| C | 14 | 254 | 20639 | 123.98 | 630 | 636 | 161.3 |
| C | 7 | 220 | 5192 | 28.24 | 630 | 636 | 161.3 |
| D | 10 | 118 | 812724 | 5146.55 | 587 | 569 | 157.8 |
| D | 13 | 249 | 674352 | 4269.7 | 587 | 569 | 157.8 |
| D | 1 | 47 | 584026 | 3697.31 | 587 | 569 | 157.8 |
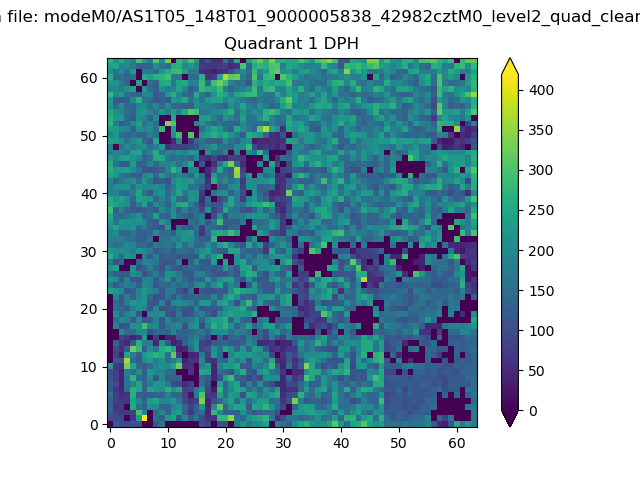
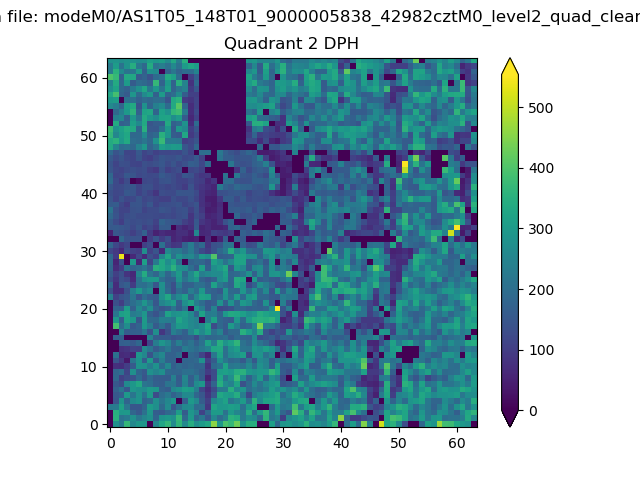
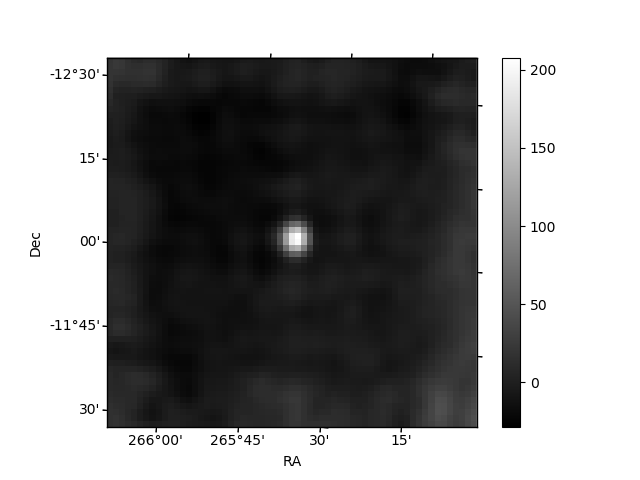
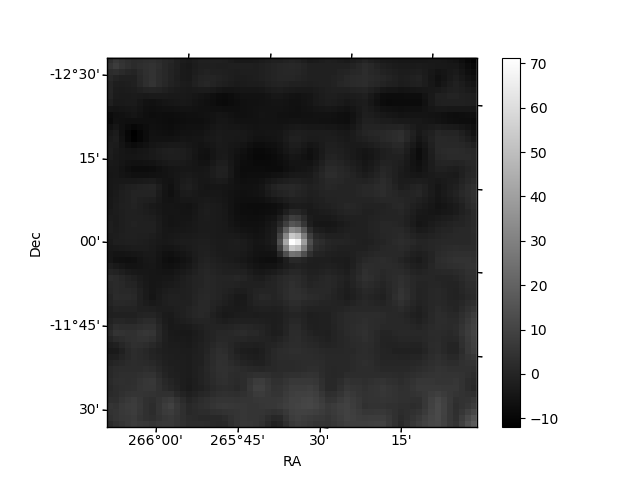
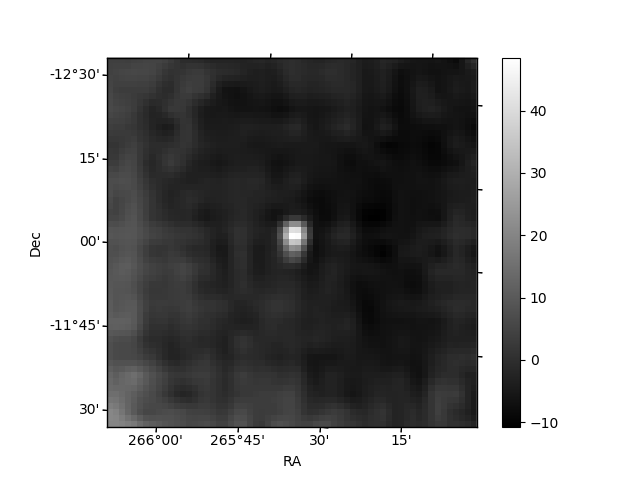
Histogram calculated using DETX and DETY for each event in the final _common_clean file
| Quadrant A | 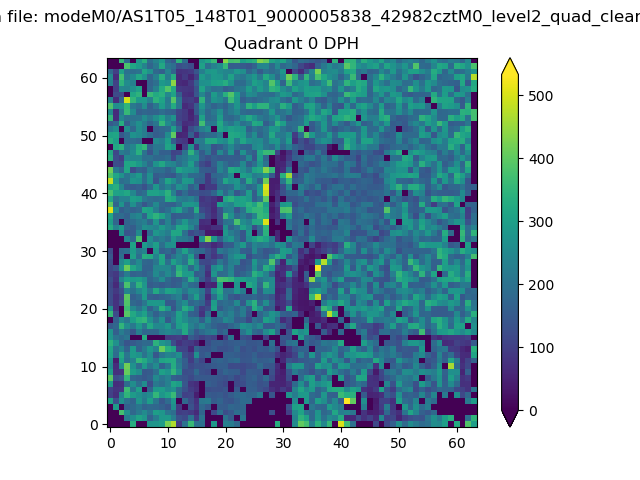 |
 |
Quadrant B |
|---|---|---|---|
| Quadrant D | 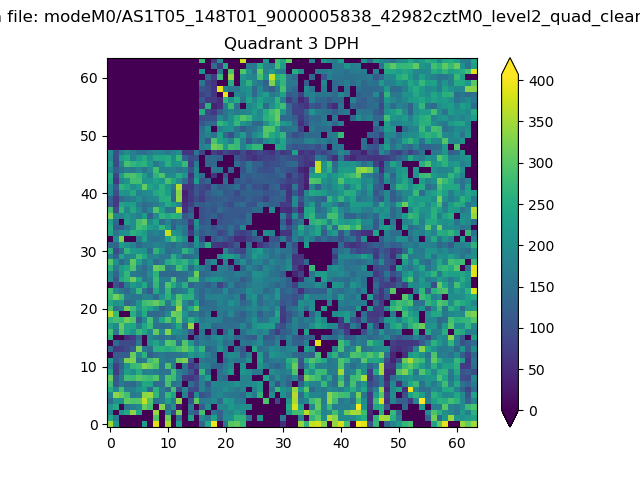 |
 |
Quadrant C |
| Plot type | Count rate plots | Images |
|---|---|---|
| Comparison with Poisson distribution Blue bars denote a histogram of data divided into 1 sec bins. Red curve is a Poisson curve with rate = median count rate of data. |
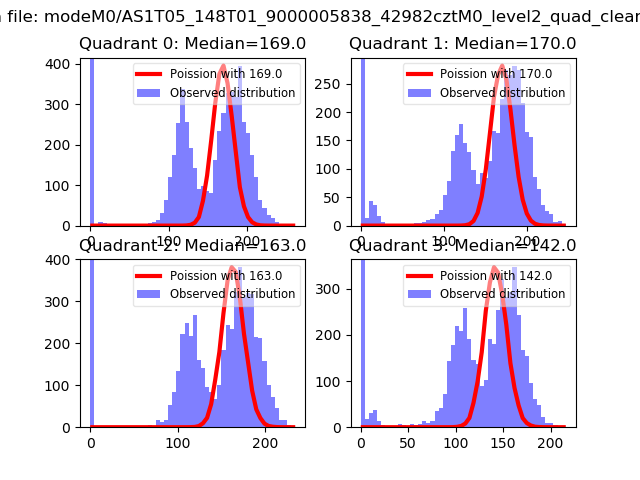 |
 |
| Quadrant-wise count rates Data is divided into 100 sec bins |
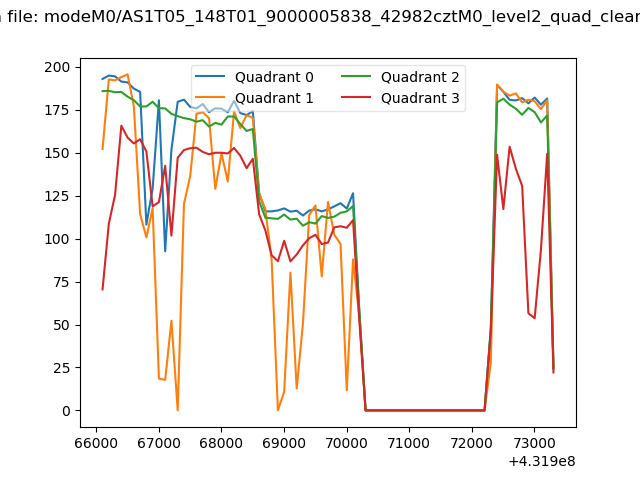 |
|
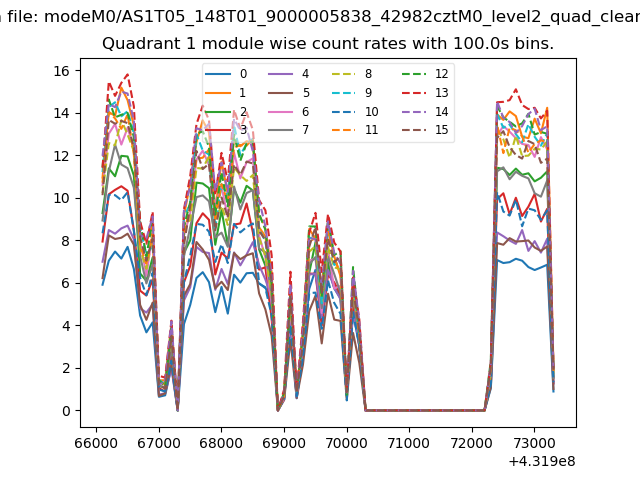
| Module-wise count rates for Quadrant A Data is divided into 100 sec bins |
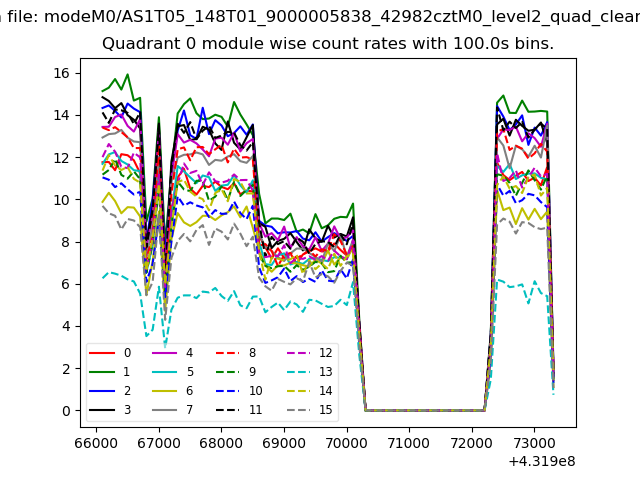 |
 |
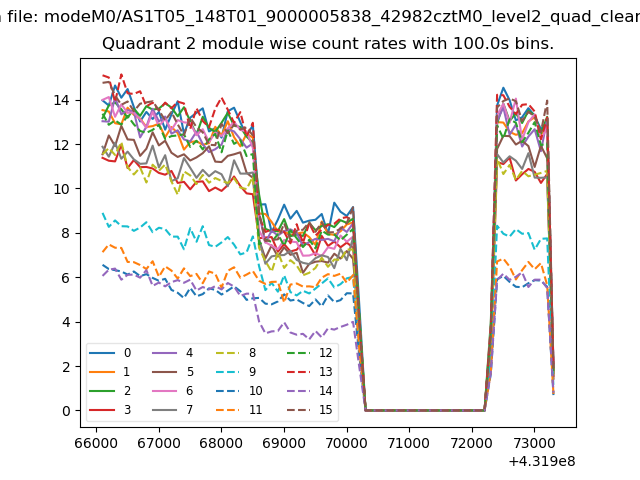
| Module-wise count rates for Quadrant B Data is divided into 100 sec bins |
 |
 |
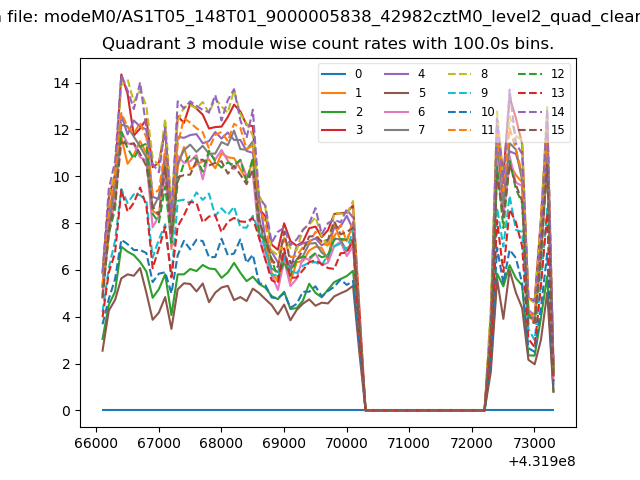
| Module-wise count rates for Quadrant C Data is divided into 100 sec bins |
 |
 |
| Module-wise count rates for Quadrant D Data is divided into 100 sec bins |
 |
 |
| Parameter | Plot |
|---|---|
| CZT HV Monitor | 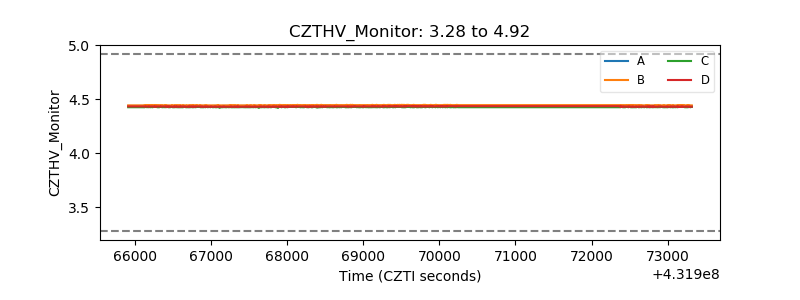 |
| D_VDD | 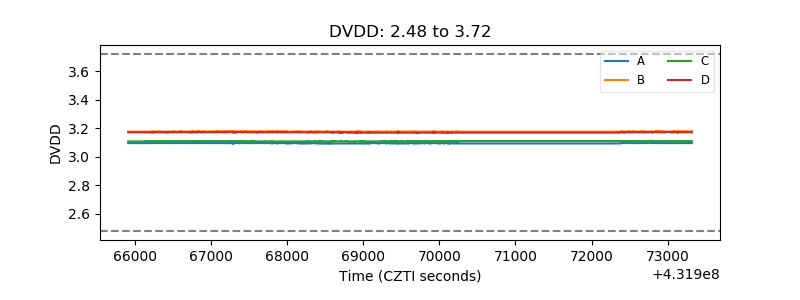 |
| Temperature 1 | 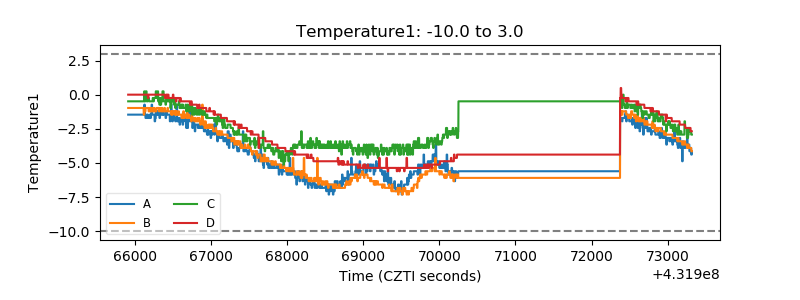 |
| Veto HV Monitor | 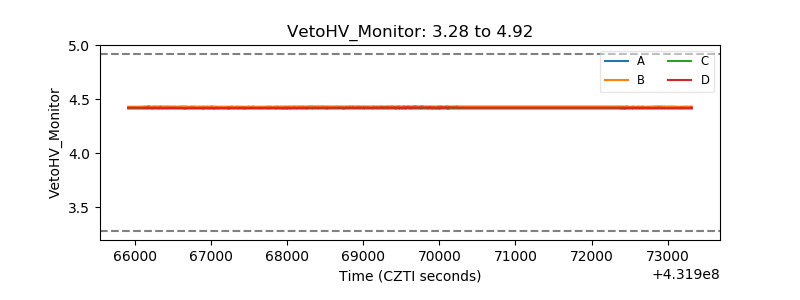 |
| Veto LLD | 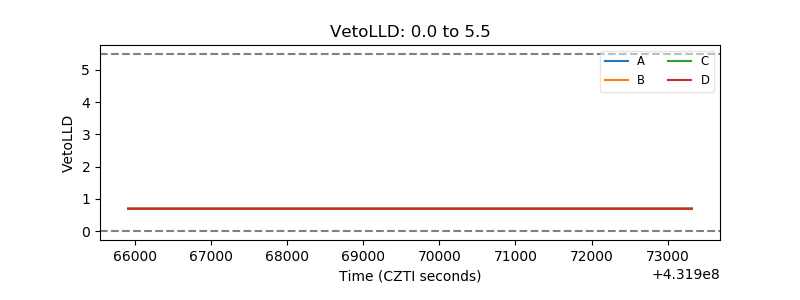 |
| Alpha Counter | 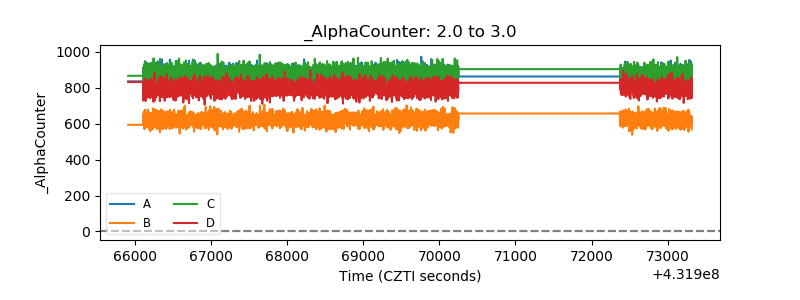 |
| _CPM_Rate | 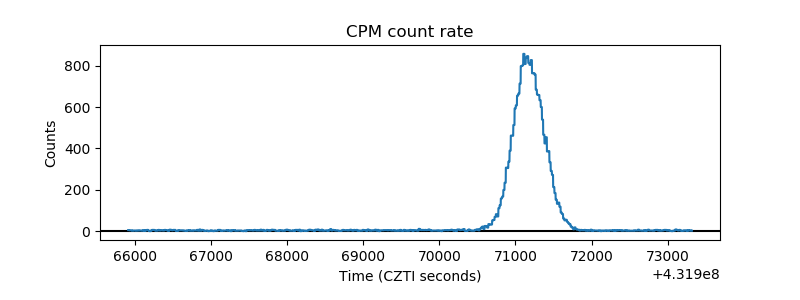 |
| CZT Counter | 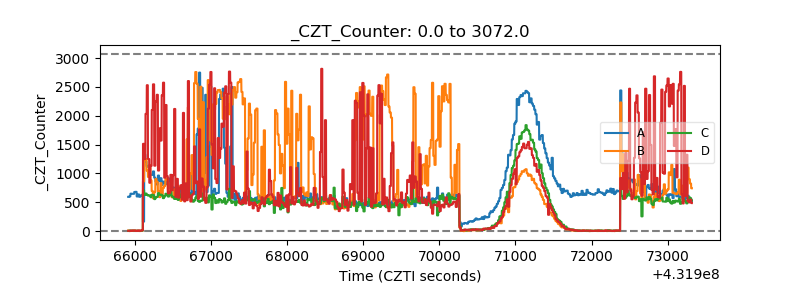 |
| +2.5 Volts monitor |  |
| +5 Volts monitor | 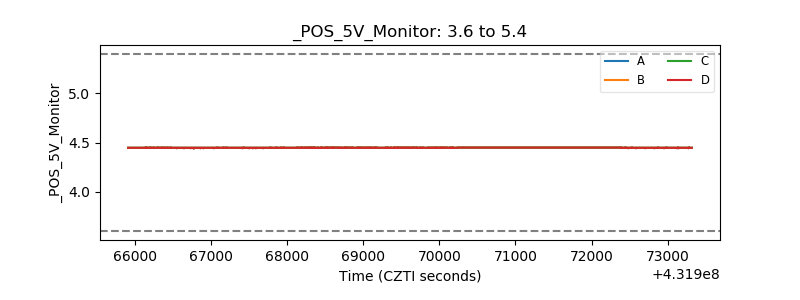 |
| _ROLL_ROT | 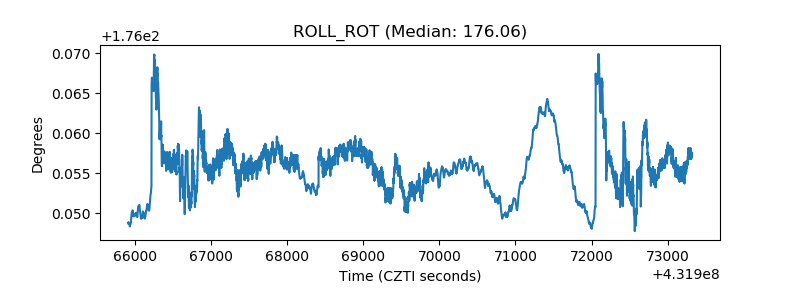 |
| _Roll_DEC | 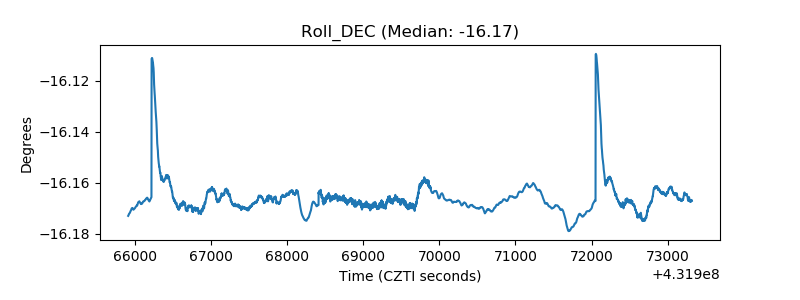 |
| _Roll_RA | 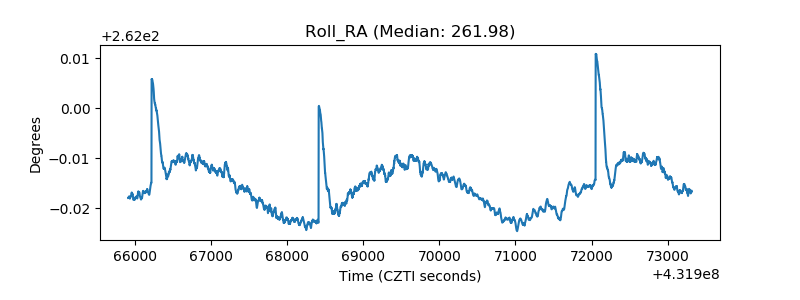 |
| Veto Counter | 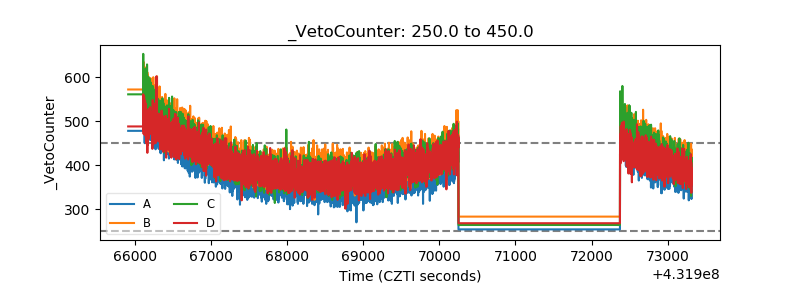 |