| Param | Original file | Final file |
|---|---|---|
| Filename | modeM0/AS1T05_148T01_9000005838_42983cztM0_level2.fits | modeM0/AS1T05_148T01_9000005838_42983cztM0_level2_quad_clean.evt |
| Size (bytes) | 370,848,960 | 100,779,840 |
| Size | 353.7 MB | 96.1 MB |
| Events in quadrant A | 3,012,834 | 734,035 |
| Events in quadrant B | 4,013,198 | 681,994 |
| Events in quadrant C | 2,493,315 | 706,488 |
| Events in quadrant D | 3,828,176 | 586,812 |
| Mode M9 | |||
|---|---|---|---|
| Quadrant | BADHDUFLAG | Total packets | Discarded packets |
| A | 0 | 21 | 0 |
| B | 0 | 22 | 0 |
| C | 0 | 22 | 0 |
| D | 0 | 22 | 0 |
| Mode SS | |||
|---|---|---|---|
| Quadrant | BADHDUFLAG | Total packets | Discarded packets |
| A | 0 | 100 | 0 |
| B | 0 | 100 | 0 |
| C | 0 | 100 | 0 |
| D | 0 | 100 | 0 |
| Mode M0 | |||
|---|---|---|---|
| Quadrant | BADHDUFLAG | Total packets | Discarded packets |
| A | 0 | 12075 | 2 |
| B | 0 | 15336 | 2 |
| C | 0 | 10180 | 2 |
| D | 0 | 14660 | 2 |
| Quadrant | Total seconds | Saturated seconds | Saturation percentage |
|---|---|---|---|
| A | 4884 | 27 | 0.552826% |
| B | 4884 | 394 | 8.067158% |
| C | 4884 | 4 | 0.081900% |
| D | 4884 | 413 | 8.456183% |
Noise dominated data is calculated using 1-second bins in cleaned event files. If a bin has >2000 counts, and if more than 50% of those come from <1% of pixels, then it is considered to be noise-dominated and hence unusable.
| Quadrant | # 1 sec bins | Bins with >0 counts | Bins with >2000 counts | High rate bins dominated by noise | Noise dominated (total time) | Noise dominated (detector-on time) | Marked lightcurve |
|---|---|---|---|---|---|---|---|
| A | 7007 | 4885 | 16 | 16 | 0.23% | 0.33% | 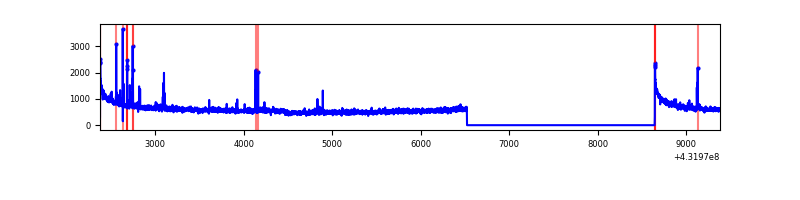 |
| B | 7007 | 4885 | 238 | 238 | 3.40% | 4.87% | 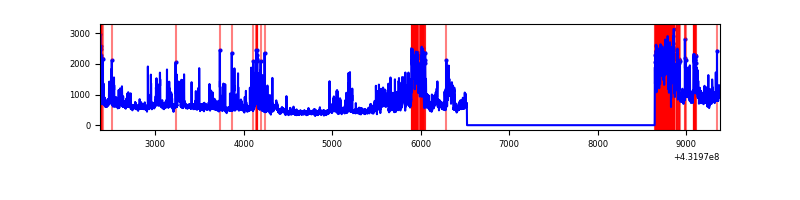 |
| C | 7007 | 4885 | 2 | 2 | 0.03% | 0.04% | 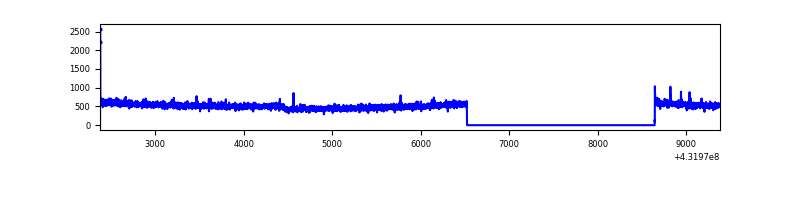 |
| D | 7007 | 4885 | 399 | 399 | 5.69% | 8.17% | 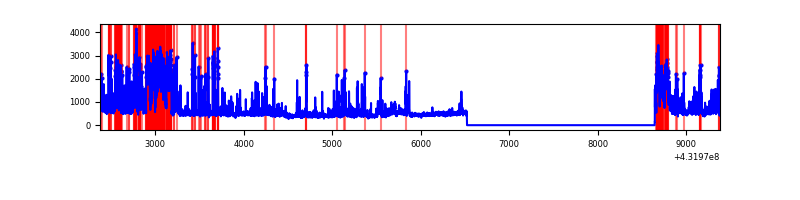 |
Top three noisy pixels from each quadrant. If the there are fewer than three noisy pixels in the level2.evt file, extra rows are filled as -1
| Pixel properties | Quadrant properties | ||||||
|---|---|---|---|---|---|---|---|
| Quadrant | DetID | PixID | Counts | Sigma | Mean | Median | Sigma |
| A | 10 | 83 | 569907 | 4198.87 | 601 | 591 | 135.6 |
| A | 15 | 237 | 45512 | 331.31 | 601 | 591 | 135.6 |
| A | 15 | 222 | 39897 | 289.89 | 601 | 591 | 135.6 |
| B | 4 | 81 | 1240883 | 10317.25 | 571 | 559 | 120.2 |
| B | 4 | 171 | 472722 | 3927.54 | 571 | 559 | 120.2 |
| B | 5 | 172 | 26192 | 213.22 | 571 | 559 | 120.2 |
| C | 15 | 214 | 199388 | 1349.84 | 583 | 589 | 147.3 |
| C | 14 | 254 | 9252 | 58.82 | 583 | 589 | 147.3 |
| C | 12 | 2 | 6422 | 39.61 | 583 | 589 | 147.3 |
| D | 10 | 118 | 491152 | 3363.47 | 554 | 539 | 145.9 |
| D | 12 | 233 | 445127 | 3047.94 | 554 | 539 | 145.9 |
| D | 13 | 249 | 395703 | 2709.1 | 554 | 539 | 145.9 |
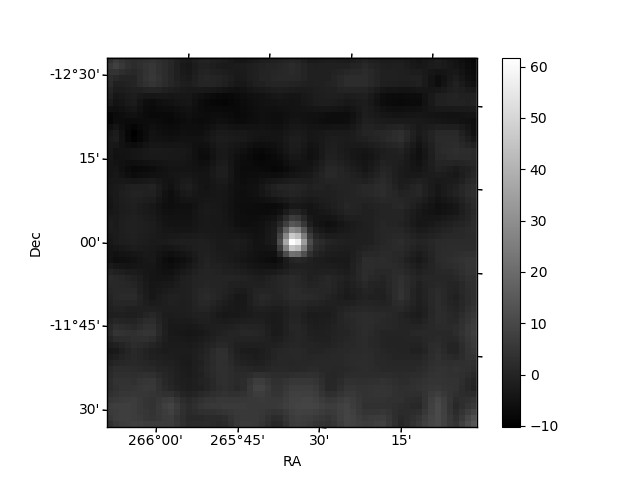
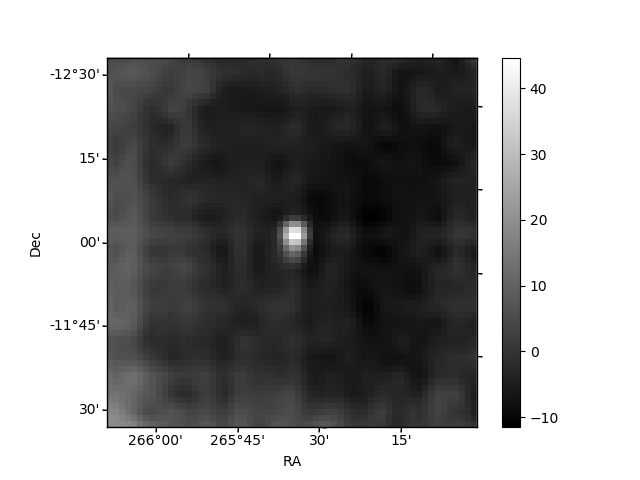
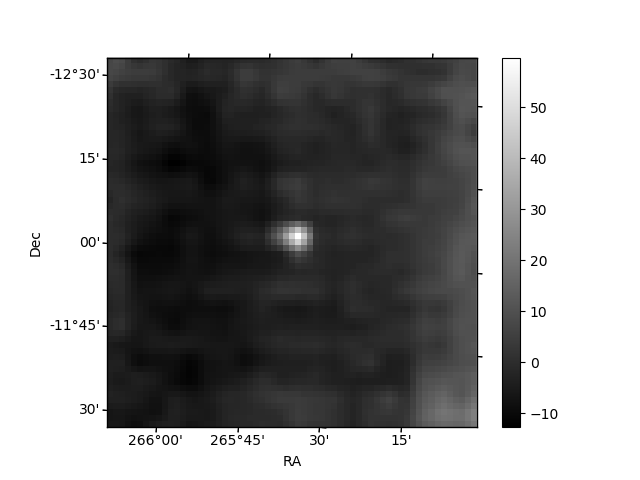
Histogram calculated using DETX and DETY for each event in the final _common_clean file
| Quadrant A | 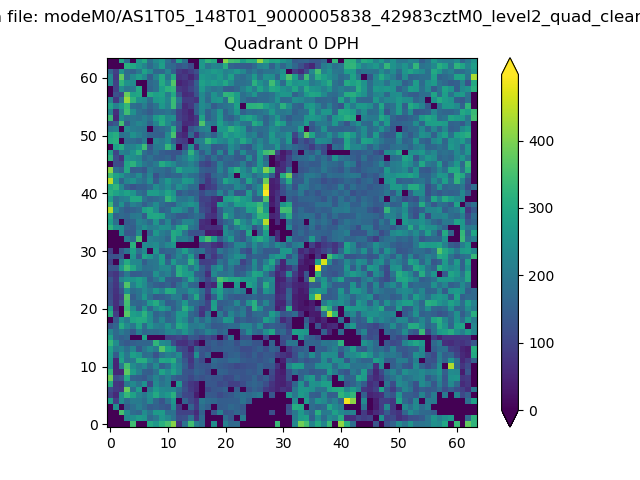 |
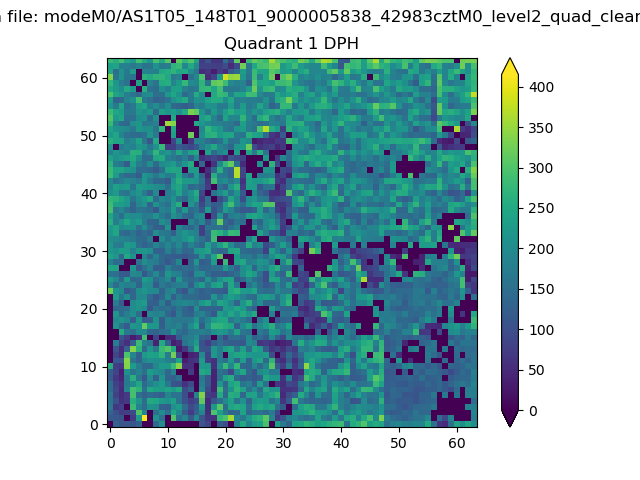 |
Quadrant B |
|---|---|---|---|
| Quadrant D | 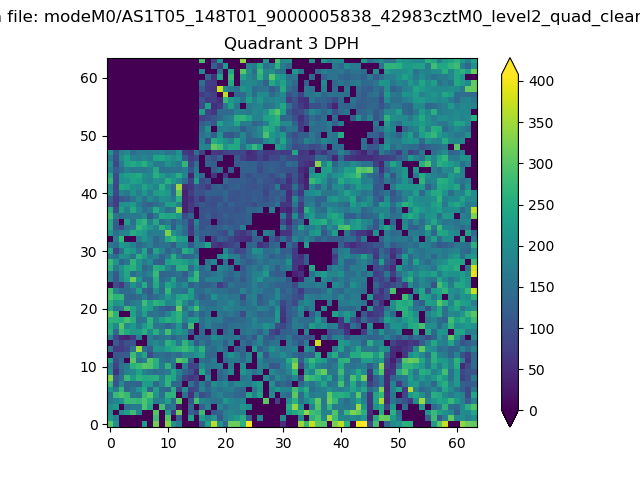 |
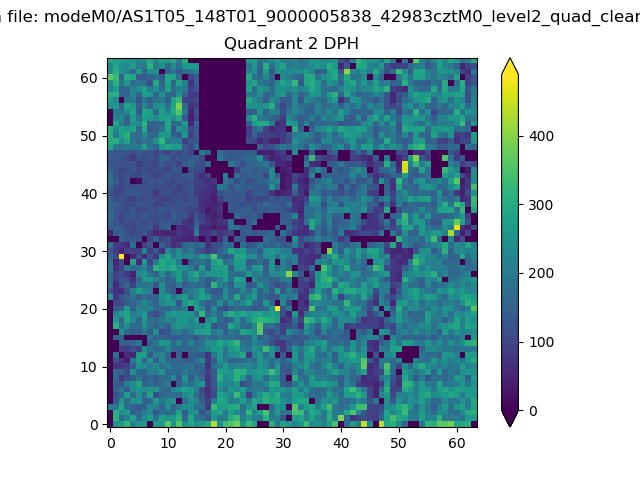 |
Quadrant C |
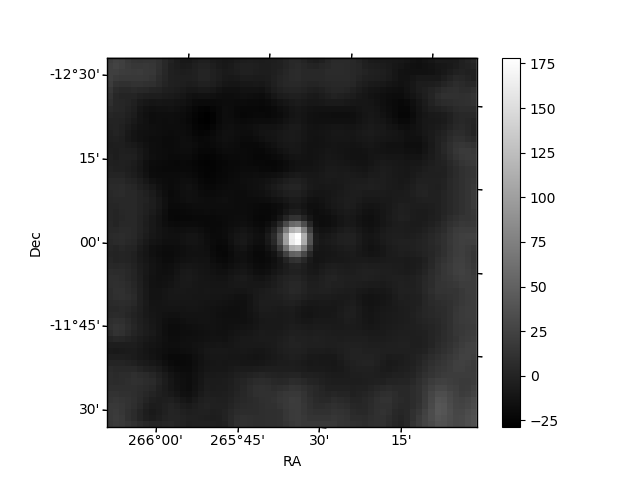
| Plot type | Count rate plots | Images |
|---|---|---|
| Comparison with Poisson distribution Blue bars denote a histogram of data divided into 1 sec bins. Red curve is a Poisson curve with rate = median count rate of data. |
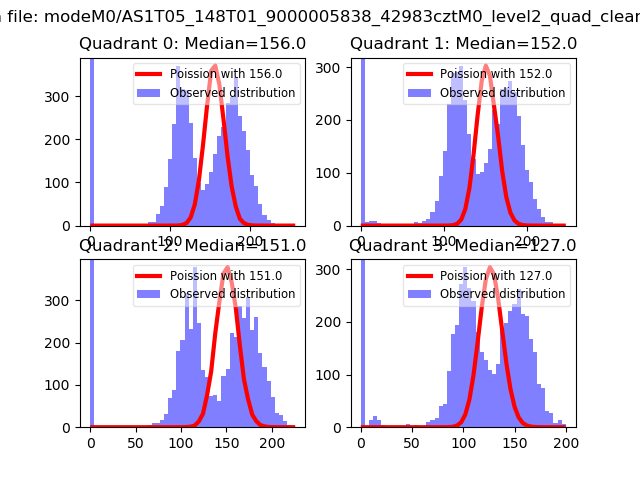 |
 |
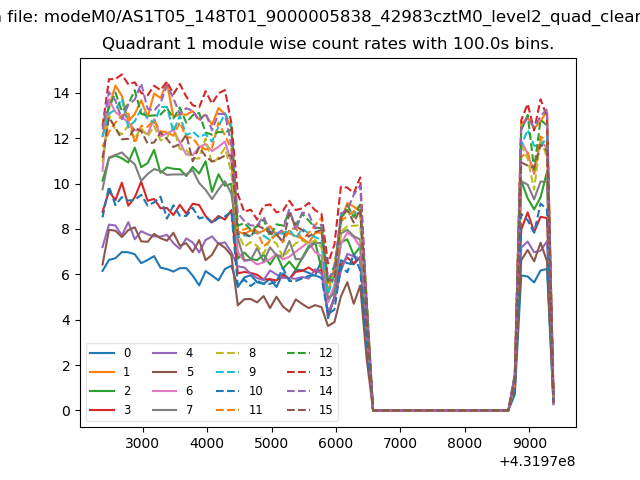
| Quadrant-wise count rates Data is divided into 100 sec bins |
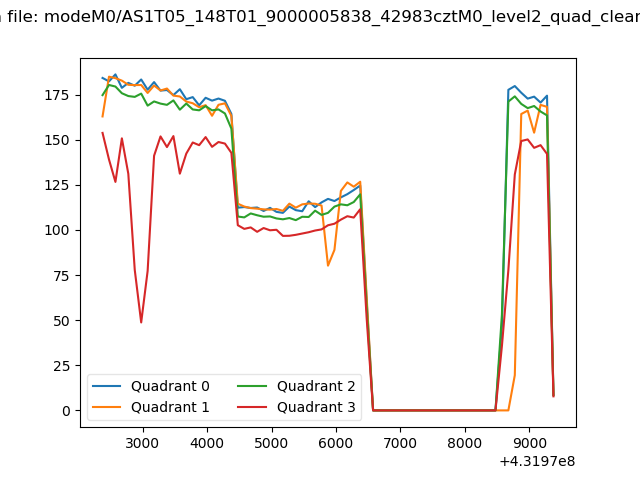 |
|
| Module-wise count rates for Quadrant A Data is divided into 100 sec bins |
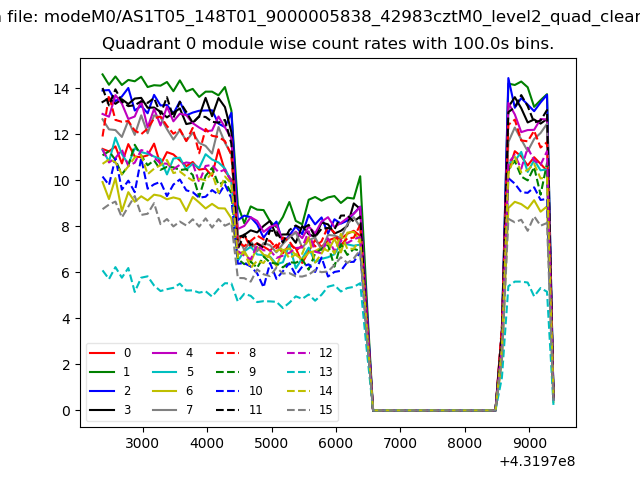 |
 |
| Module-wise count rates for Quadrant B Data is divided into 100 sec bins |
 |
 |
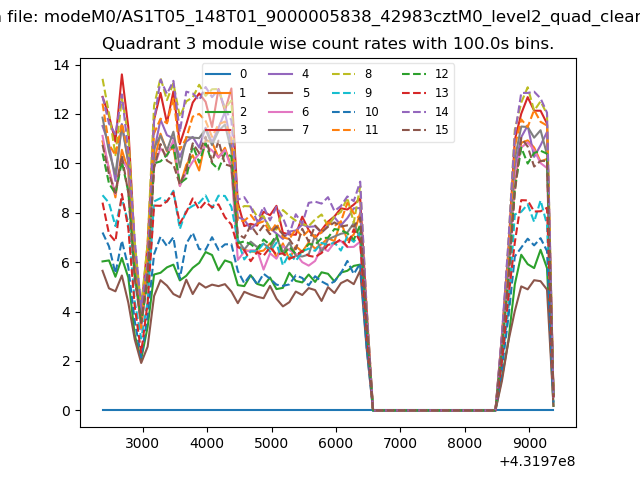
| Module-wise count rates for Quadrant C Data is divided into 100 sec bins |
 |
 |
| Module-wise count rates for Quadrant D Data is divided into 100 sec bins |
 |
 |
| Parameter | Plot |
|---|---|
| CZT HV Monitor | 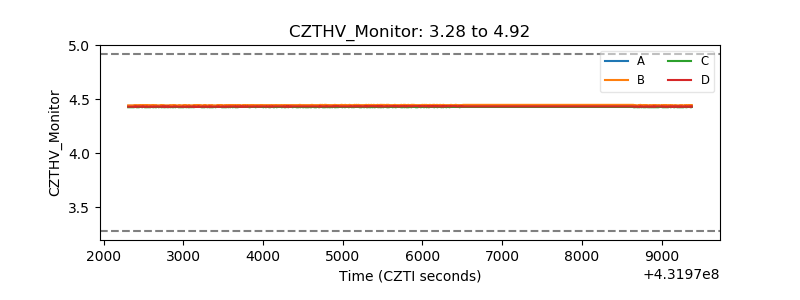 |
| D_VDD | 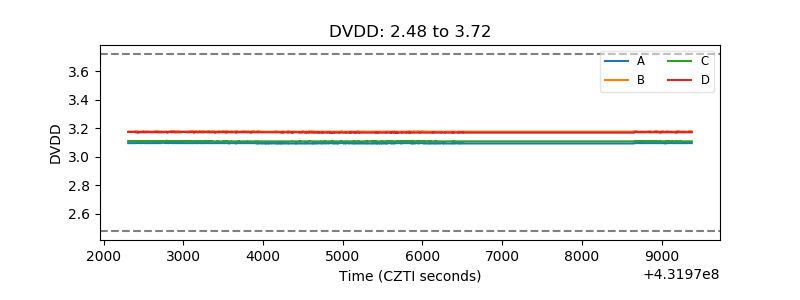 |
| Temperature 1 | 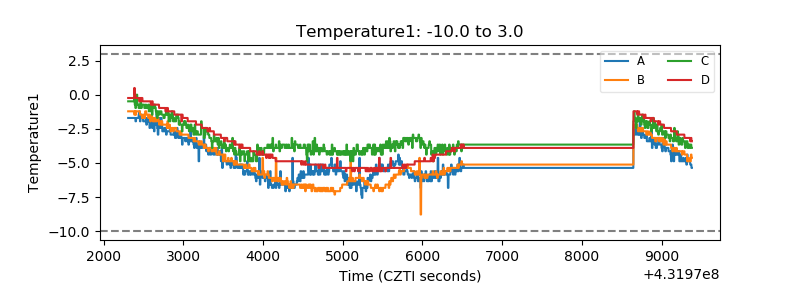 |
| Veto HV Monitor | 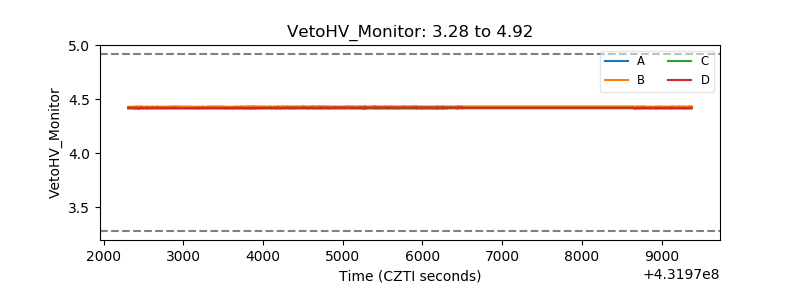 |
| Veto LLD | 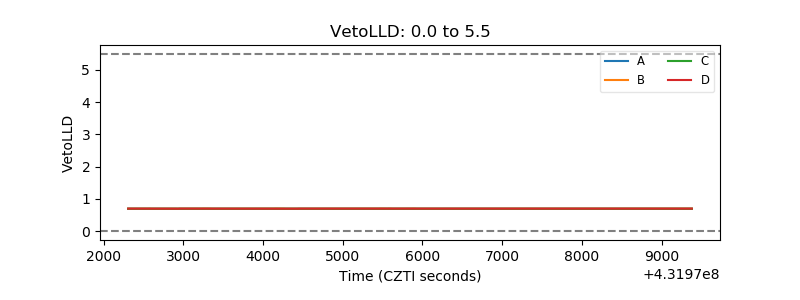 |
| Alpha Counter | 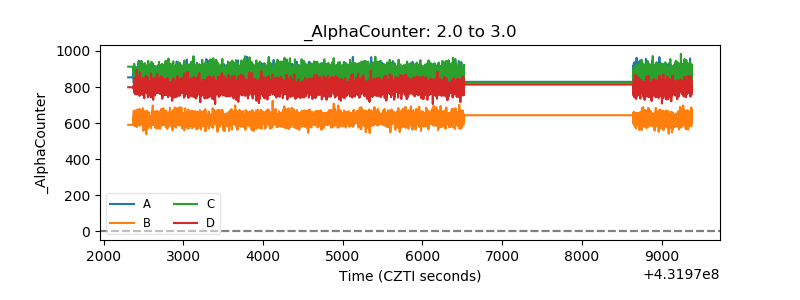 |
| _CPM_Rate |  |
| CZT Counter | 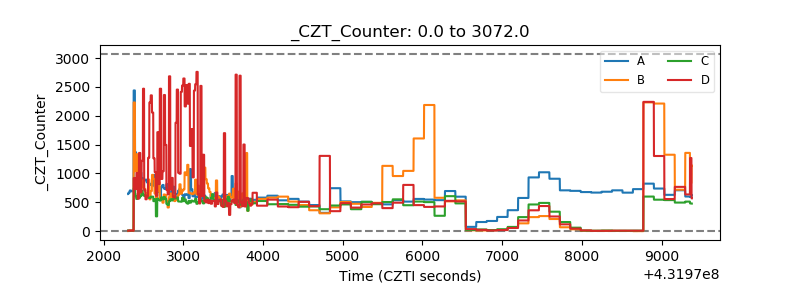 |
| +2.5 Volts monitor | 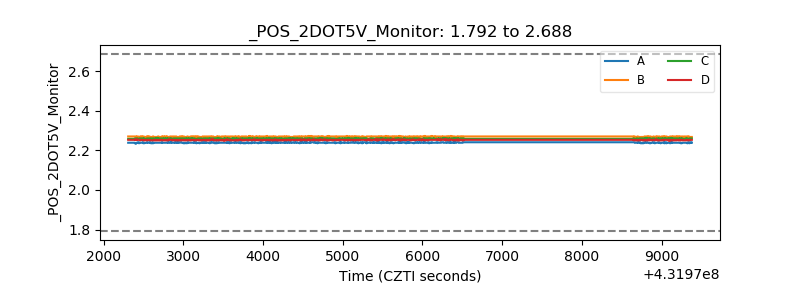 |
| +5 Volts monitor |  |
| _ROLL_ROT | 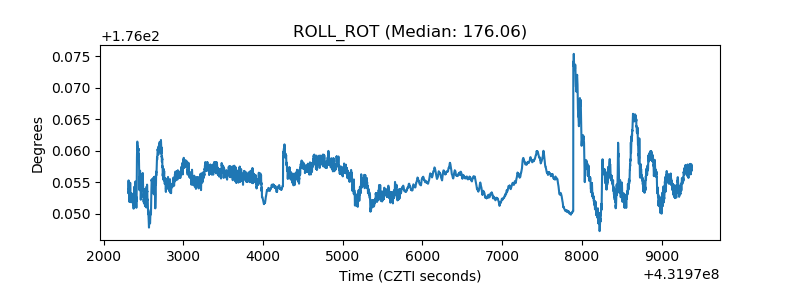 |
| _Roll_DEC | 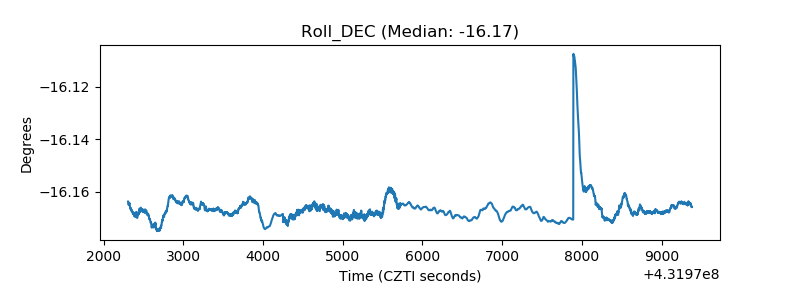 |
| _Roll_RA | 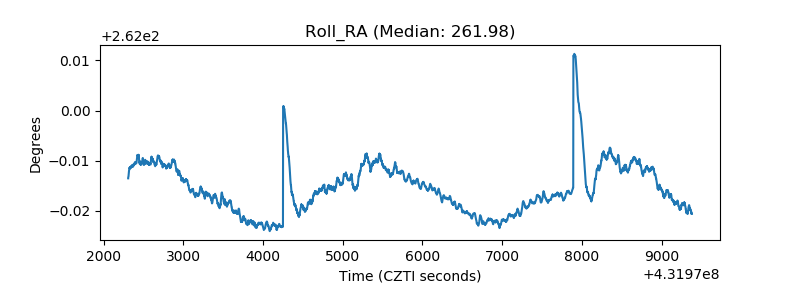 |
| Veto Counter | 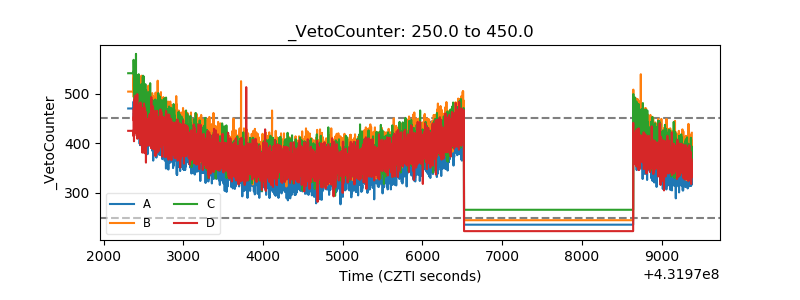 |