| Param | Original file | Final file |
|---|---|---|
| Filename | modeM0/AS1T05_148T01_9000005838_42984cztM0_level2.fits | modeM0/AS1T05_148T01_9000005838_42984cztM0_level2_quad_clean.evt |
| Size (bytes) | 367,401,600 | 103,772,160 |
| Size | 350.4 MB | 99.0 MB |
| Events in quadrant A | 3,055,065 | 744,569 |
| Events in quadrant B | 4,333,036 | 690,414 |
| Events in quadrant C | 2,739,412 | 717,482 |
| Events in quadrant D | 3,075,582 | 632,641 |
| Mode M9 | |||
|---|---|---|---|
| Quadrant | BADHDUFLAG | Total packets | Discarded packets |
| A | 0 | 25 | 0 |
| B | 0 | 26 | 0 |
| C | 0 | 26 | 0 |
| D | 0 | 26 | 0 |
| Mode SS | |||
|---|---|---|---|
| Quadrant | BADHDUFLAG | Total packets | Discarded packets |
| A | 0 | 104 | 0 |
| B | 0 | 104 | 0 |
| C | 0 | 104 | 0 |
| D | 0 | 104 | 0 |
| Mode M0 | |||
|---|---|---|---|
| Quadrant | BADHDUFLAG | Total packets | Discarded packets |
| A | 0 | 12457 | 2 |
| B | 0 | 16370 | 2 |
| C | 0 | 11329 | 2 |
| D | 0 | 12641 | 2 |
| Quadrant | Total seconds | Saturated seconds | Saturation percentage |
|---|---|---|---|
| A | 5101 | 25 | 0.490100% |
| B | 5101 | 427 | 8.370908% |
| C | 5100 | 3 | 0.058824% |
| D | 5100 | 147 | 2.882353% |
Noise dominated data is calculated using 1-second bins in cleaned event files. If a bin has >2000 counts, and if more than 50% of those come from <1% of pixels, then it is considered to be noise-dominated and hence unusable.
| Quadrant | # 1 sec bins | Bins with >0 counts | Bins with >2000 counts | High rate bins dominated by noise | Noise dominated (total time) | Noise dominated (detector-on time) | Marked lightcurve |
|---|---|---|---|---|---|---|---|
| A | 7044 | 5102 | 11 | 11 | 0.16% | 0.22% | 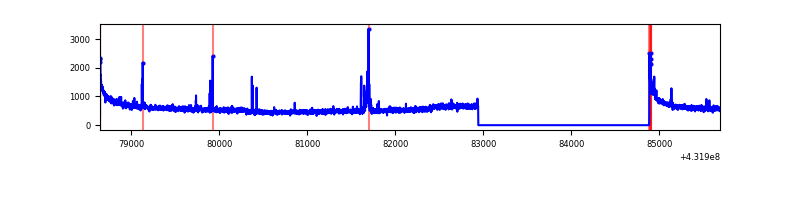 |
| B | 7044 | 5102 | 280 | 280 | 3.98% | 5.49% | 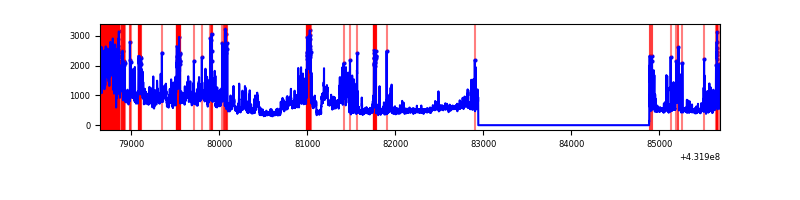 |
| C | 7043 | 5101 | 2 | 2 | 0.03% | 0.04% | 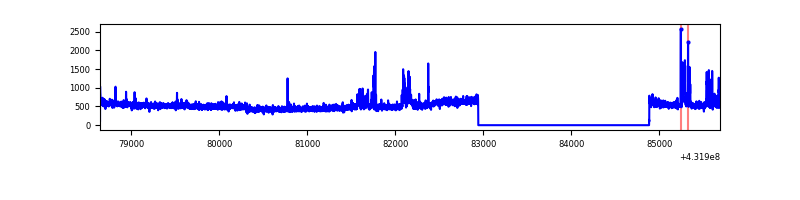 |
| D | 7043 | 5101 | 127 | 127 | 1.80% | 2.49% | 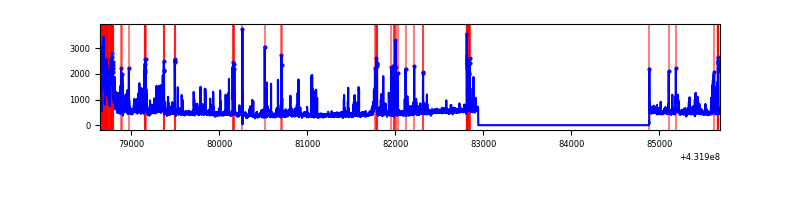 |
Top three noisy pixels from each quadrant. If the there are fewer than three noisy pixels in the level2.evt file, extra rows are filled as -1
| Pixel properties | Quadrant properties | ||||||
|---|---|---|---|---|---|---|---|
| Quadrant | DetID | PixID | Counts | Sigma | Mean | Median | Sigma |
| A | 10 | 83 | 568258 | 4053.32 | 616 | 605 | 140.0 |
| A | 15 | 237 | 66592 | 471.18 | 616 | 605 | 140.0 |
| A | 15 | 222 | 16307 | 112.12 | 616 | 605 | 140.0 |
| B | 4 | 81 | 1276447 | 10350.57 | 583 | 570 | 123.3 |
| B | 4 | 171 | 672612 | 5451.95 | 583 | 570 | 123.3 |
| B | 5 | 255 | 45085 | 361.13 | 583 | 570 | 123.3 |
| C | 15 | 214 | 207967 | 1355.67 | 600 | 606 | 153.0 |
| C | 14 | 254 | 163712 | 1066.34 | 600 | 606 | 153.0 |
| C | 7 | 220 | 12057 | 74.86 | 600 | 606 | 153.0 |
| D | 13 | 249 | 273943 | 1753.19 | 584 | 565 | 155.9 |
| D | 10 | 118 | 155479 | 993.47 | 584 | 565 | 155.9 |
| D | 12 | 6 | 114403 | 730.05 | 584 | 565 | 155.9 |
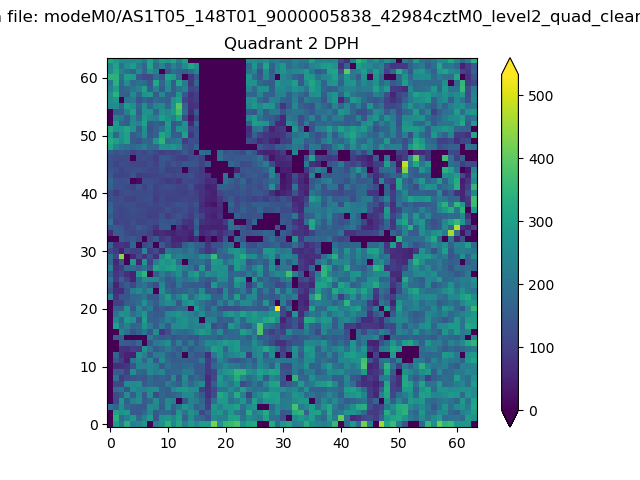
Histogram calculated using DETX and DETY for each event in the final _common_clean file
| Quadrant A | 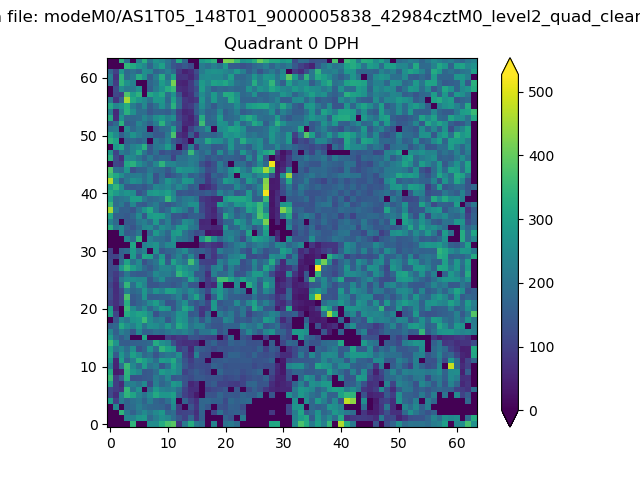 |
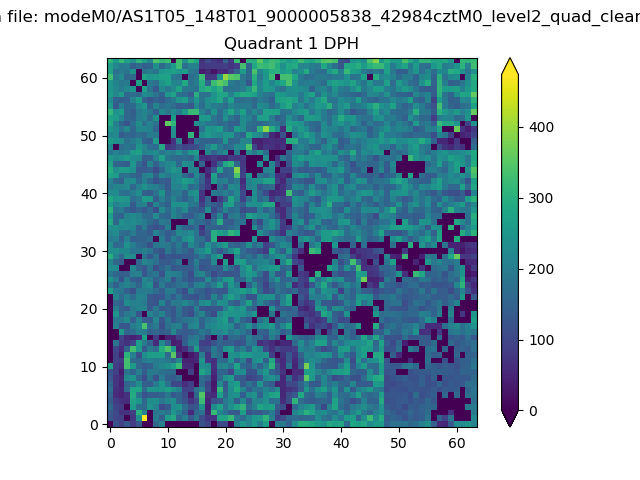 |
Quadrant B |
|---|---|---|---|
| Quadrant D | 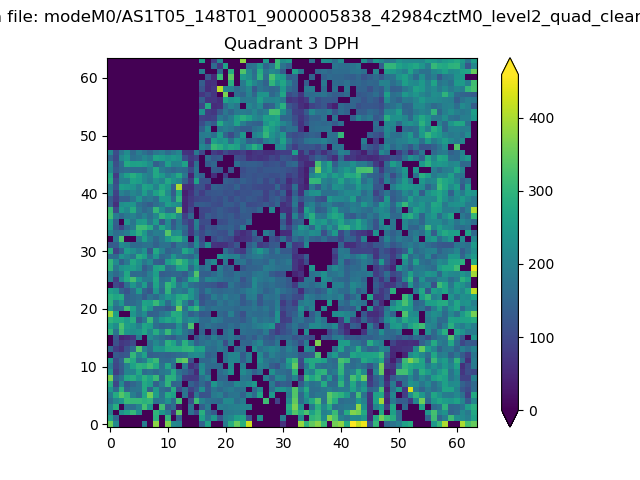 |
 |
Quadrant C |
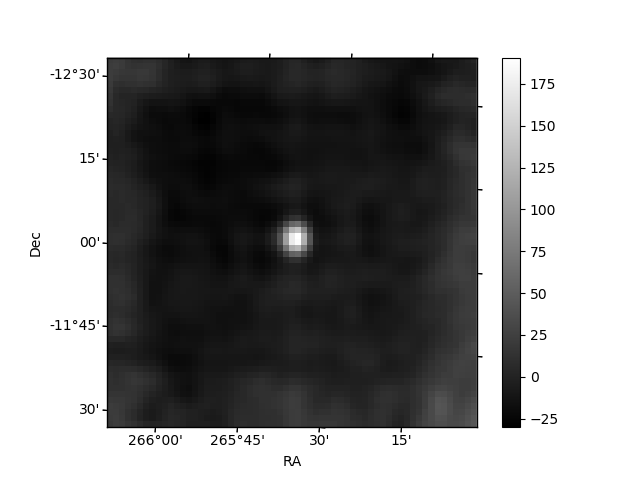
| Plot type | Count rate plots | Images |
|---|---|---|
| Comparison with Poisson distribution Blue bars denote a histogram of data divided into 1 sec bins. Red curve is a Poisson curve with rate = median count rate of data. |
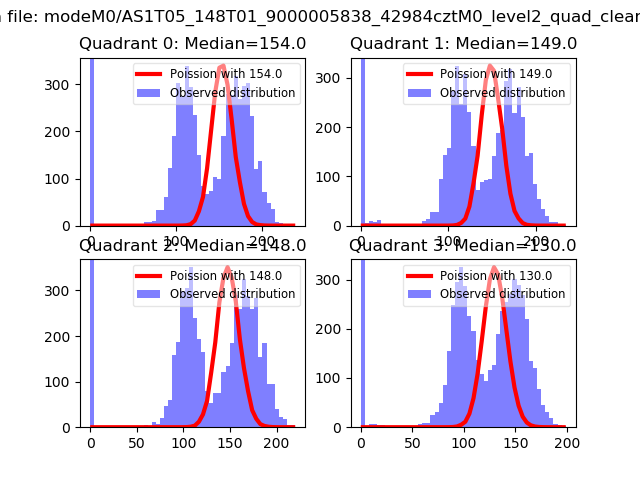 |
 |
| Quadrant-wise count rates Data is divided into 100 sec bins |
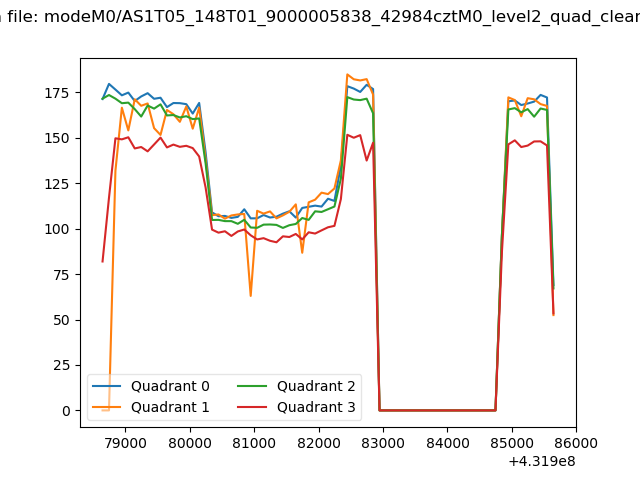 |
|
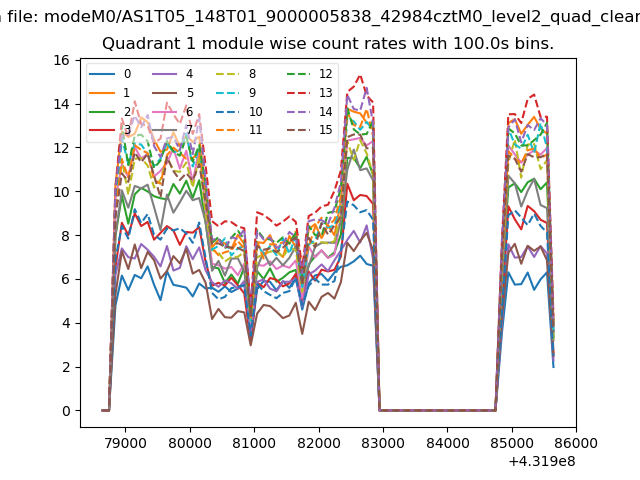
| Module-wise count rates for Quadrant A Data is divided into 100 sec bins |
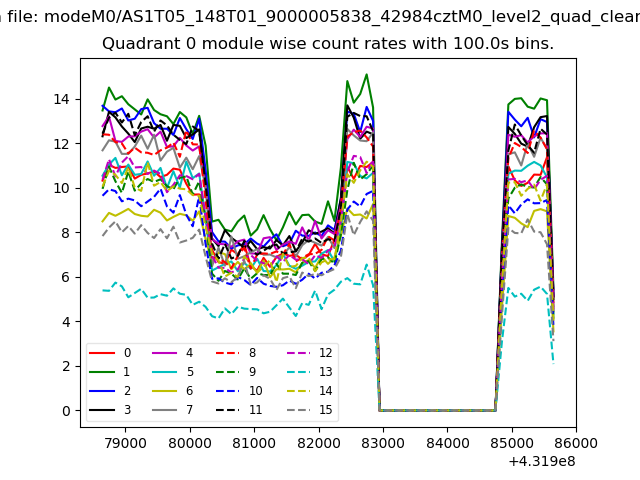 |
 |
| Module-wise count rates for Quadrant B Data is divided into 100 sec bins |
 |
 |
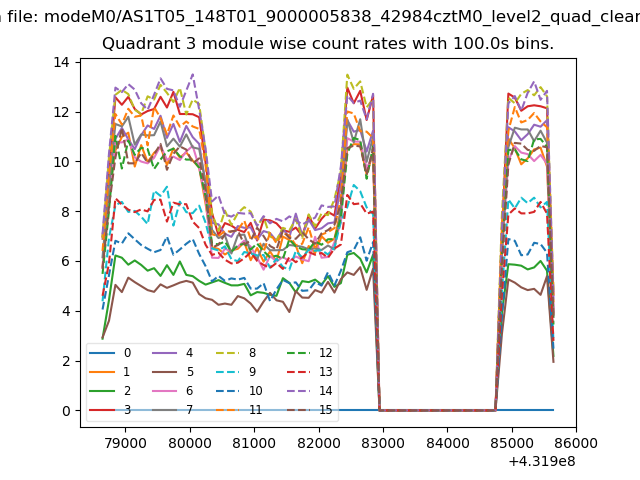
| Module-wise count rates for Quadrant C Data is divided into 100 sec bins |
 |
 |
| Module-wise count rates for Quadrant D Data is divided into 100 sec bins |
 |
 |
| Parameter | Plot |
|---|---|
| CZT HV Monitor | 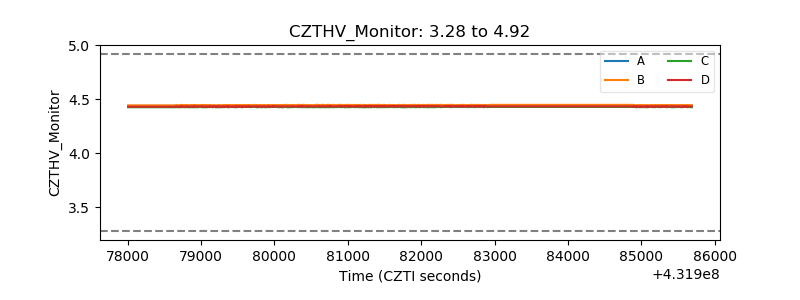 |
| D_VDD | 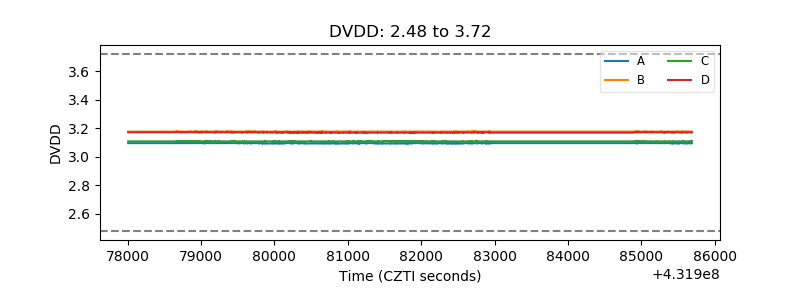 |
| Temperature 1 | 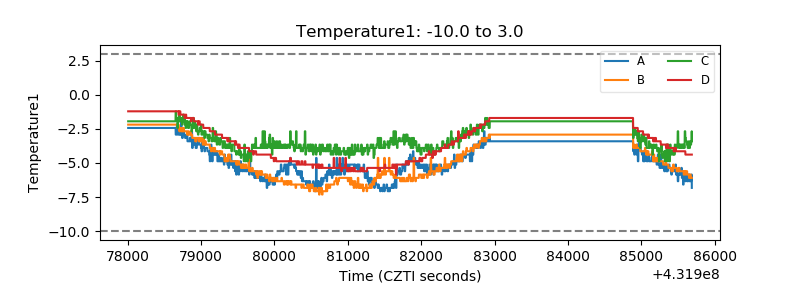 |
| Veto HV Monitor | 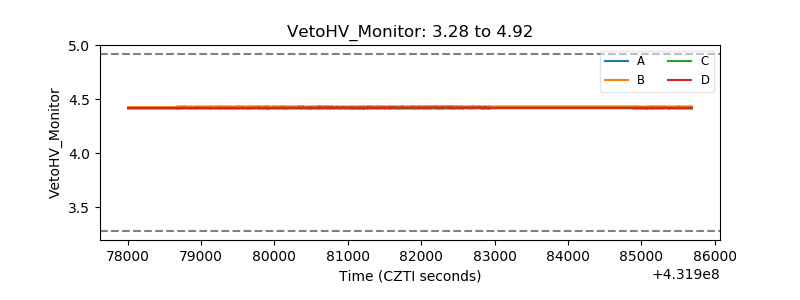 |
| Veto LLD | 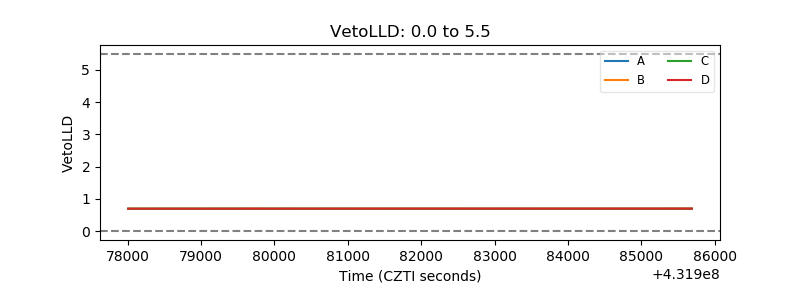 |
| Alpha Counter | 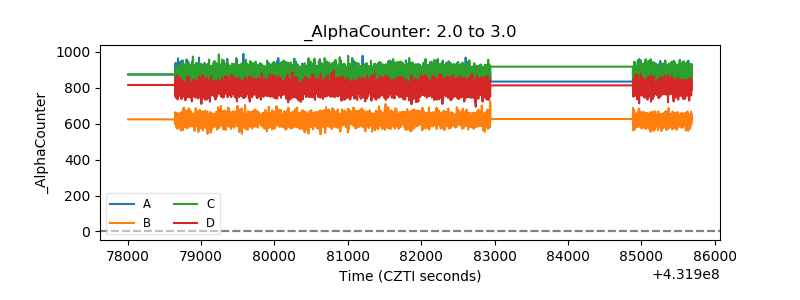 |
| _CPM_Rate | 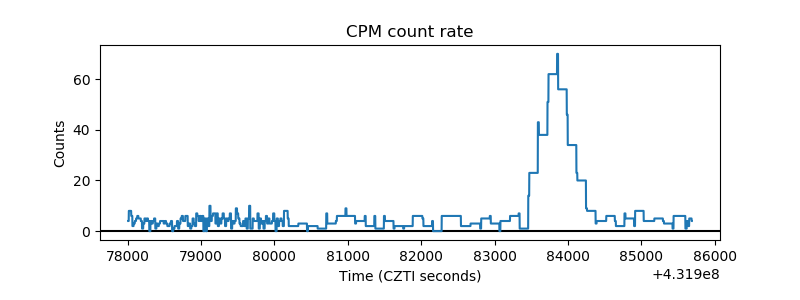 |
| CZT Counter | 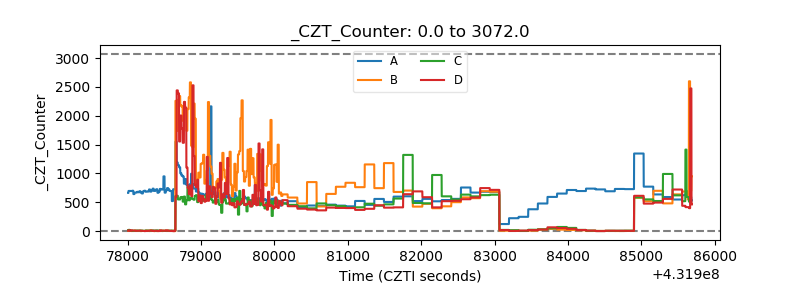 |
| +2.5 Volts monitor | 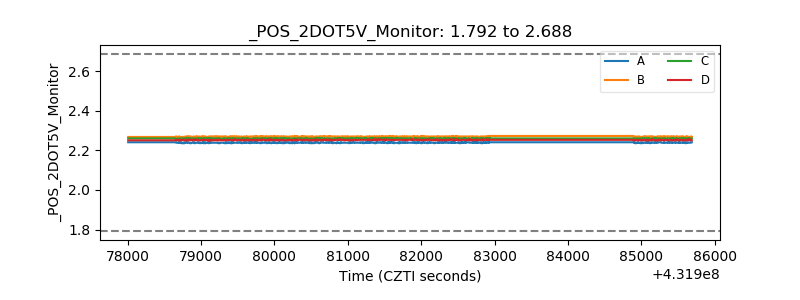 |
| +5 Volts monitor |  |
| _ROLL_ROT | 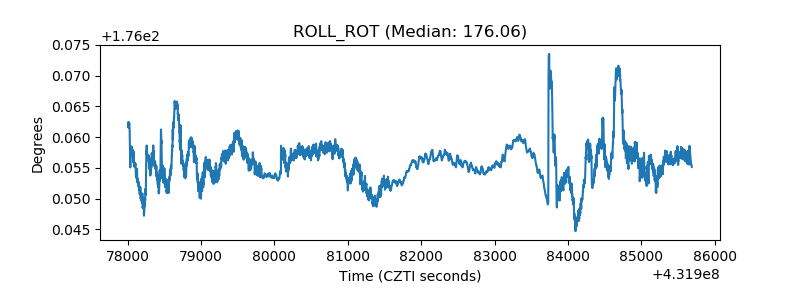 |
| _Roll_DEC | 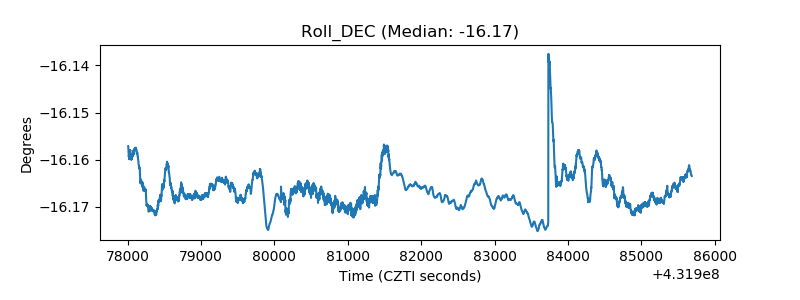 |
| _Roll_RA | 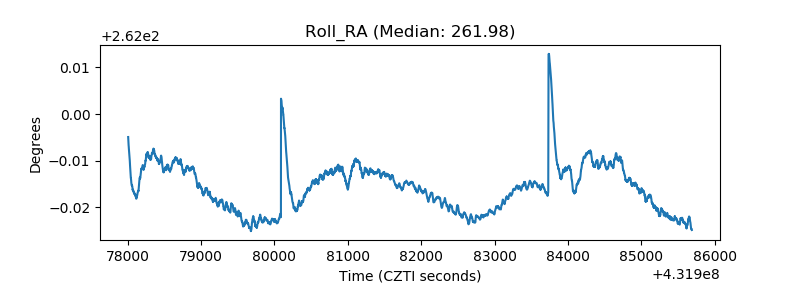 |
| Veto Counter | 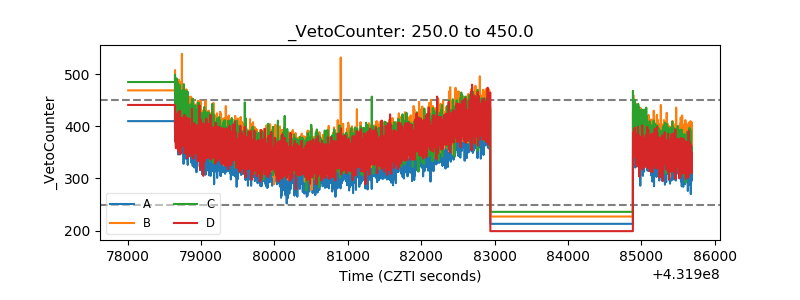 |