| Param | Original file | Final file |
|---|---|---|
| Filename | modeM0/AS1T05_148T01_9000005838_42985cztM0_level2.fits | modeM0/AS1T05_148T01_9000005838_42985cztM0_level2_quad_clean.evt |
| Size (bytes) | 359,150,400 | 112,559,040 |
| Size | 342.5 MB | 107.3 MB |
| Events in quadrant A | 3,284,882 | 790,549 |
| Events in quadrant B | 3,635,320 | 785,021 |
| Events in quadrant C | 2,890,506 | 764,981 |
| Events in quadrant D | 3,057,320 | 684,573 |
| Mode M9 | |||
|---|---|---|---|
| Quadrant | BADHDUFLAG | Total packets | Discarded packets |
| A | 0 | 27 | 0 |
| B | 0 | 28 | 0 |
| C | 0 | 28 | 0 |
| D | 0 | 28 | 0 |
| Mode SS | |||
|---|---|---|---|
| Quadrant | BADHDUFLAG | Total packets | Discarded packets |
| A | 0 | 112 | 0 |
| B | 0 | 112 | 0 |
| C | 0 | 112 | 0 |
| D | 0 | 112 | 0 |
| Mode M0 | |||
|---|---|---|---|
| Quadrant | BADHDUFLAG | Total packets | Discarded packets |
| A | 0 | 13572 | 2 |
| B | 0 | 14508 | 2 |
| C | 0 | 11954 | 2 |
| D | 0 | 12849 | 2 |
| Quadrant | Total seconds | Saturated seconds | Saturation percentage |
|---|---|---|---|
| A | 5480 | 50 | 0.912409% |
| B | 5480 | 208 | 3.795620% |
| C | 5480 | 6 | 0.109489% |
| D | 5480 | 71 | 1.295620% |
Noise dominated data is calculated using 1-second bins in cleaned event files. If a bin has >2000 counts, and if more than 50% of those come from <1% of pixels, then it is considered to be noise-dominated and hence unusable.
| Quadrant | # 1 sec bins | Bins with >0 counts | Bins with >2000 counts | High rate bins dominated by noise | Noise dominated (total time) | Noise dominated (detector-on time) | Marked lightcurve |
|---|---|---|---|---|---|---|---|
| A | 7093 | 5481 | 25 | 25 | 0.35% | 0.46% | 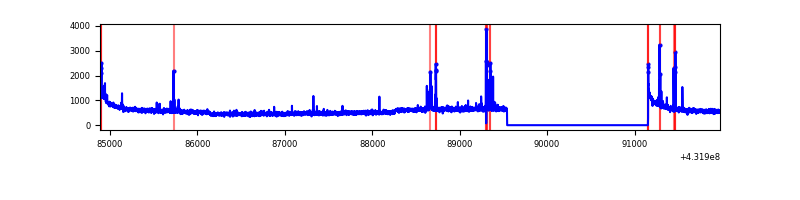 |
| B | 7093 | 5481 | 95 | 95 | 1.34% | 1.73% | 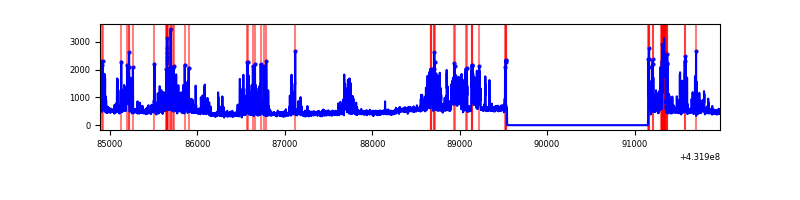 |
| C | 7093 | 5481 | 2 | 2 | 0.03% | 0.04% | 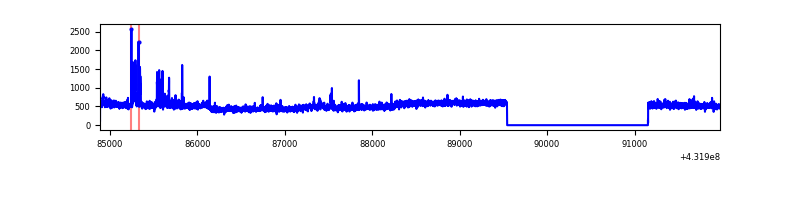 |
| D | 7093 | 5481 | 59 | 59 | 0.83% | 1.08% | 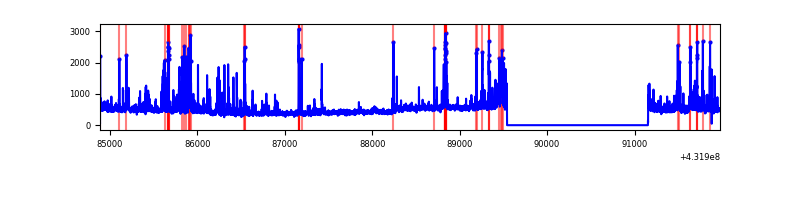 |
Top three noisy pixels from each quadrant. If the there are fewer than three noisy pixels in the level2.evt file, extra rows are filled as -1
| Pixel properties | Quadrant properties | ||||||
|---|---|---|---|---|---|---|---|
| Quadrant | DetID | PixID | Counts | Sigma | Mean | Median | Sigma |
| A | 10 | 83 | 574588 | 3843.57 | 664 | 652 | 149.3 |
| A | 15 | 237 | 124699 | 830.73 | 664 | 652 | 149.3 |
| A | 15 | 222 | 13339 | 84.96 | 664 | 652 | 149.3 |
| B | 4 | 171 | 890414 | 6333.2 | 656 | 639 | 140.5 |
| B | 4 | 81 | 108713 | 769.24 | 656 | 639 | 140.5 |
| B | 5 | 172 | 21718 | 150.04 | 656 | 639 | 140.5 |
| C | 15 | 214 | 224142 | 1340.77 | 649 | 655 | 166.7 |
| C | 14 | 254 | 106093 | 632.56 | 649 | 655 | 166.7 |
| C | 0 | 207 | 15192 | 87.21 | 649 | 655 | 166.7 |
| D | 13 | 249 | 232429 | 1372.47 | 636 | 614 | 168.9 |
| D | 1 | 47 | 206426 | 1218.52 | 636 | 614 | 168.9 |
| D | 1 | 52 | 83900 | 493.1 | 636 | 614 | 168.9 |
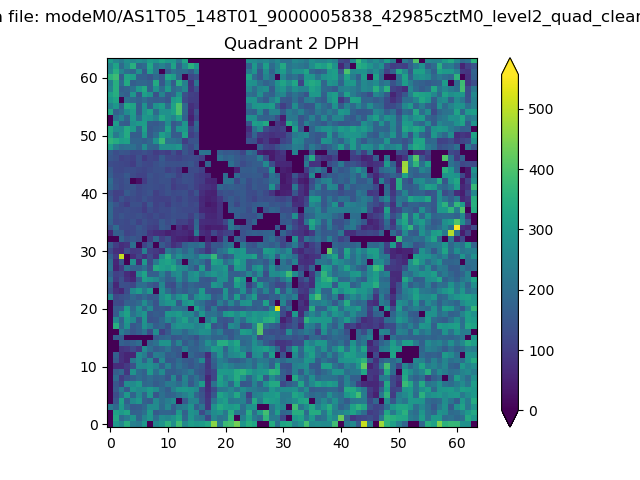
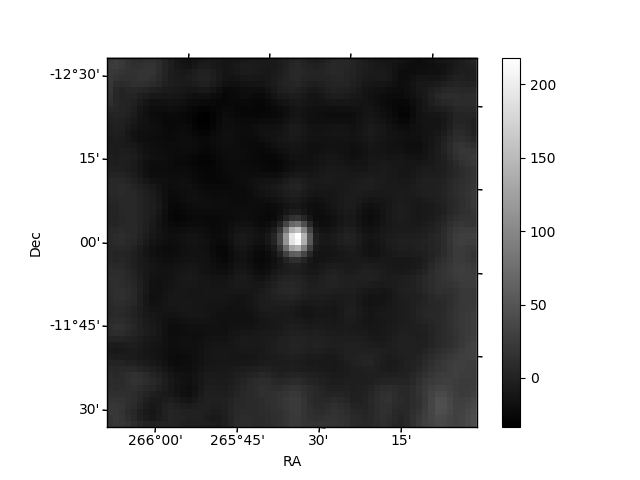
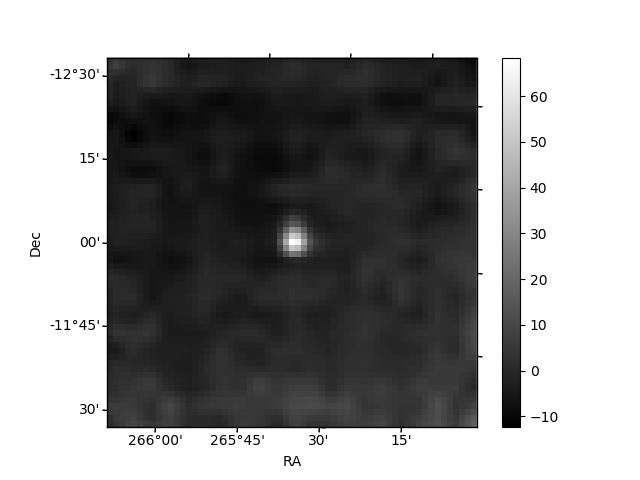
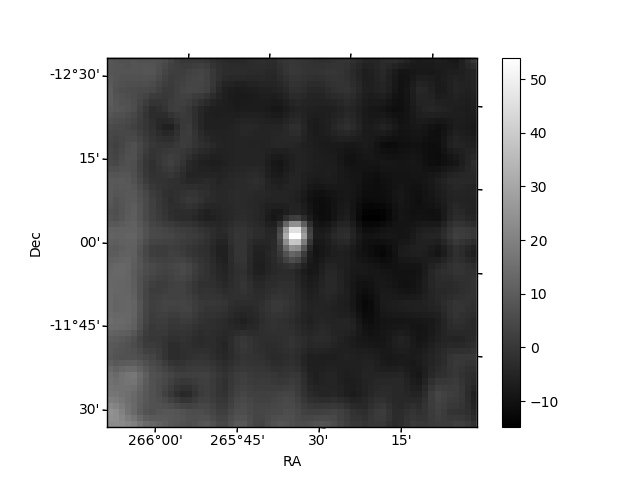
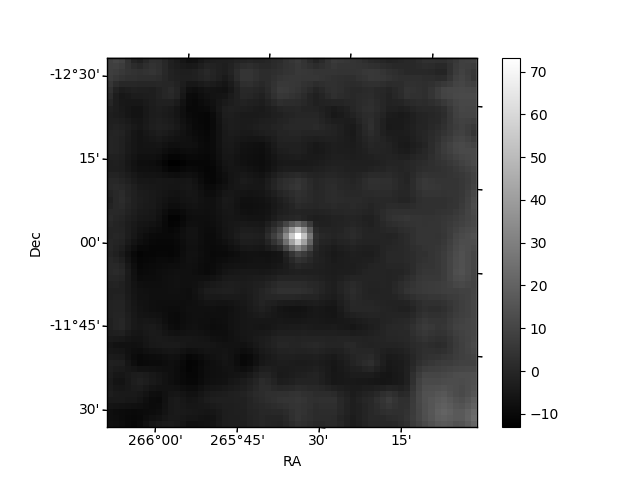
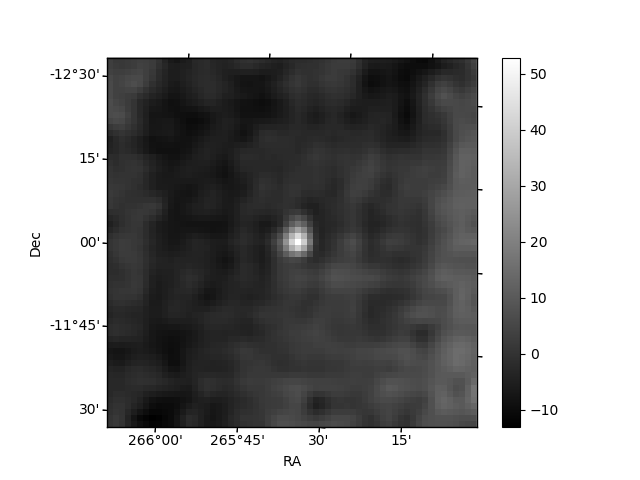
Histogram calculated using DETX and DETY for each event in the final _common_clean file
| Quadrant A | 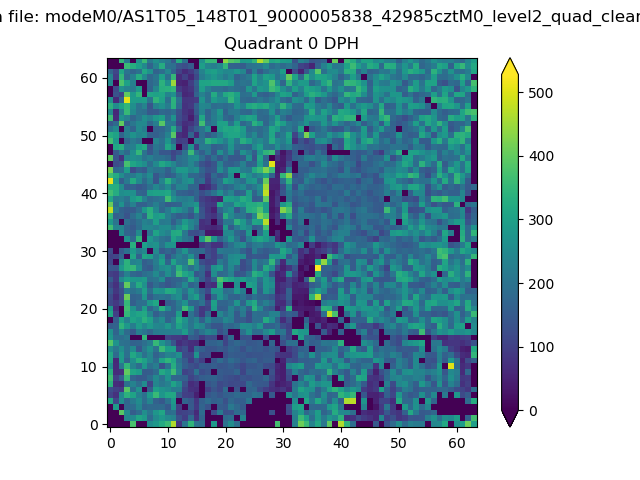 |
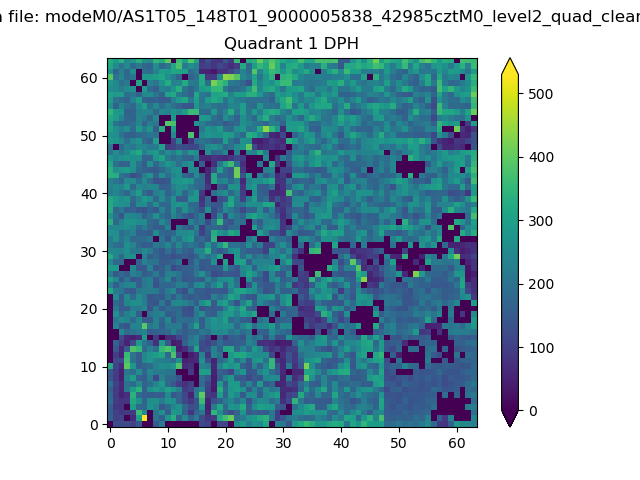 |
Quadrant B |
|---|---|---|---|
| Quadrant D | 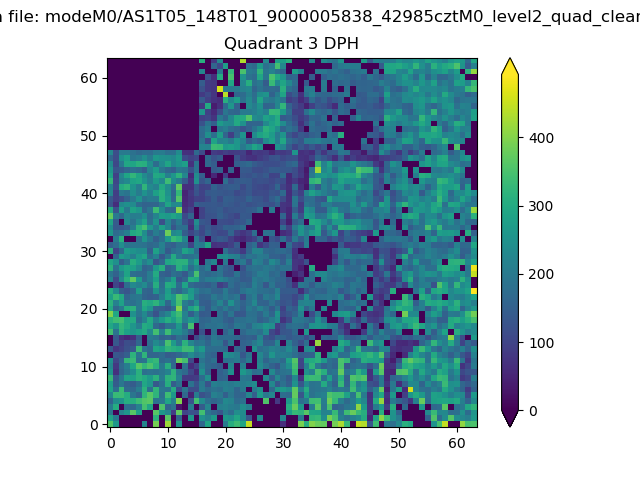 |
 |
Quadrant C |
| Plot type | Count rate plots | Images |
|---|---|---|
| Comparison with Poisson distribution Blue bars denote a histogram of data divided into 1 sec bins. Red curve is a Poisson curve with rate = median count rate of data. |
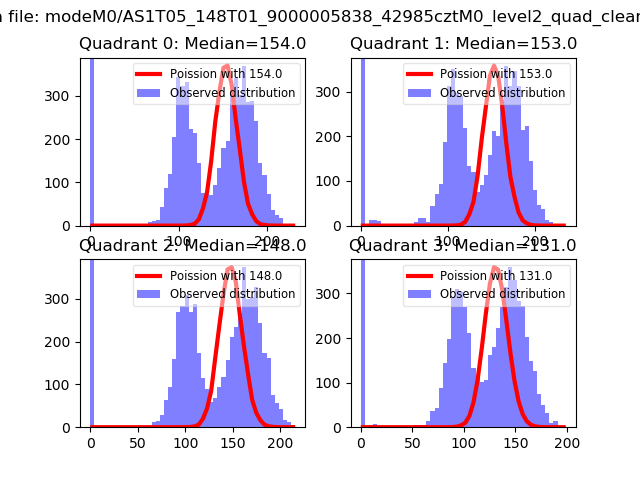 |
 |
| Quadrant-wise count rates Data is divided into 100 sec bins |
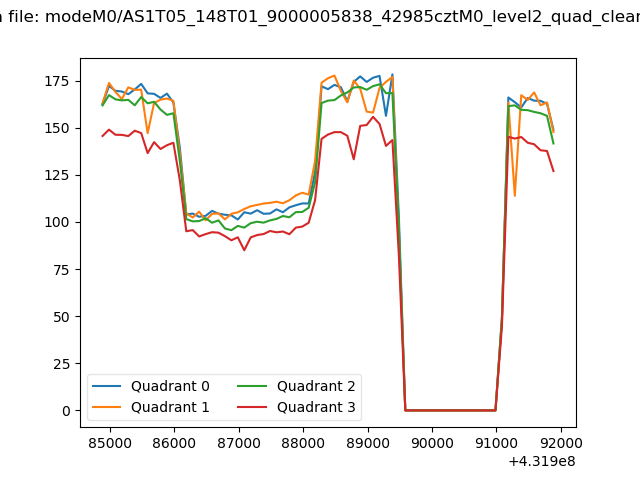 |
|
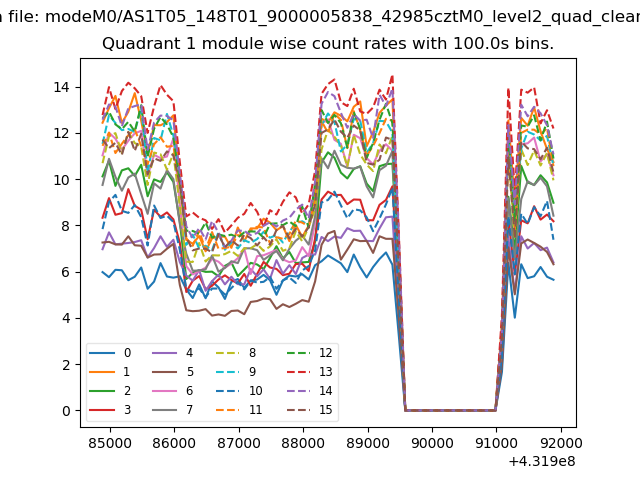
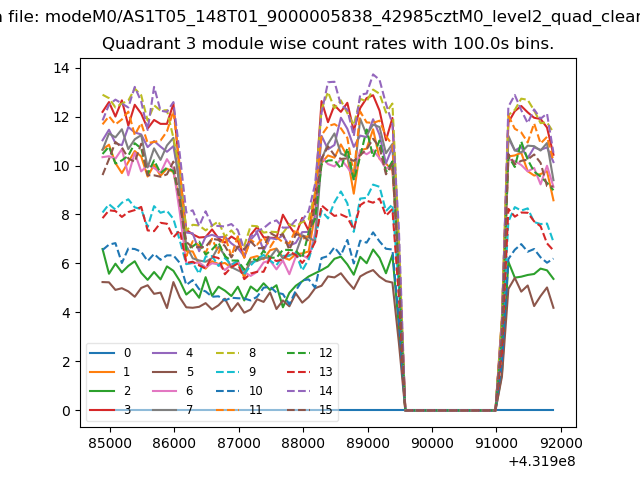
| Module-wise count rates for Quadrant A Data is divided into 100 sec bins |
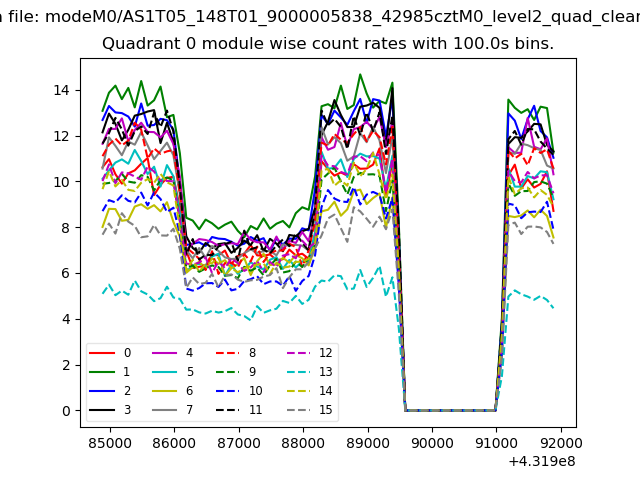 |
 |
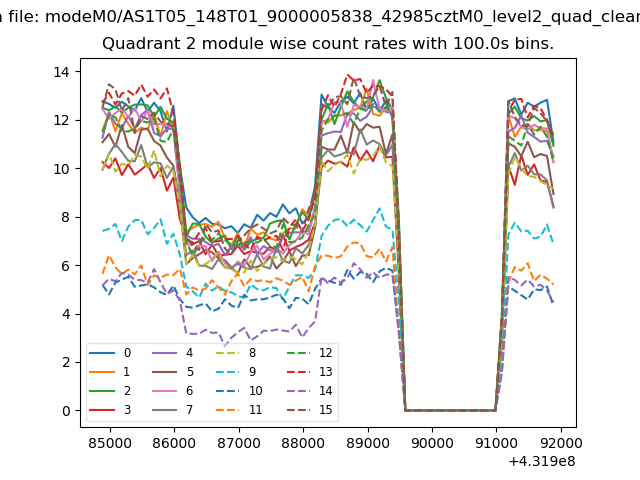
| Module-wise count rates for Quadrant B Data is divided into 100 sec bins |
 |
 |
| Module-wise count rates for Quadrant C Data is divided into 100 sec bins |
 |
 |
| Module-wise count rates for Quadrant D Data is divided into 100 sec bins |
 |
 |
| Parameter | Plot |
|---|---|
| CZT HV Monitor |  |
| D_VDD | 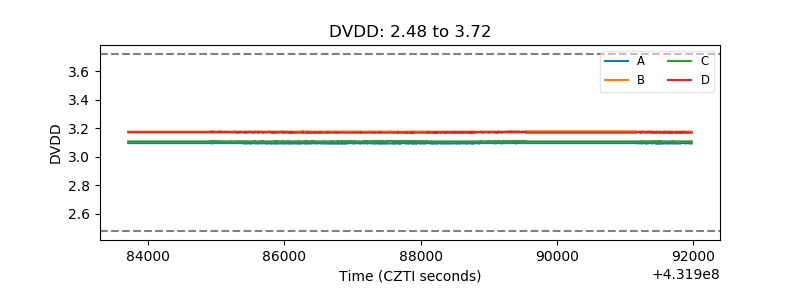 |
| Temperature 1 | 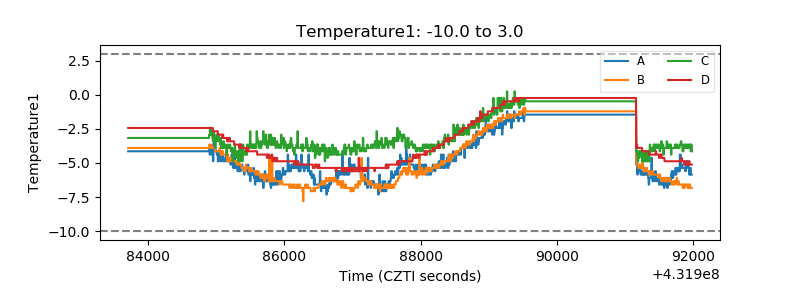 |
| Veto HV Monitor | 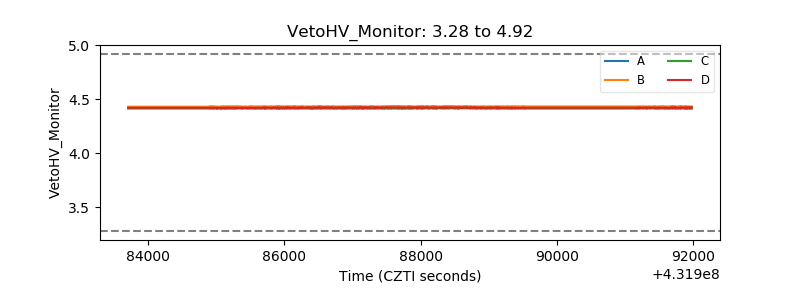 |
| Veto LLD | 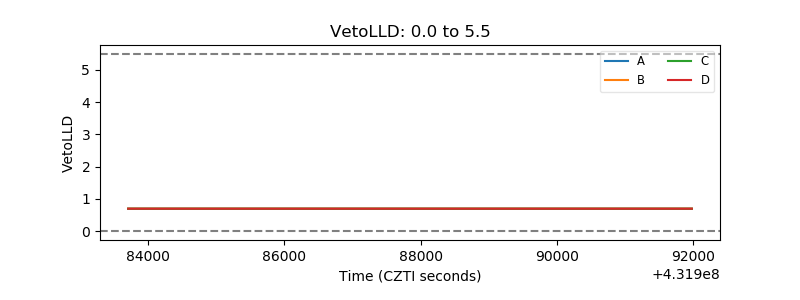 |
| Alpha Counter | 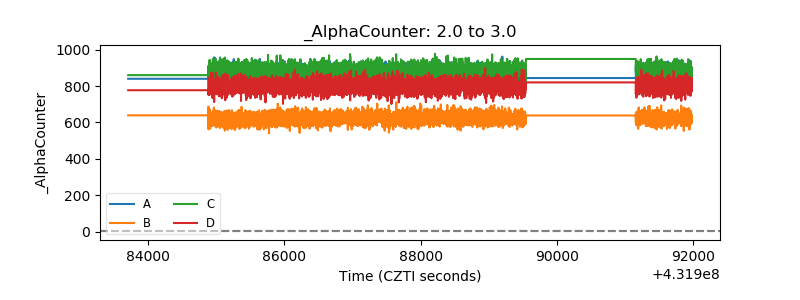 |
| _CPM_Rate | 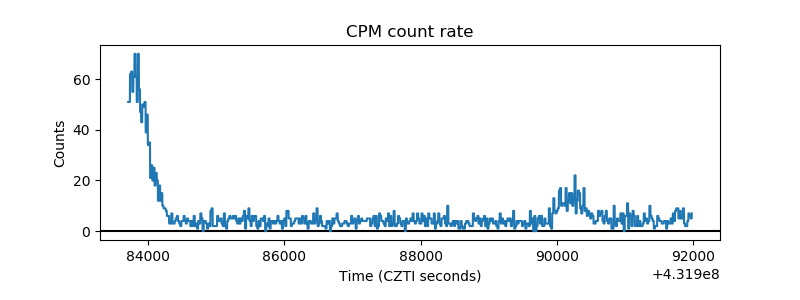 |
| CZT Counter | 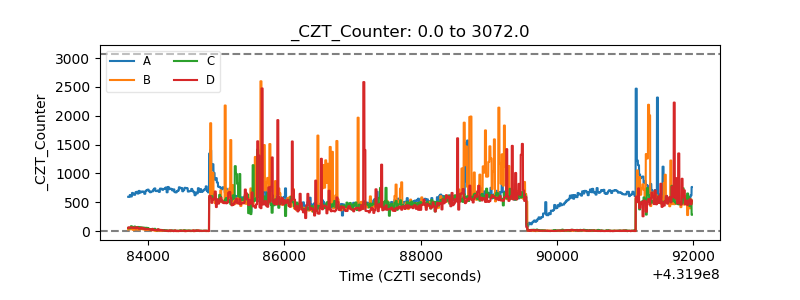 |
| +2.5 Volts monitor | 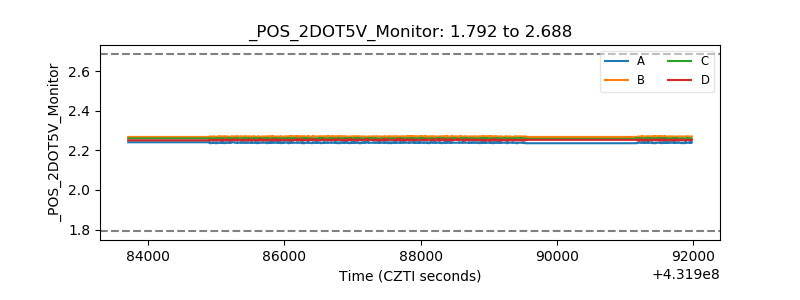 |
| +5 Volts monitor |  |
| _ROLL_ROT | 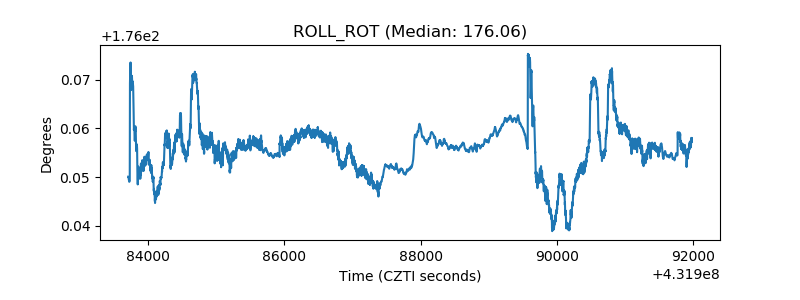 |
| _Roll_DEC |  |
| _Roll_RA | 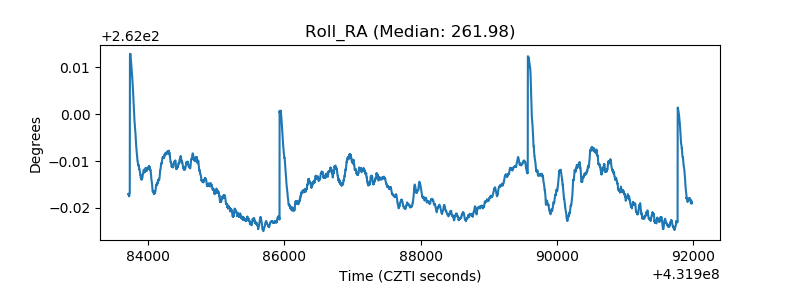 |
| Veto Counter | 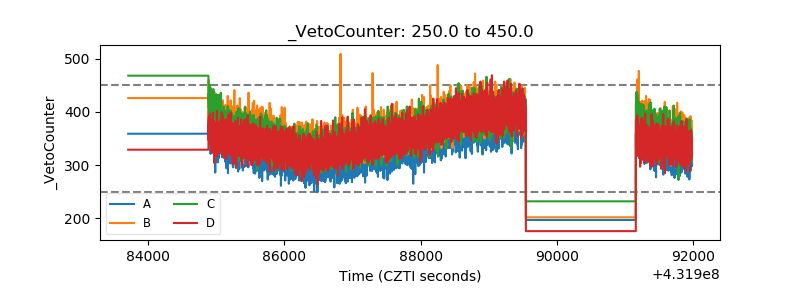 |