| Param | Original file | Final file |
|---|---|---|
| Filename | modeM0/AS1T05_148T01_9000005838_42986cztM0_level2.fits | modeM0/AS1T05_148T01_9000005838_42986cztM0_level2_quad_clean.evt |
| Size (bytes) | 379,949,760 | 117,120,960 |
| Size | 362.3 MB | 111.7 MB |
| Events in quadrant A | 3,456,183 | 824,599 |
| Events in quadrant B | 3,334,452 | 821,365 |
| Events in quadrant C | 2,942,167 | 795,417 |
| Events in quadrant D | 3,874,916 | 694,985 |
| Mode M9 | |||
|---|---|---|---|
| Quadrant | BADHDUFLAG | Total packets | Discarded packets |
| A | 0 | 30 | 0 |
| B | 0 | 30 | 0 |
| C | 0 | 30 | 0 |
| D | 0 | 30 | 0 |
| Mode SS | |||
|---|---|---|---|
| Quadrant | BADHDUFLAG | Total packets | Discarded packets |
| A | 0 | 122 | 0 |
| B | 0 | 122 | 0 |
| C | 0 | 122 | 0 |
| D | 0 | 122 | 0 |
| Mode M0 | |||
|---|---|---|---|
| Quadrant | BADHDUFLAG | Total packets | Discarded packets |
| A | 0 | 14470 | 2 |
| B | 0 | 13788 | 2 |
| C | 0 | 12296 | 2 |
| D | 0 | 15585 | 2 |
| Quadrant | Total seconds | Saturated seconds | Saturation percentage |
|---|---|---|---|
| A | 5872 | 32 | 0.544959% |
| B | 5873 | 112 | 1.907032% |
| C | 5873 | 7 | 0.119190% |
| D | 5873 | 265 | 4.512174% |
Noise dominated data is calculated using 1-second bins in cleaned event files. If a bin has >2000 counts, and if more than 50% of those come from <1% of pixels, then it is considered to be noise-dominated and hence unusable.
| Quadrant | # 1 sec bins | Bins with >0 counts | Bins with >2000 counts | High rate bins dominated by noise | Noise dominated (total time) | Noise dominated (detector-on time) | Marked lightcurve |
|---|---|---|---|---|---|---|---|
| A | 8858 | 5874 | 16 | 16 | 0.18% | 0.27% | 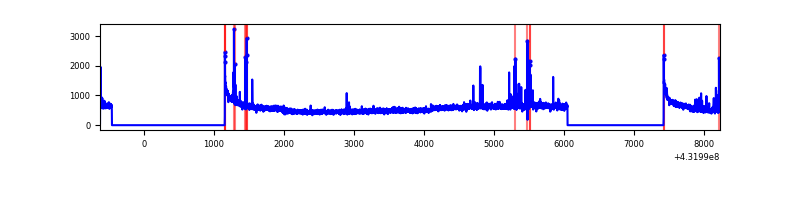 |
| B | 8859 | 5875 | 79 | 79 | 0.89% | 1.34% | 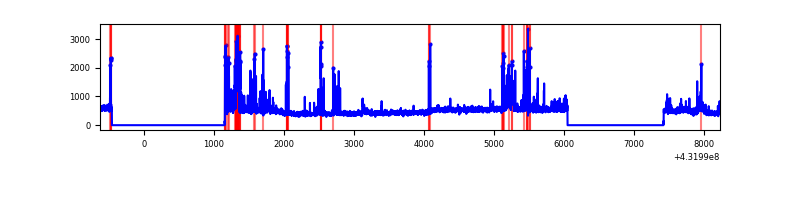 |
| C | 8859 | 5875 | 1 | 1 | 0.01% | 0.02% | 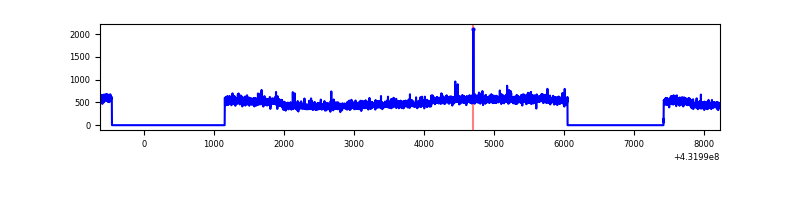 |
| D | 8859 | 5875 | 220 | 220 | 2.48% | 3.74% | 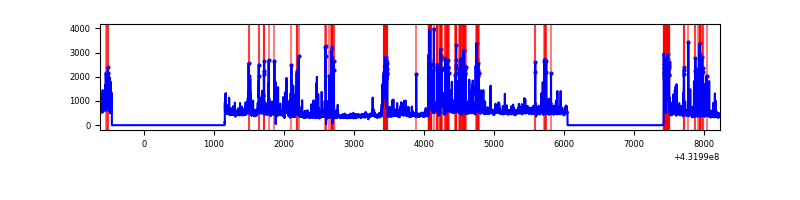 |
Top three noisy pixels from each quadrant. If the there are fewer than three noisy pixels in the level2.evt file, extra rows are filled as -1
| Pixel properties | Quadrant properties | ||||||
|---|---|---|---|---|---|---|---|
| Quadrant | DetID | PixID | Counts | Sigma | Mean | Median | Sigma |
| A | 10 | 83 | 593903 | 3804.88 | 709 | 697 | 155.9 |
| A | 15 | 237 | 78515 | 499.13 | 709 | 697 | 155.9 |
| A | 15 | 222 | 39262 | 247.36 | 709 | 697 | 155.9 |
| B | 4 | 81 | 280489 | 1904.08 | 701 | 686 | 146.9 |
| B | 4 | 171 | 213340 | 1447.12 | 701 | 686 | 146.9 |
| B | 5 | 172 | 61746 | 415.52 | 701 | 686 | 146.9 |
| C | 15 | 214 | 237853 | 1366.03 | 691 | 698 | 173.6 |
| C | 14 | 254 | 5157 | 25.68 | 691 | 698 | 173.6 |
| C | 13 | 61 | 4535 | 22.1 | 691 | 698 | 173.6 |
| D | 13 | 249 | 595818 | 3347.69 | 674 | 652 | 177.8 |
| D | 1 | 52 | 405396 | 2276.6 | 674 | 652 | 177.8 |
| D | 1 | 47 | 190344 | 1066.98 | 674 | 652 | 177.8 |
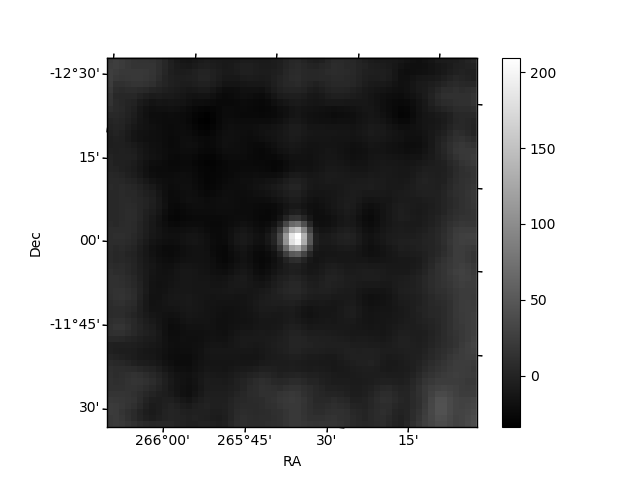
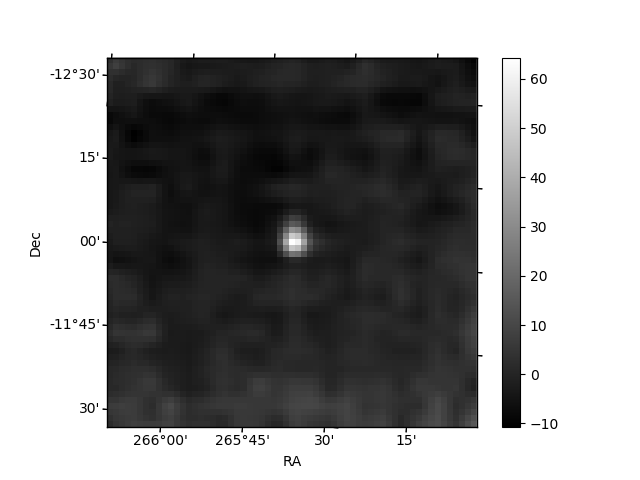
Histogram calculated using DETX and DETY for each event in the final _common_clean file
| Quadrant A | 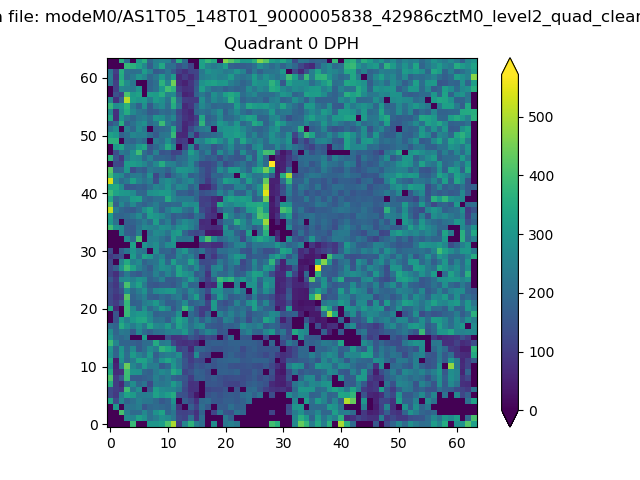 |
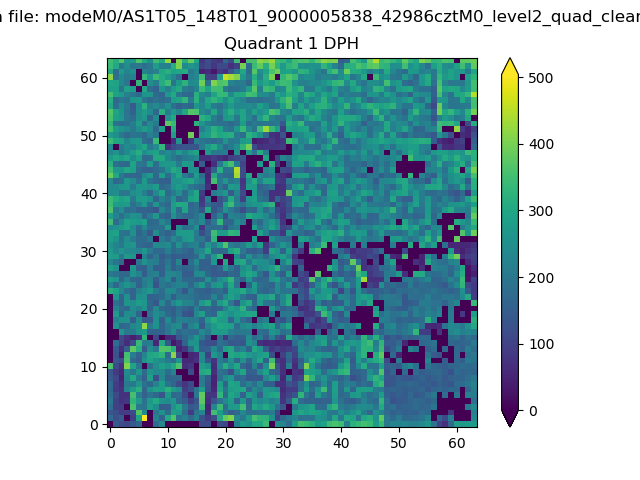 |
Quadrant B |
|---|---|---|---|
| Quadrant D | 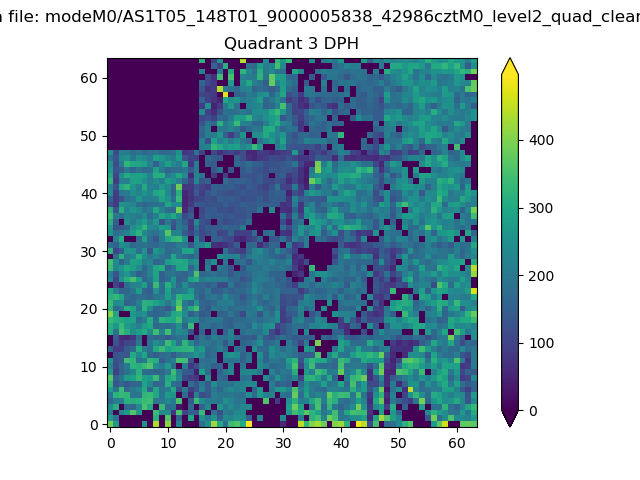 |
 |
Quadrant C |
| Plot type | Count rate plots | Images |
|---|---|---|
| Comparison with Poisson distribution Blue bars denote a histogram of data divided into 1 sec bins. Red curve is a Poisson curve with rate = median count rate of data. |
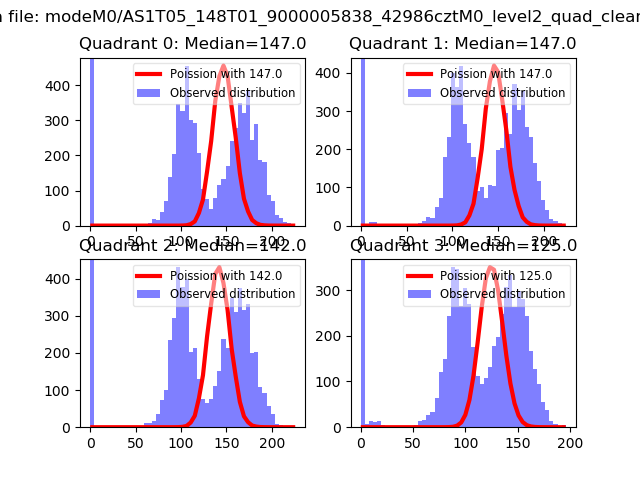 |
 |
| Quadrant-wise count rates Data is divided into 100 sec bins |
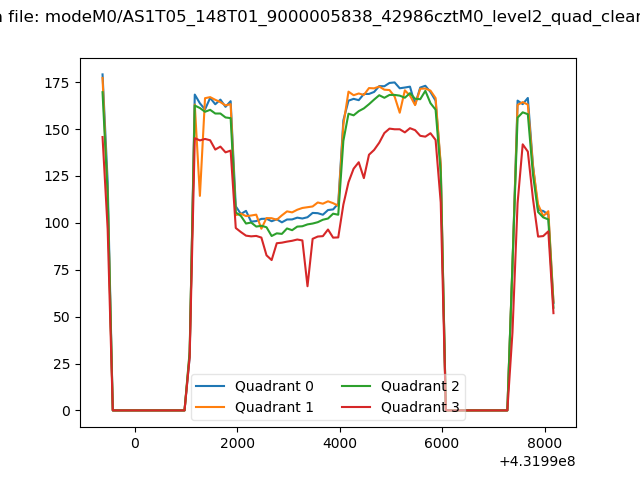 |
|
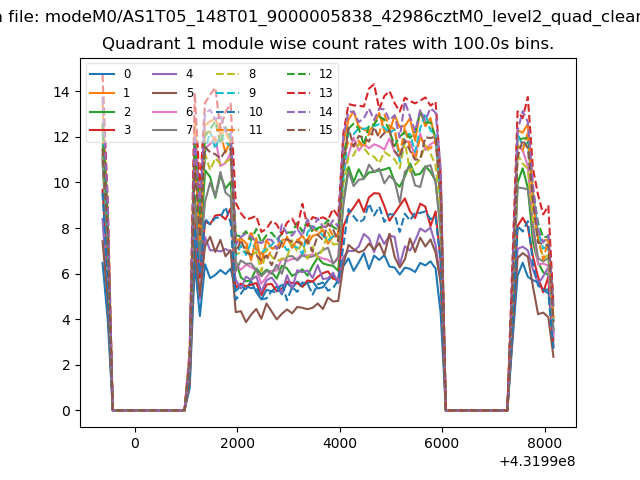
| Module-wise count rates for Quadrant A Data is divided into 100 sec bins |
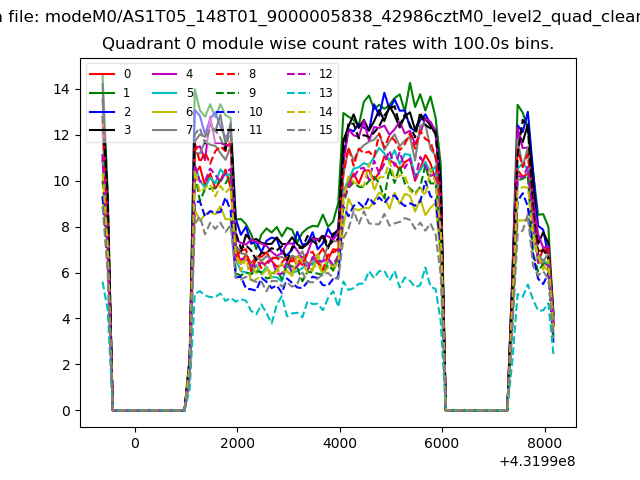 |
 |
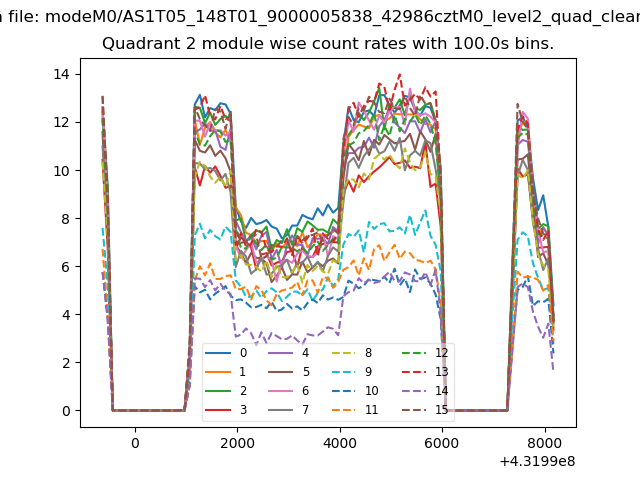
| Module-wise count rates for Quadrant B Data is divided into 100 sec bins |
 |
 |
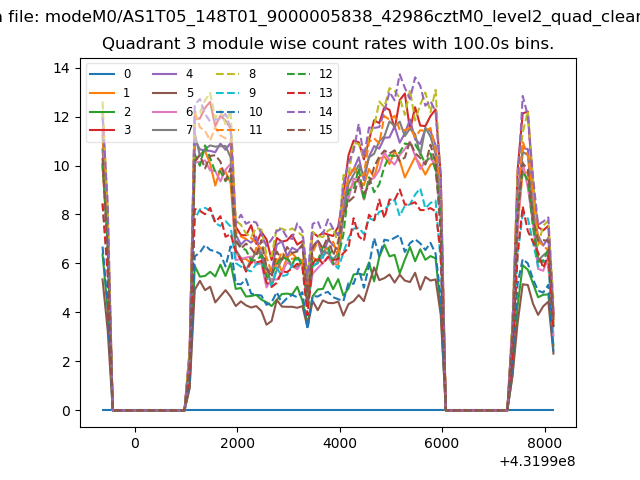
| Module-wise count rates for Quadrant C Data is divided into 100 sec bins |
 |
 |
| Module-wise count rates for Quadrant D Data is divided into 100 sec bins |
 |
 |
| Parameter | Plot |
|---|---|
| CZT HV Monitor | 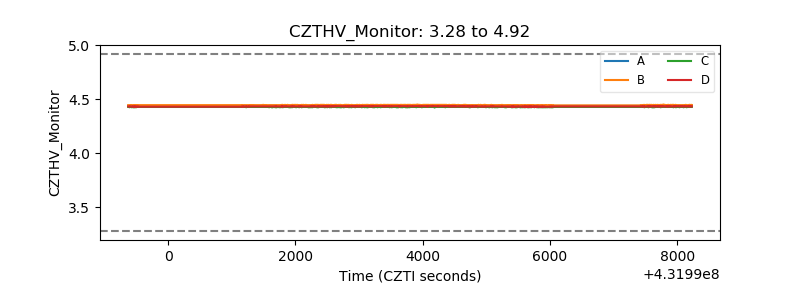 |
| D_VDD | 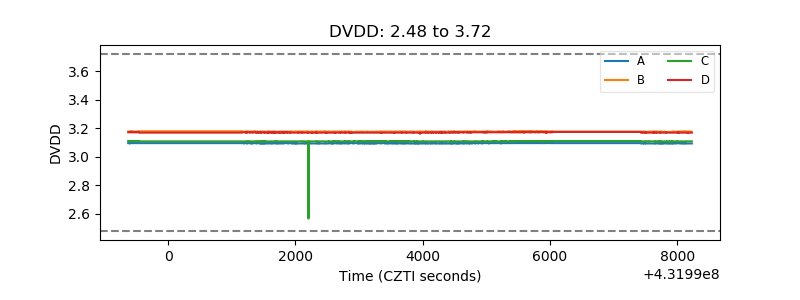 |
| Temperature 1 | 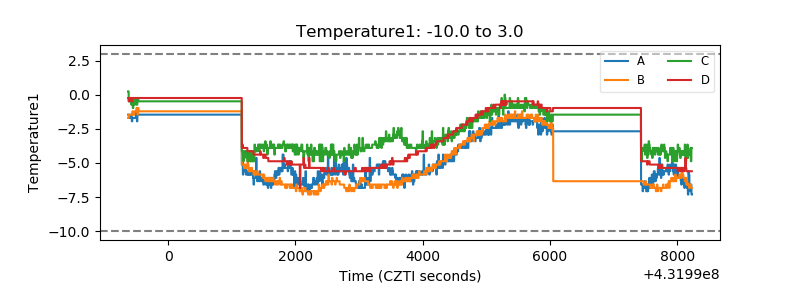 |
| Veto HV Monitor | 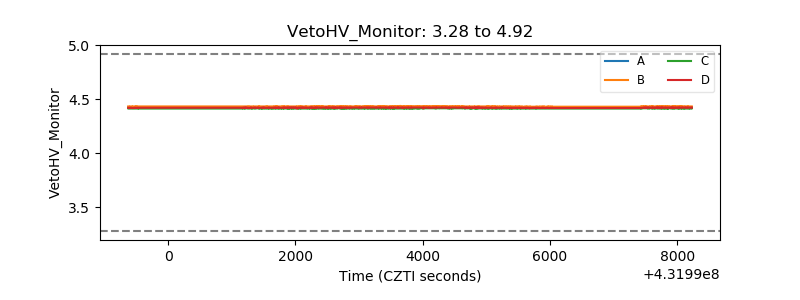 |
| Veto LLD | 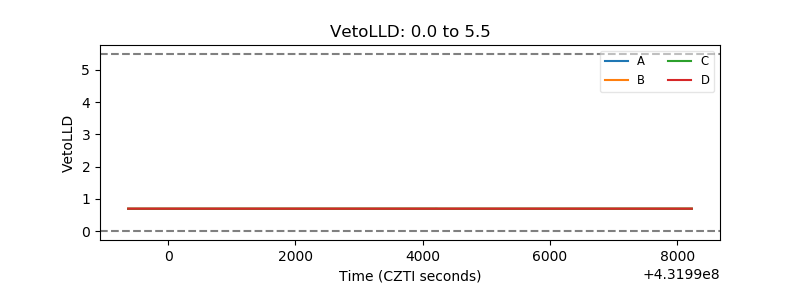 |
| Alpha Counter | 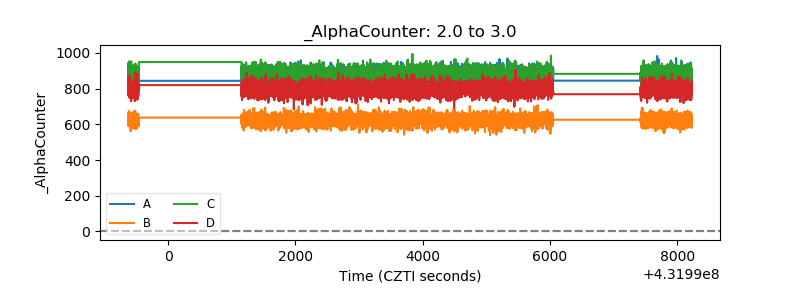 |
| _CPM_Rate | 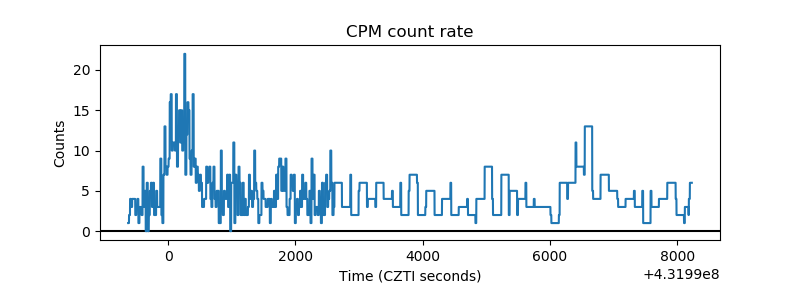 |
| CZT Counter | 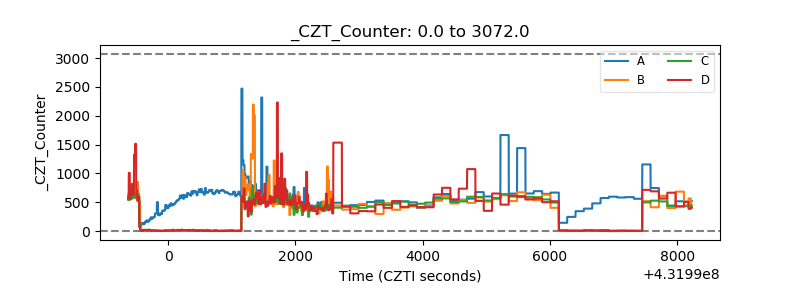 |
| +2.5 Volts monitor | 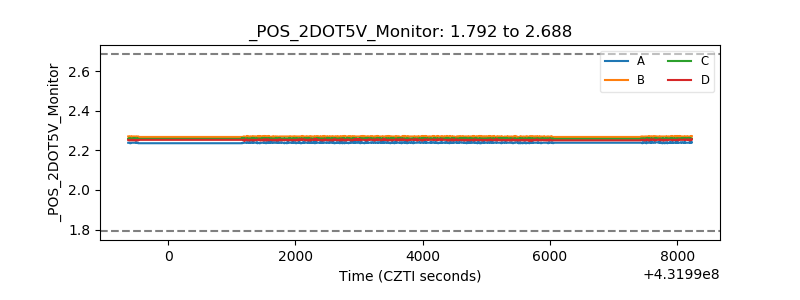 |
| +5 Volts monitor | 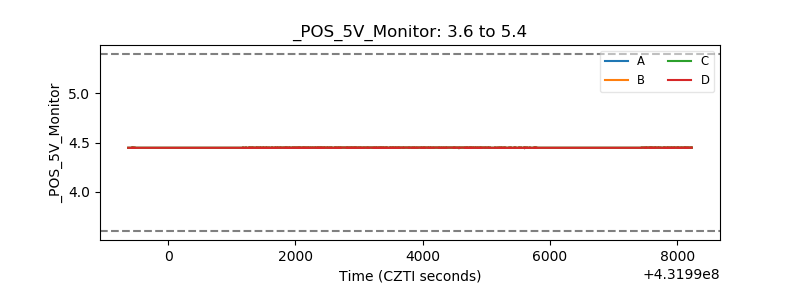 |
| _ROLL_ROT | 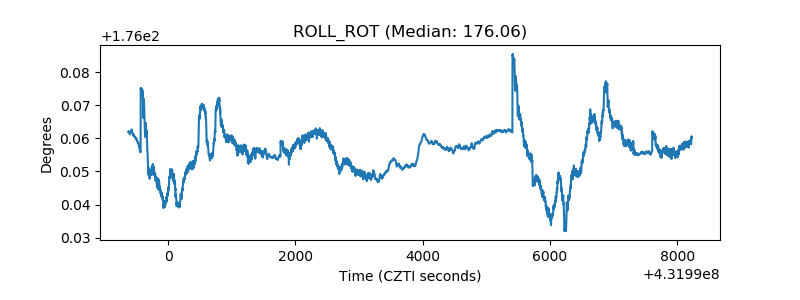 |
| _Roll_DEC | 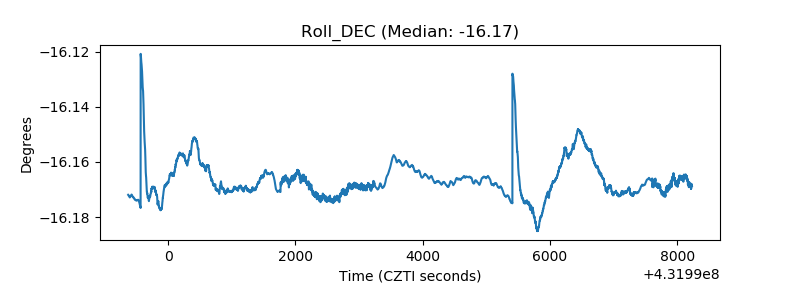 |
| _Roll_RA | 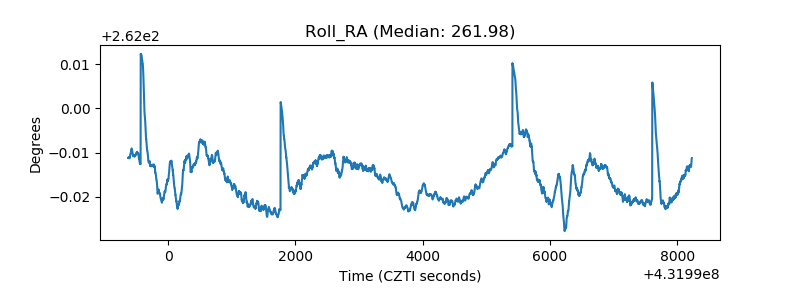 |
| Veto Counter | 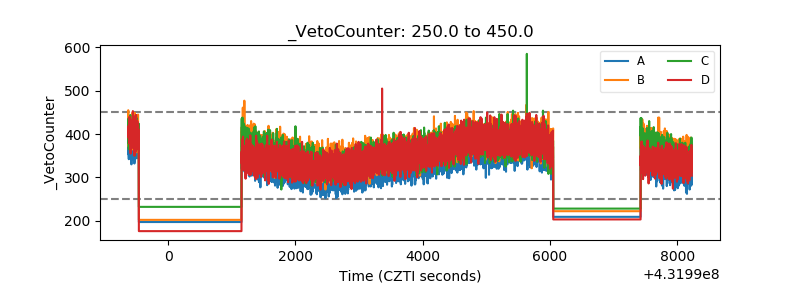 |