| Param | Original file | Final file |
|---|---|---|
| Filename | modeM0/AS1T05_148T01_9000005838_42987cztM0_level2.fits | modeM0/AS1T05_148T01_9000005838_42987cztM0_level2_quad_clean.evt |
| Size (bytes) | 368,187,840 | 113,374,080 |
| Size | 351.1 MB | 108.1 MB |
| Events in quadrant A | 3,483,991 | 789,933 |
| Events in quadrant B | 3,164,786 | 796,357 |
| Events in quadrant C | 2,921,360 | 765,245 |
| Events in quadrant D | 3,598,850 | 668,720 |
| Mode M9 | |||
|---|---|---|---|
| Quadrant | BADHDUFLAG | Total packets | Discarded packets |
| A | 0 | 25 | 0 |
| B | 0 | 26 | 0 |
| C | 0 | 26 | 0 |
| D | 0 | 26 | 0 |
| Mode SS | |||
|---|---|---|---|
| Quadrant | BADHDUFLAG | Total packets | Discarded packets |
| A | 0 | 120 | 0 |
| B | 0 | 120 | 0 |
| C | 0 | 120 | 0 |
| D | 0 | 120 | 0 |
| Mode M0 | |||
|---|---|---|---|
| Quadrant | BADHDUFLAG | Total packets | Discarded packets |
| A | 0 | 14416 | 3 |
| B | 0 | 13215 | 2 |
| C | 0 | 12219 | 2 |
| D | 0 | 14843 | 2 |
| Quadrant | Total seconds | Saturated seconds | Saturation percentage |
|---|---|---|---|
| A | 5912 | 33 | 0.558187% |
| B | 5912 | 73 | 1.234777% |
| C | 5912 | 3 | 0.050744% |
| D | 5912 | 239 | 4.042625% |
Noise dominated data is calculated using 1-second bins in cleaned event files. If a bin has >2000 counts, and if more than 50% of those come from <1% of pixels, then it is considered to be noise-dominated and hence unusable.
| Quadrant | # 1 sec bins | Bins with >0 counts | Bins with >2000 counts | High rate bins dominated by noise | Noise dominated (total time) | Noise dominated (detector-on time) | Marked lightcurve |
|---|---|---|---|---|---|---|---|
| A | 7195 | 5913 | 26 | 26 | 0.36% | 0.44% | 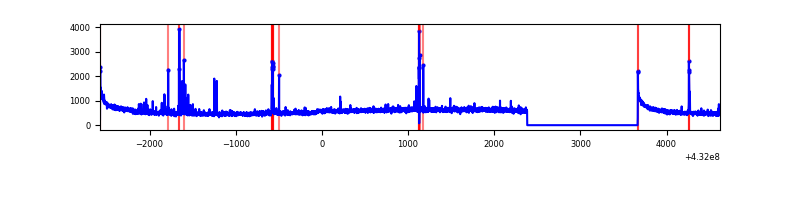 |
| B | 7195 | 5913 | 25 | 25 | 0.35% | 0.42% | 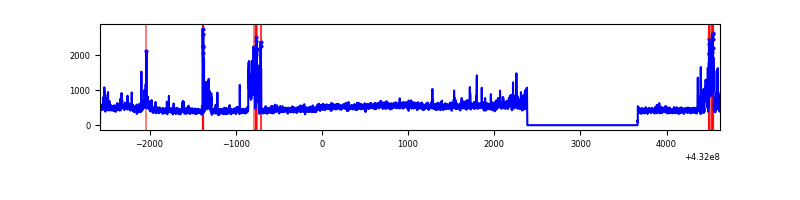 |
| C | 7195 | 5913 | 0 | 0 | 0.00% | 0.00% | 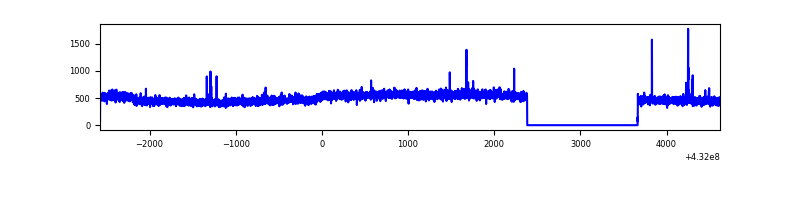 |
| D | 7195 | 5913 | 218 | 218 | 3.03% | 3.69% | 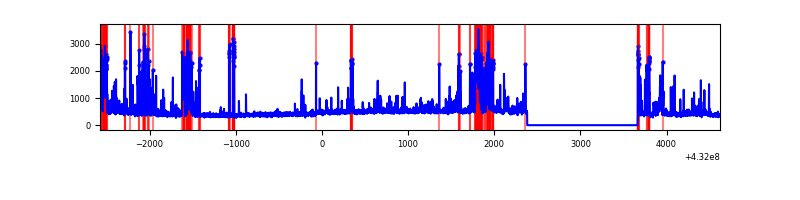 |
Top three noisy pixels from each quadrant. If the there are fewer than three noisy pixels in the level2.evt file, extra rows are filled as -1
| Pixel properties | Quadrant properties | ||||||
|---|---|---|---|---|---|---|---|
| Quadrant | DetID | PixID | Counts | Sigma | Mean | Median | Sigma |
| A | 10 | 83 | 612773 | 4026.19 | 699 | 690 | 152.0 |
| A | 15 | 237 | 85960 | 560.89 | 699 | 690 | 152.0 |
| A | 15 | 222 | 71411 | 465.19 | 699 | 690 | 152.0 |
| B | 4 | 81 | 372537 | 2584.77 | 697 | 683 | 143.9 |
| B | 4 | 171 | 31040 | 211.01 | 697 | 683 | 143.9 |
| B | 0 | 186 | 19751 | 132.54 | 697 | 683 | 143.9 |
| C | 15 | 214 | 241600 | 1429.44 | 682 | 686 | 168.5 |
| C | 2 | 16 | 11218 | 62.49 | 682 | 686 | 168.5 |
| C | 15 | 111 | 6846 | 36.55 | 682 | 686 | 168.5 |
| D | 13 | 249 | 687909 | 3990.09 | 665 | 645 | 172.2 |
| D | 1 | 52 | 149947 | 866.81 | 665 | 645 | 172.2 |
| D | 1 | 47 | 94928 | 547.38 | 665 | 645 | 172.2 |
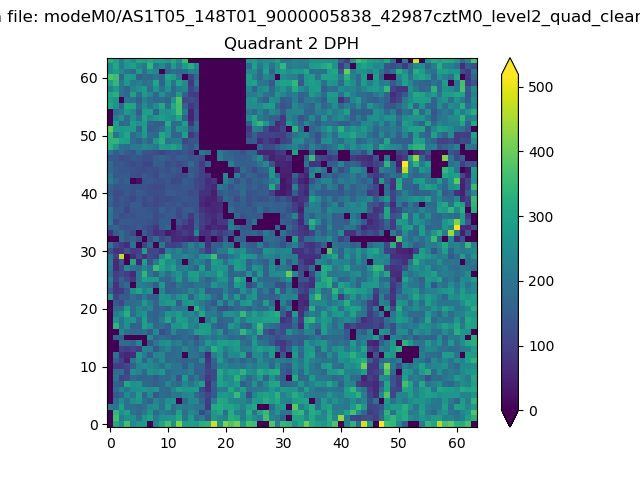
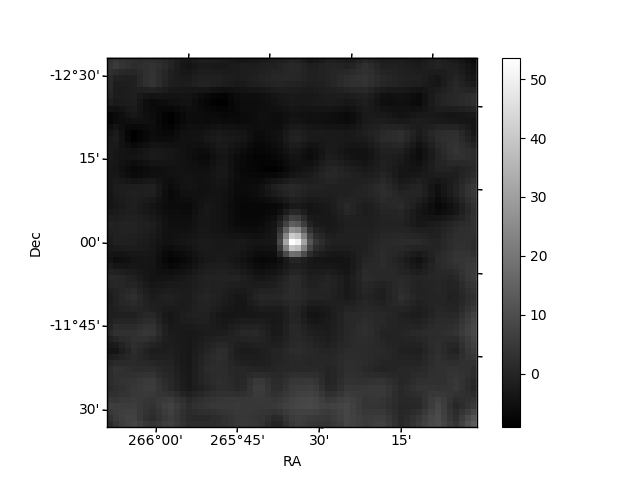
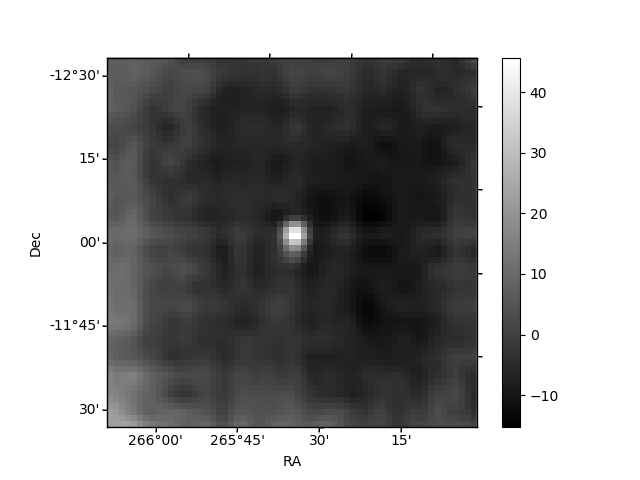
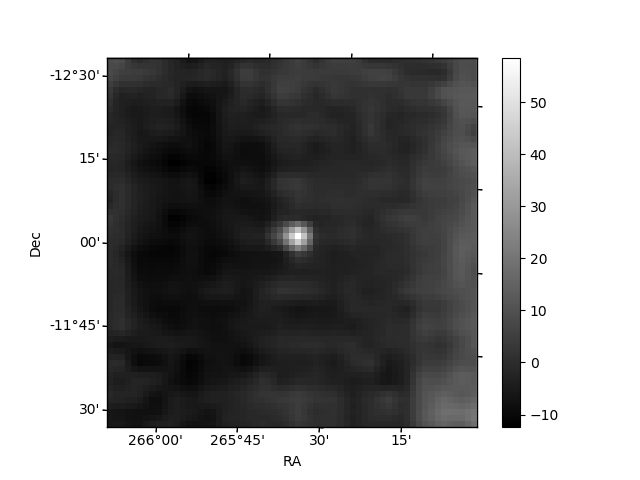
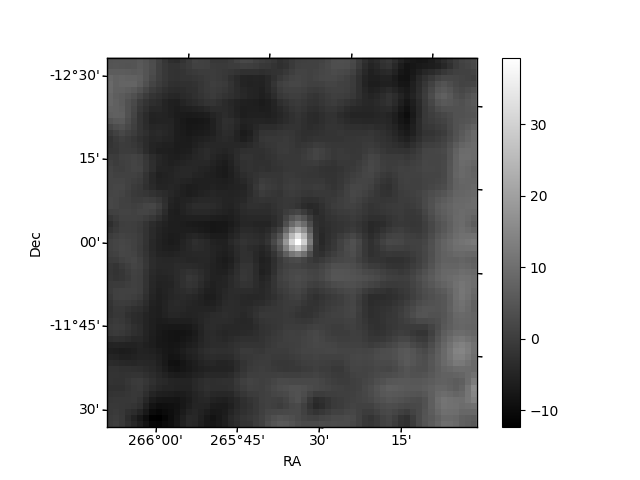
Histogram calculated using DETX and DETY for each event in the final _common_clean file
| Quadrant A | 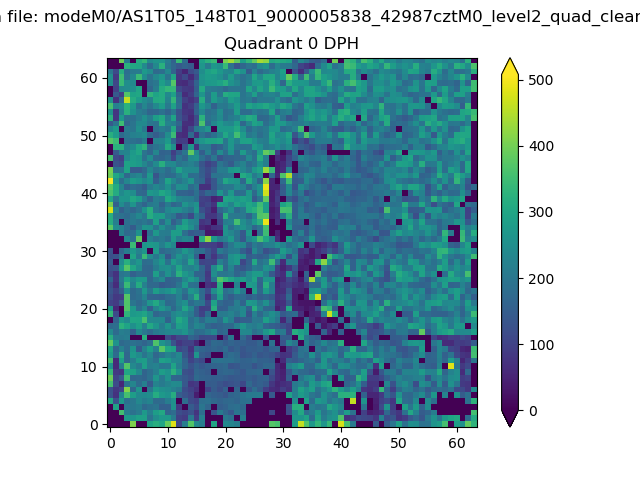 |
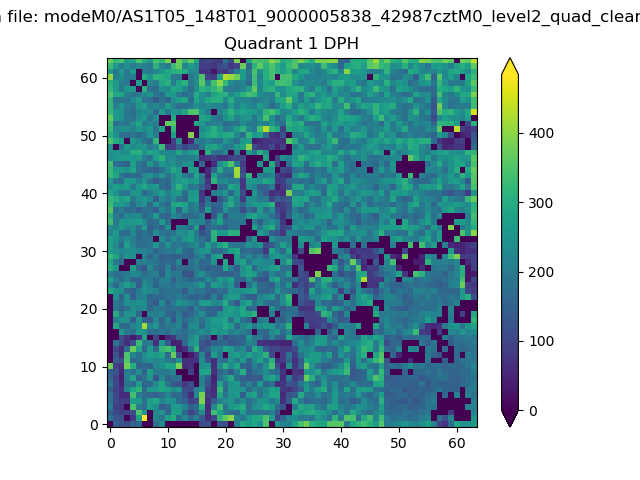 |
Quadrant B |
|---|---|---|---|
| Quadrant D | 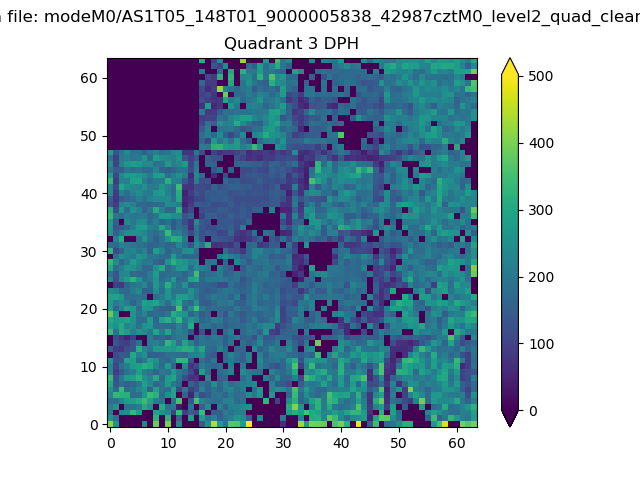 |
 |
Quadrant C |
| Plot type | Count rate plots | Images |
|---|---|---|
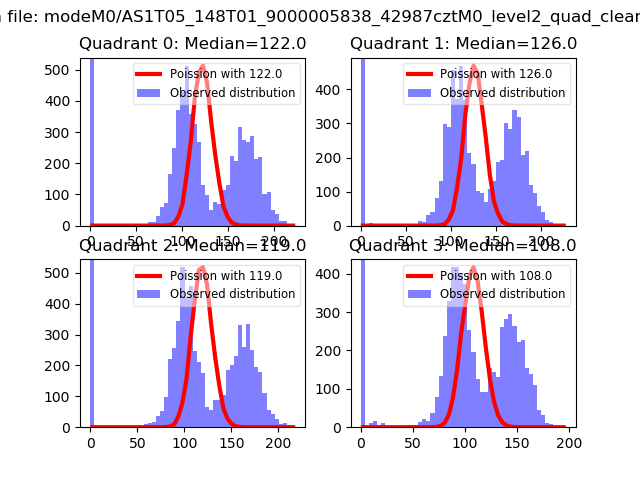
| Comparison with Poisson distribution Blue bars denote a histogram of data divided into 1 sec bins. Red curve is a Poisson curve with rate = median count rate of data. |
 |
 |
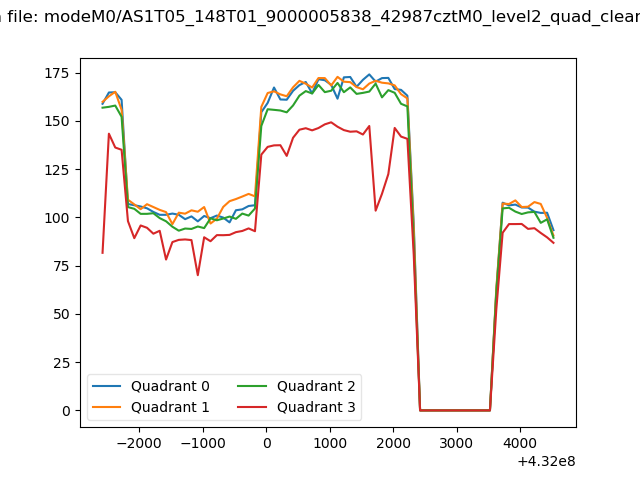
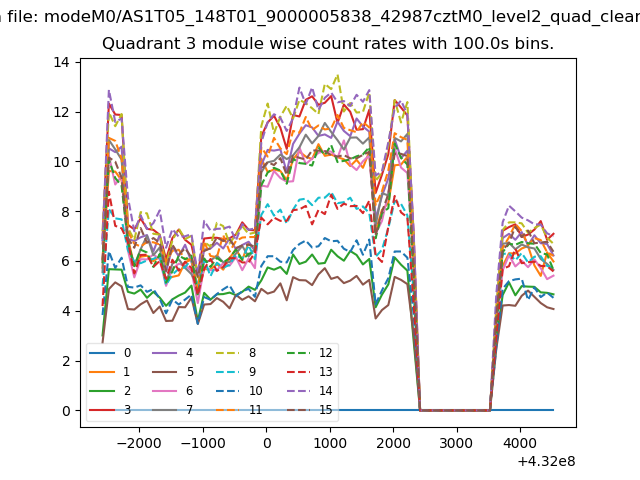
| Quadrant-wise count rates Data is divided into 100 sec bins |
 |
|
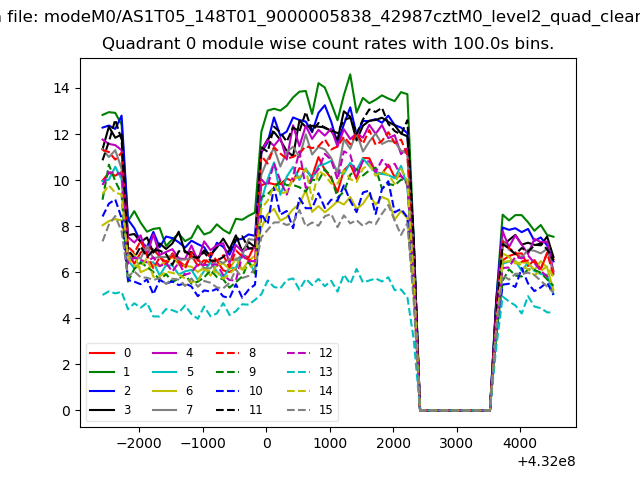
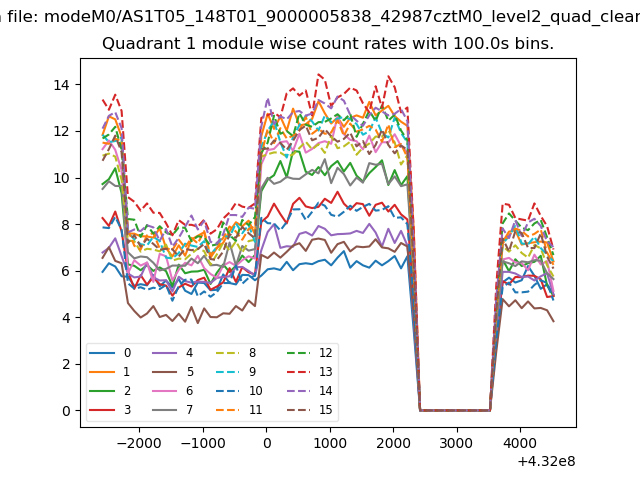
| Module-wise count rates for Quadrant A Data is divided into 100 sec bins |
 |
 |
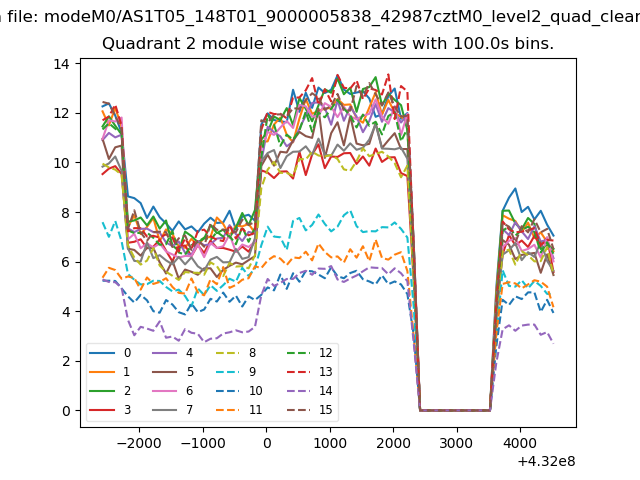
| Module-wise count rates for Quadrant B Data is divided into 100 sec bins |
 |
 |
| Module-wise count rates for Quadrant C Data is divided into 100 sec bins |
 |
 |
| Module-wise count rates for Quadrant D Data is divided into 100 sec bins |
 |
 |
| Parameter | Plot |
|---|---|
| CZT HV Monitor | 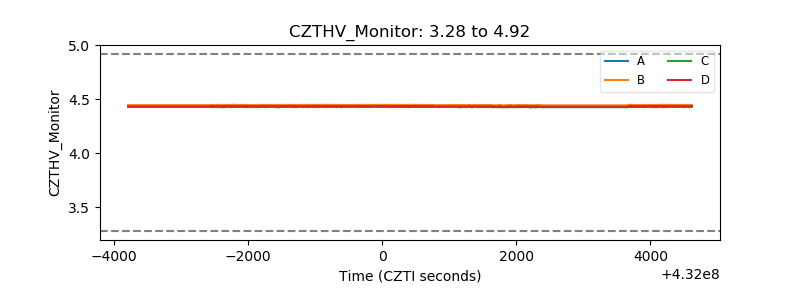 |
| D_VDD | 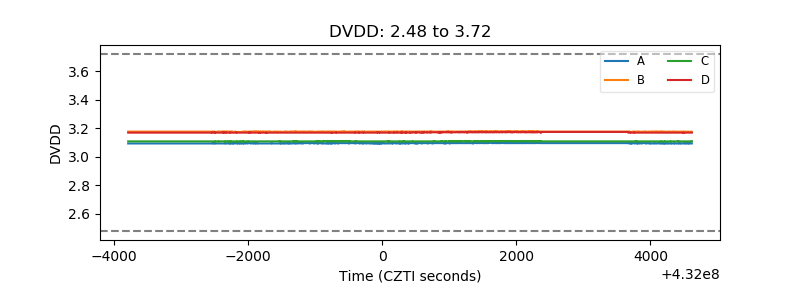 |
| Temperature 1 | 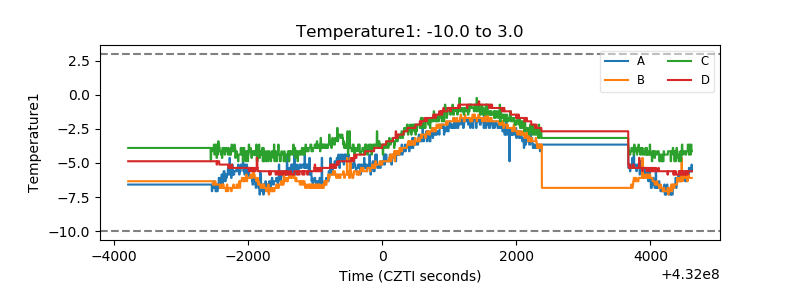 |
| Veto HV Monitor | 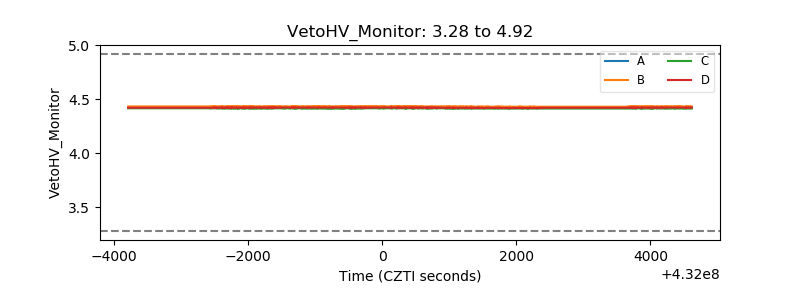 |
| Veto LLD | 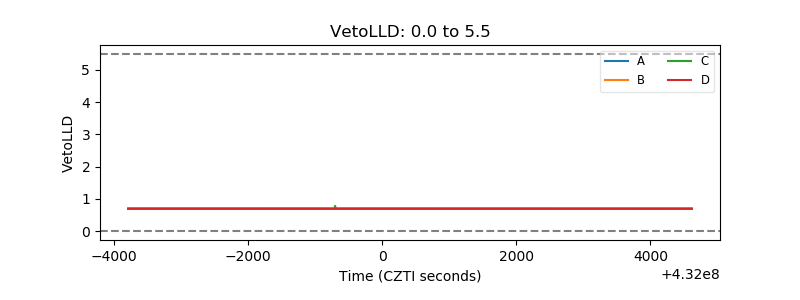 |
| Alpha Counter | 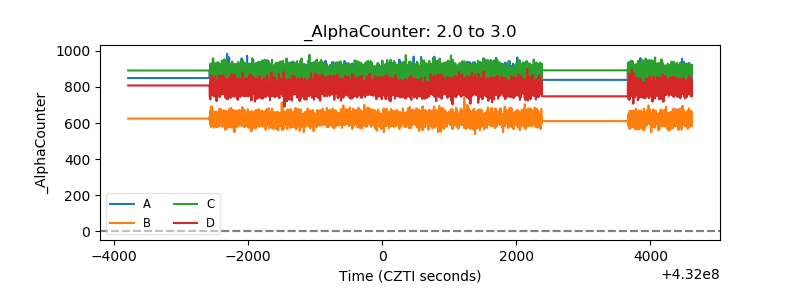 |
| _CPM_Rate | 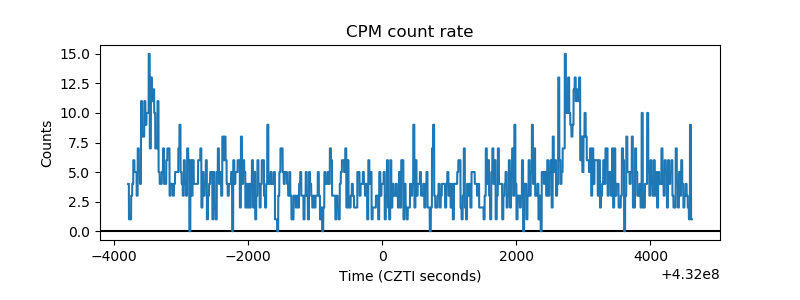 |
| CZT Counter | 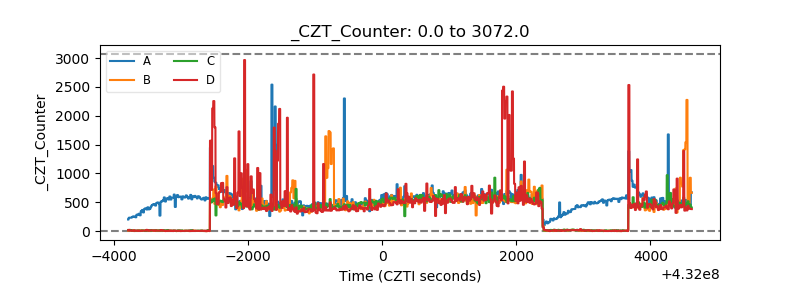 |
| +2.5 Volts monitor |  |
| +5 Volts monitor |  |
| _ROLL_ROT | 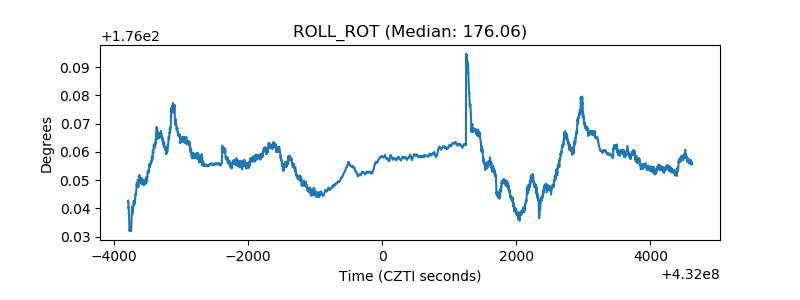 |
| _Roll_DEC | 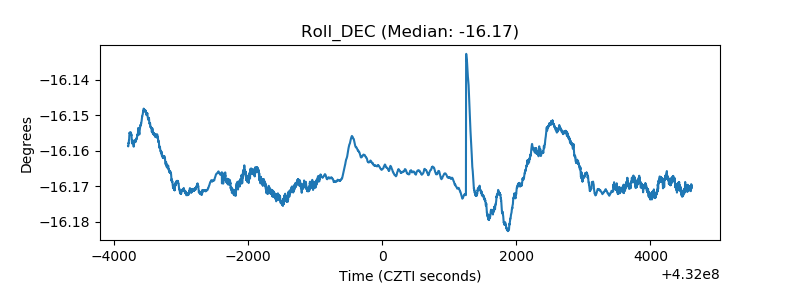 |
| _Roll_RA | 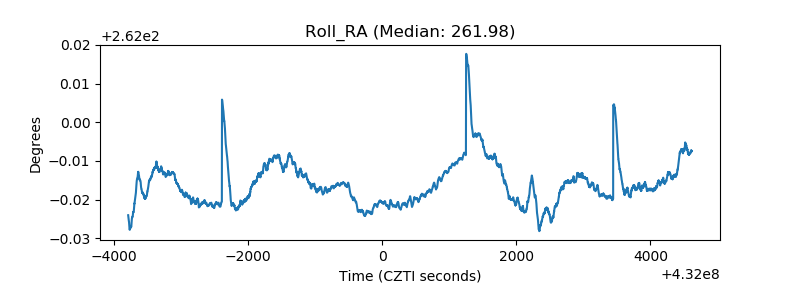 |
| Veto Counter | 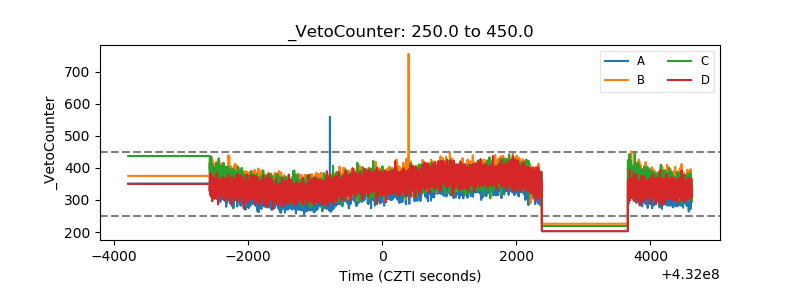 |