| Param | Original file | Final file |
|---|---|---|
| Filename | modeM0/AS1T05_148T01_9000005838_42990cztM0_level2.fits | modeM0/AS1T05_148T01_9000005838_42990cztM0_level2_quad_clean.evt |
| Size (bytes) | 1,268,101,440 | 299,453,760 |
| Size | 1.2 GB | 285.6 MB |
| Events in quadrant A | 9,688,513 | 2,186,651 |
| Events in quadrant B | 15,780,017 | 1,780,676 |
| Events in quadrant C | 8,500,401 | 2,140,019 |
| Events in quadrant D | 11,732,673 | 1,854,448 |
| Mode M9 | |||
|---|---|---|---|
| Quadrant | BADHDUFLAG | Total packets | Discarded packets |
| A | 0 | 55 | 0 |
| B | 0 | 55 | 0 |
| C | 0 | 55 | 0 |
| D | 0 | 55 | 0 |
| Mode SS | |||
|---|---|---|---|
| Quadrant | BADHDUFLAG | Total packets | Discarded packets |
| A | 0 | 330 | 0 |
| B | 0 | 330 | 0 |
| C | 0 | 330 | 0 |
| D | 0 | 330 | 0 |
| Mode M0 | |||
|---|---|---|---|
| Quadrant | BADHDUFLAG | Total packets | Discarded packets |
| A | 0 | 39060 | 4 |
| B | 0 | 57350 | 4 |
| C | 0 | 34109 | 4 |
| D | 0 | 45596 | 4 |
| Quadrant | Total seconds | Saturated seconds | Saturation percentage |
|---|---|---|---|
| A | 16025 | 182 | 1.135725% |
| B | 16026 | 3362 | 20.978410% |
| C | 16026 | 62 | 0.386871% |
| D | 16026 | 914 | 5.703232% |
Noise dominated data is calculated using 1-second bins in cleaned event files. If a bin has >2000 counts, and if more than 50% of those come from <1% of pixels, then it is considered to be noise-dominated and hence unusable.
| Quadrant | # 1 sec bins | Bins with >0 counts | Bins with >2000 counts | High rate bins dominated by noise | Noise dominated (total time) | Noise dominated (detector-on time) | Marked lightcurve |
|---|---|---|---|---|---|---|---|
| A | 21546 | 16029 | 144 | 144 | 0.67% | 0.90% | 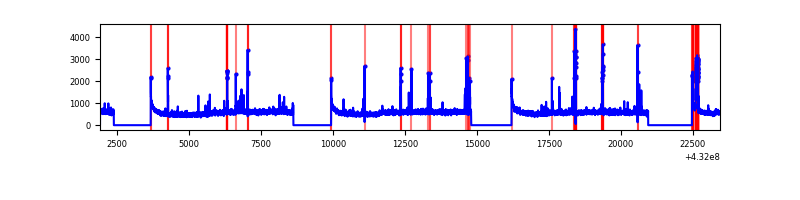 |
| B | 21547 | 16030 | 2568 | 2568 | 11.92% | 16.02% | 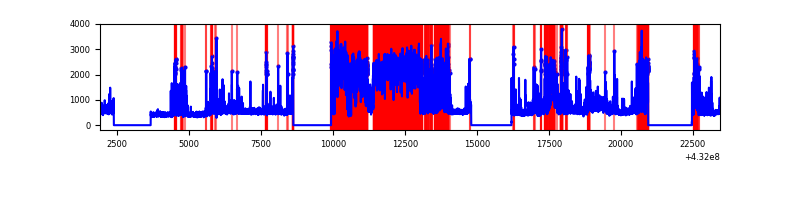 |
| C | 21547 | 16030 | 49 | 49 | 0.23% | 0.31% | 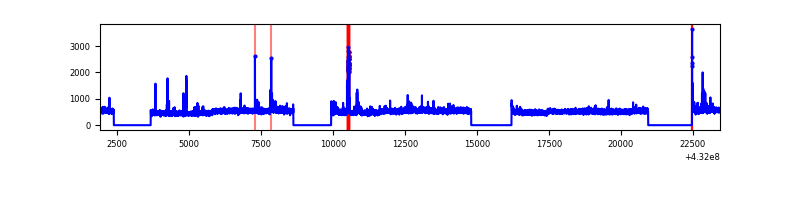 |
| D | 21547 | 16030 | 823 | 823 | 3.82% | 5.13% | 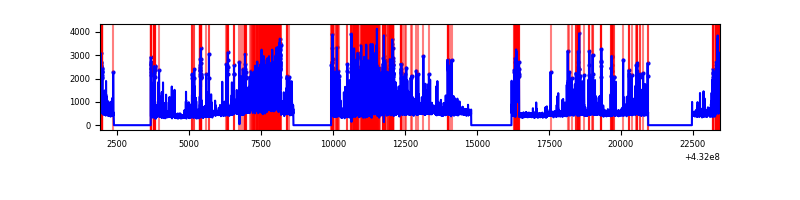 |
Top three noisy pixels from each quadrant. If the there are fewer than three noisy pixels in the level2.evt file, extra rows are filled as -1
| Pixel properties | Quadrant properties | ||||||
|---|---|---|---|---|---|---|---|
| Quadrant | DetID | PixID | Counts | Sigma | Mean | Median | Sigma |
| A | 10 | 83 | 1576825 | 3658.6 | 1948 | 1915 | 430.5 |
| A | 15 | 237 | 448786 | 1038.11 | 1948 | 1915 | 430.5 |
| A | 15 | 222 | 98702 | 224.84 | 1948 | 1915 | 430.5 |
| B | 4 | 81 | 7326682 | 19825.66 | 1785 | 1747 | 369.5 |
| B | 4 | 171 | 924667 | 2497.97 | 1785 | 1747 | 369.5 |
| B | 12 | 18 | 212346 | 570.01 | 1785 | 1747 | 369.5 |
| C | 15 | 214 | 649009 | 1355.34 | 1897 | 1914 | 477.4 |
| C | 5 | 250 | 411878 | 858.67 | 1897 | 1914 | 477.4 |
| C | 7 | 220 | 34409 | 68.06 | 1897 | 1914 | 477.4 |
| D | 1 | 47 | 2491458 | 5168.45 | 1838 | 1775 | 481.7 |
| D | 1 | 52 | 995495 | 2062.91 | 1838 | 1775 | 481.7 |
| D | 13 | 249 | 637445 | 1319.62 | 1838 | 1775 | 481.7 |
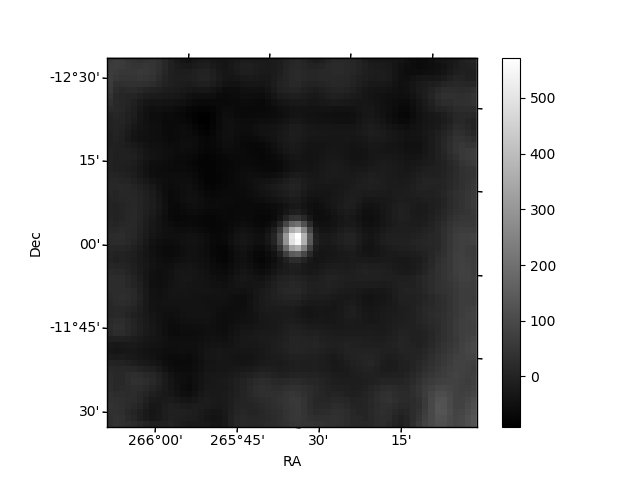
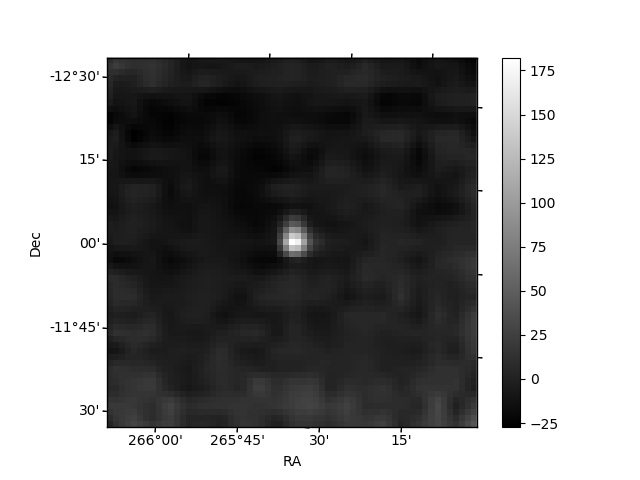
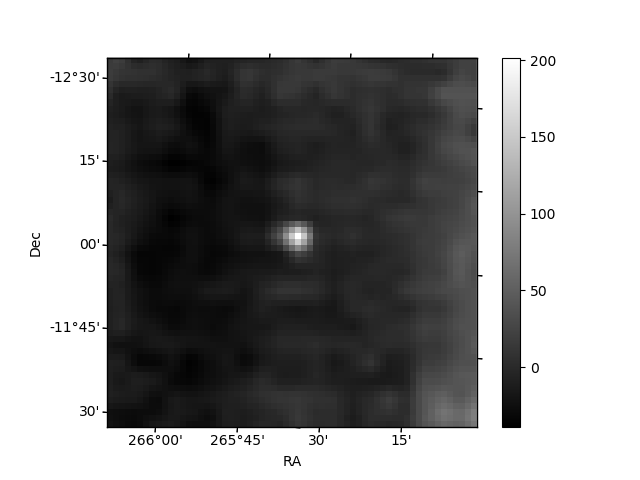
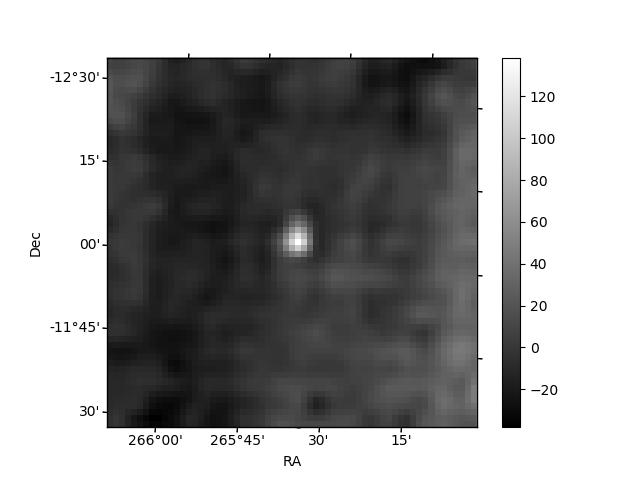
Histogram calculated using DETX and DETY for each event in the final _common_clean file
| Quadrant A | 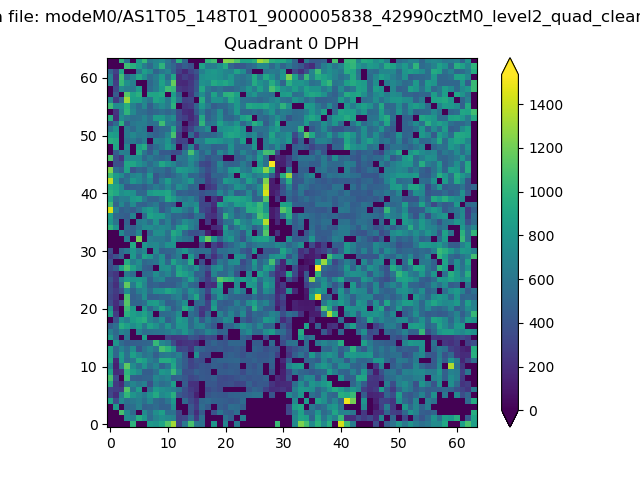 |
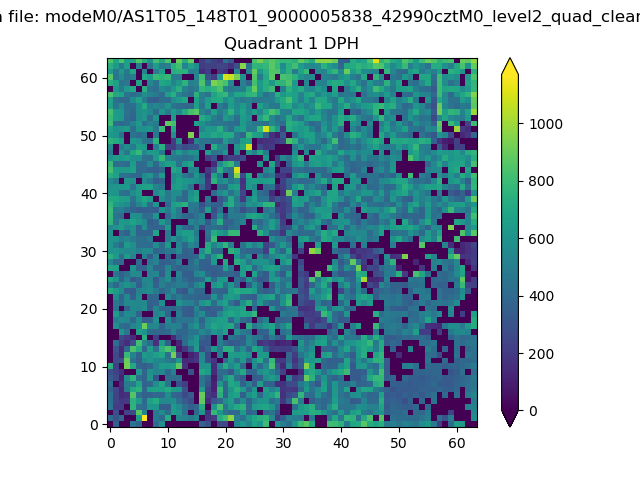 |
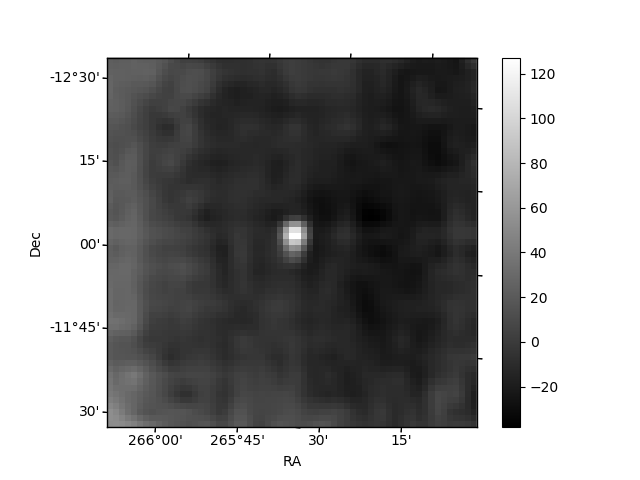
Quadrant B |
|---|---|---|---|
| Quadrant D | 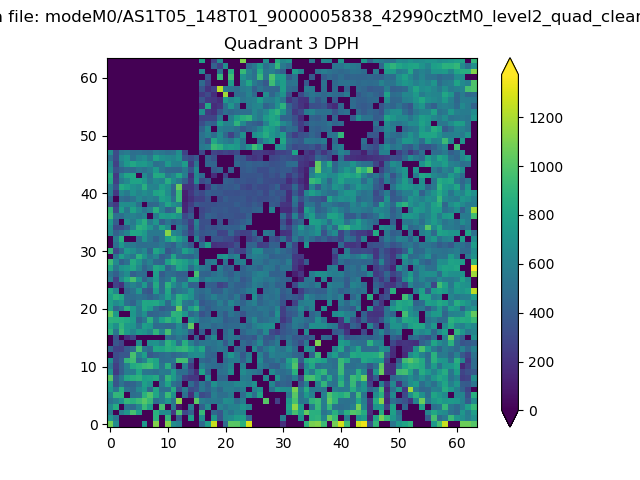 |
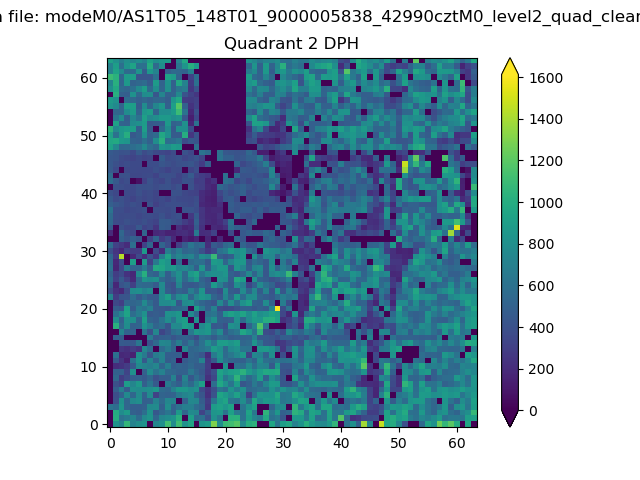 |
Quadrant C |
| Plot type | Count rate plots | Images |
|---|---|---|
| Comparison with Poisson distribution Blue bars denote a histogram of data divided into 1 sec bins. Red curve is a Poisson curve with rate = median count rate of data. |
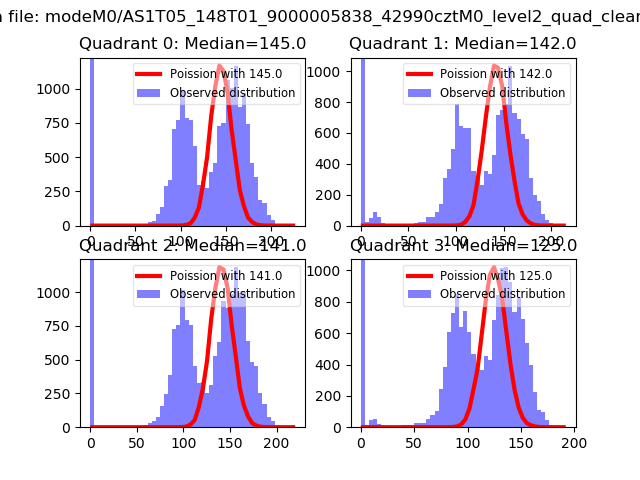 |
 |
| Quadrant-wise count rates Data is divided into 100 sec bins |
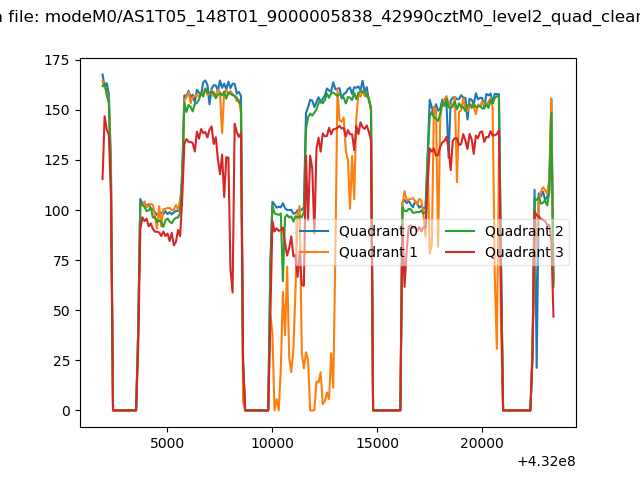 |
|
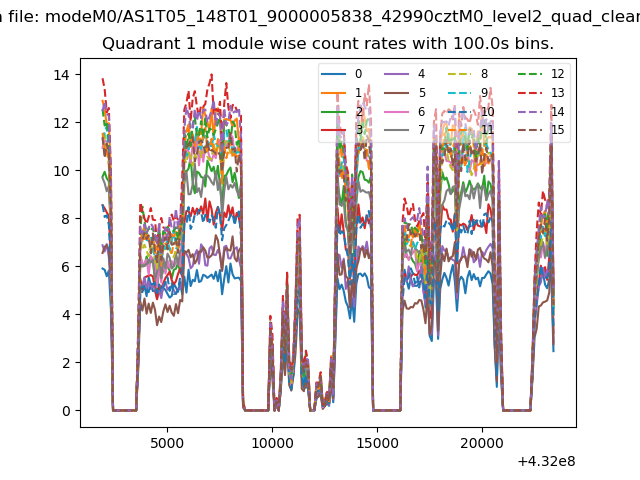
| Module-wise count rates for Quadrant A Data is divided into 100 sec bins |
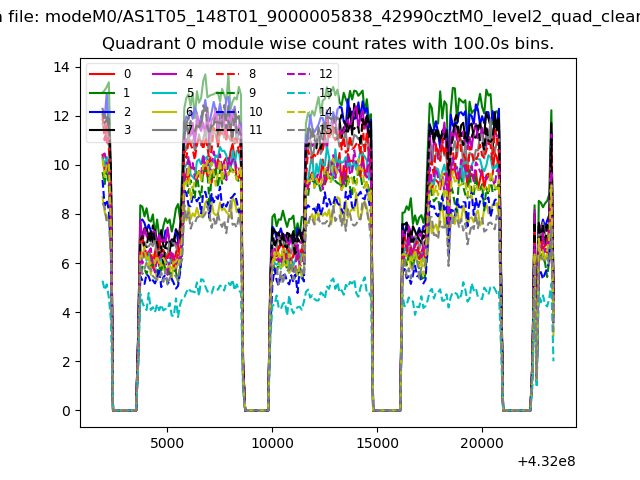 |
 |
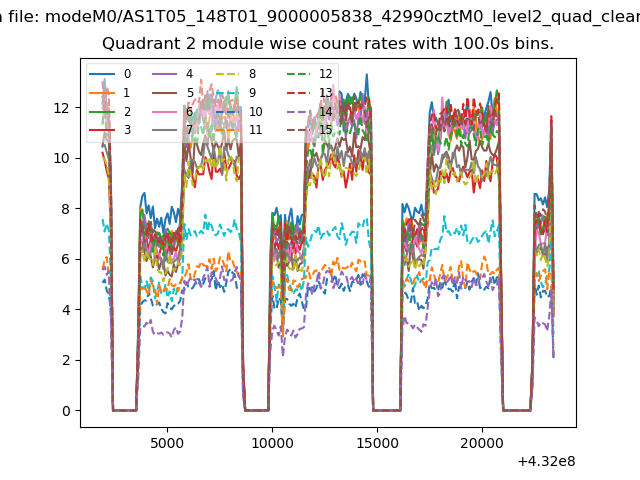
| Module-wise count rates for Quadrant B Data is divided into 100 sec bins |
 |
 |
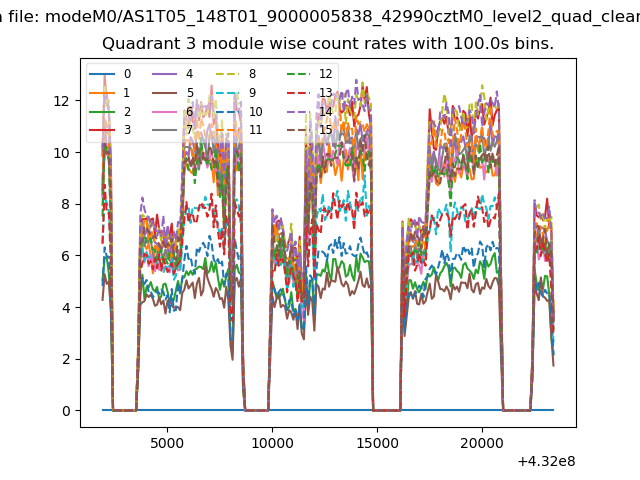
| Module-wise count rates for Quadrant C Data is divided into 100 sec bins |
 |
 |
| Module-wise count rates for Quadrant D Data is divided into 100 sec bins |
 |
 |
| Parameter | Plot |
|---|---|
| CZT HV Monitor | 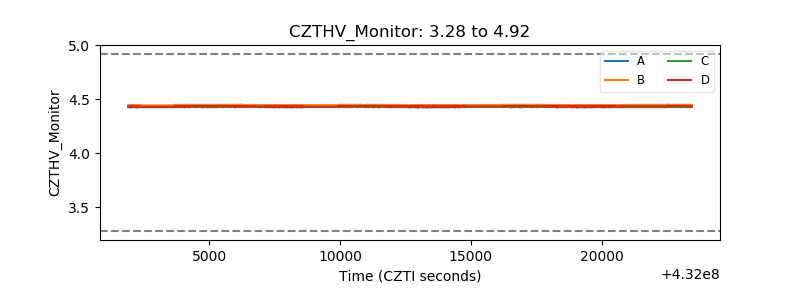 |
| D_VDD | 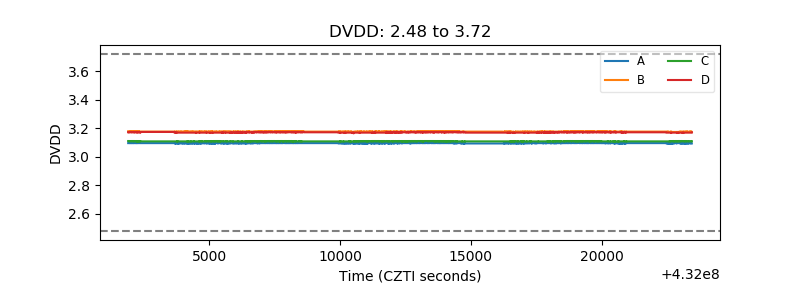 |
| Temperature 1 | 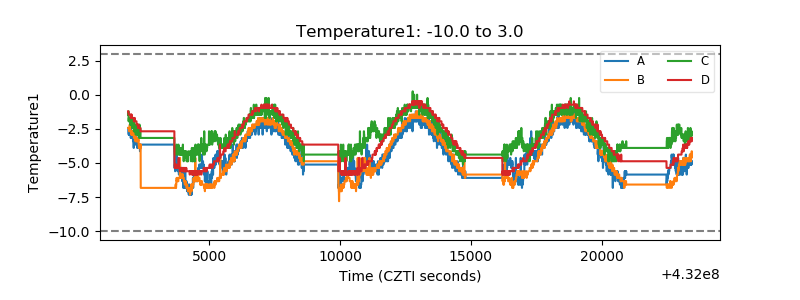 |
| Veto HV Monitor | 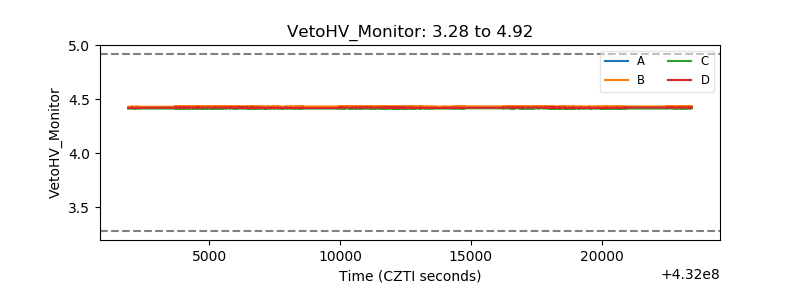 |
| Veto LLD | 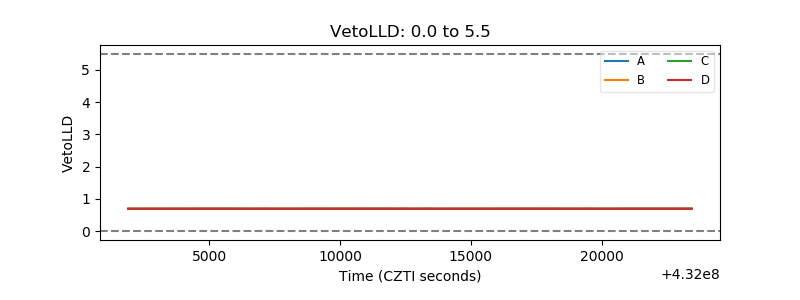 |
| Alpha Counter |  |
| _CPM_Rate | 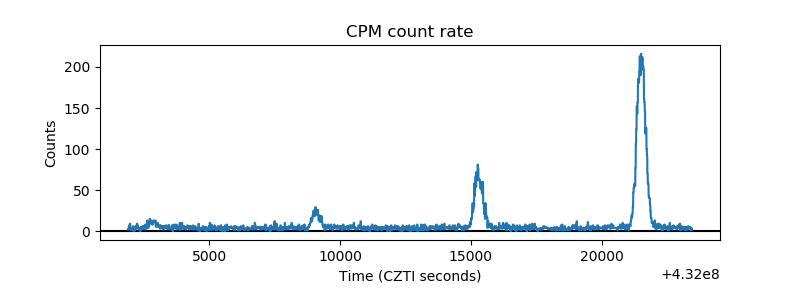 |
| CZT Counter | 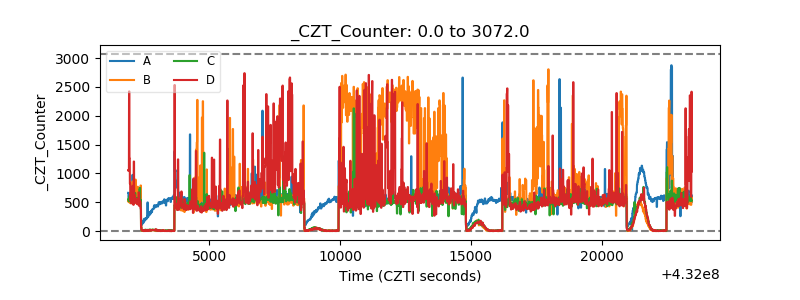 |
| +2.5 Volts monitor | 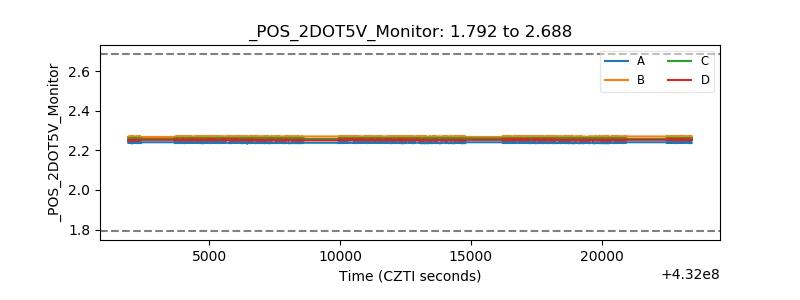 |
| +5 Volts monitor | 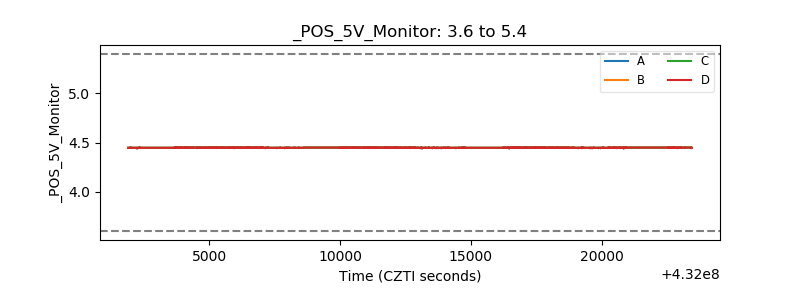 |
| _ROLL_ROT | 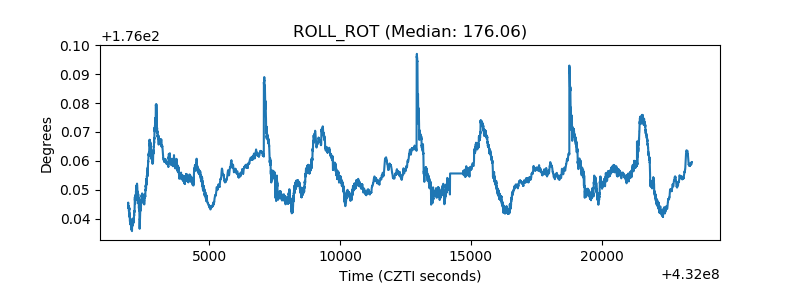 |
| _Roll_DEC | 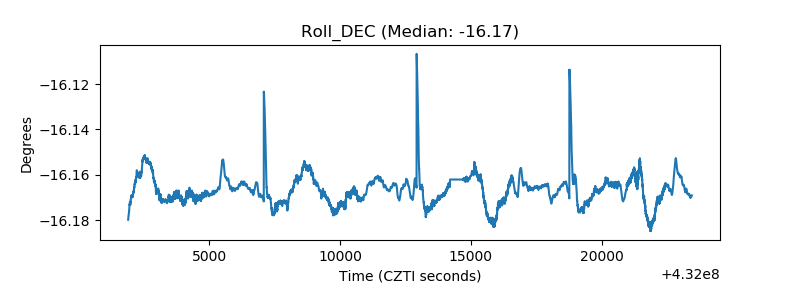 |
| _Roll_RA | 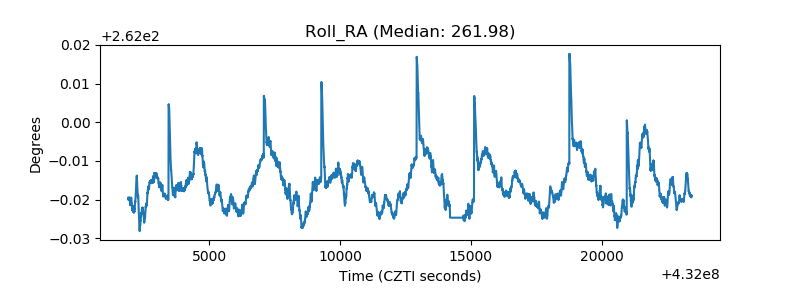 |
| Veto Counter | 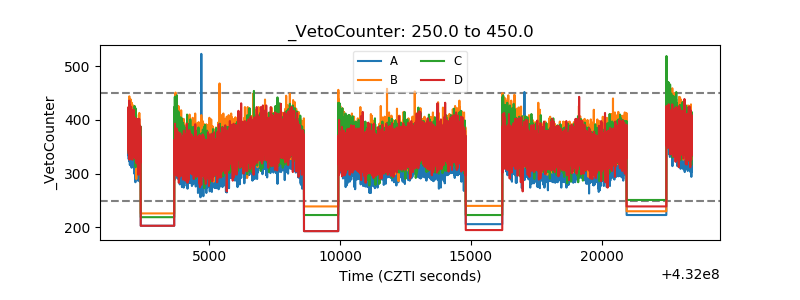 |