| Param | Original file | Final file |
|---|---|---|
| Filename | modeM0/AS1T05_148T01_9000005838_42991cztM0_level2.fits | modeM0/AS1T05_148T01_9000005838_42991cztM0_level2_quad_clean.evt |
| Size (bytes) | 501,099,840 | 107,179,200 |
| Size | 477.9 MB | 102.2 MB |
| Events in quadrant A | 3,631,430 | 806,927 |
| Events in quadrant B | 7,187,962 | 579,110 |
| Events in quadrant C | 3,141,572 | 791,376 |
| Events in quadrant D | 4,161,282 | 683,866 |
| Mode M9 | |||
|---|---|---|---|
| Quadrant | BADHDUFLAG | Total packets | Discarded packets |
| A | 0 | 23 | 0 |
| B | 0 | 24 | 0 |
| C | 0 | 24 | 0 |
| D | 0 | 24 | 0 |
| Mode SS | |||
|---|---|---|---|
| Quadrant | BADHDUFLAG | Total packets | Discarded packets |
| A | 0 | 112 | 0 |
| B | 0 | 112 | 0 |
| C | 0 | 112 | 0 |
| D | 0 | 112 | 0 |
| Mode M0 | |||
|---|---|---|---|
| Quadrant | BADHDUFLAG | Total packets | Discarded packets |
| A | 0 | 14305 | 2 |
| B | 0 | 24936 | 2 |
| C | 0 | 12390 | 2 |
| D | 0 | 15892 | 2 |
| Quadrant | Total seconds | Saturated seconds | Saturation percentage |
|---|---|---|---|
| A | 5493 | 147 | 2.676133% |
| B | 5493 | 1796 | 32.696159% |
| C | 5493 | 29 | 0.527945% |
| D | 5493 | 292 | 5.315857% |
Noise dominated data is calculated using 1-second bins in cleaned event files. If a bin has >2000 counts, and if more than 50% of those come from <1% of pixels, then it is considered to be noise-dominated and hence unusable.
| Quadrant | # 1 sec bins | Bins with >0 counts | Bins with >2000 counts | High rate bins dominated by noise | Noise dominated (total time) | Noise dominated (detector-on time) | Marked lightcurve |
|---|---|---|---|---|---|---|---|
| A | 7166 | 5494 | 115 | 115 | 1.60% | 2.09% | 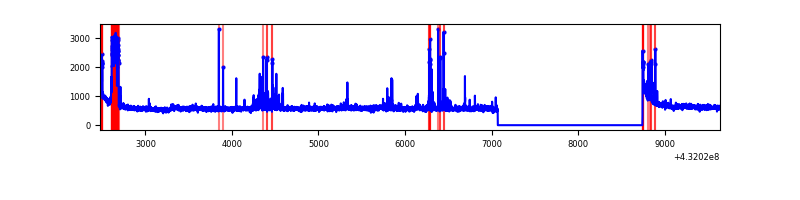 |
| B | 7166 | 5494 | 1487 | 1487 | 20.75% | 27.07% | 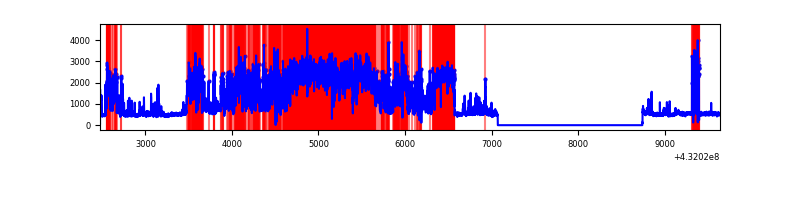 |
| C | 7166 | 5494 | 14 | 14 | 0.20% | 0.25% | 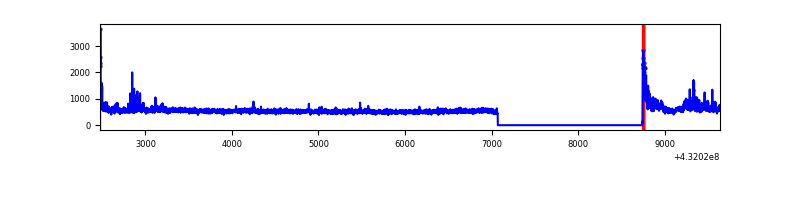 |
| D | 7166 | 5494 | 269 | 269 | 3.75% | 4.90% | 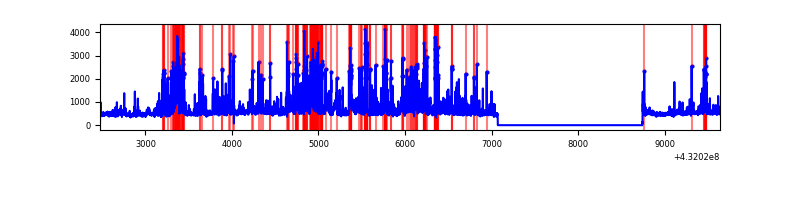 |
Top three noisy pixels from each quadrant. If the there are fewer than three noisy pixels in the level2.evt file, extra rows are filled as -1
| Pixel properties | Quadrant properties | ||||||
|---|---|---|---|---|---|---|---|
| Quadrant | DetID | PixID | Counts | Sigma | Mean | Median | Sigma |
| A | 10 | 83 | 581788 | 3739.07 | 686 | 674 | 155.4 |
| A | 15 | 237 | 267704 | 1718.16 | 686 | 674 | 155.4 |
| A | 15 | 222 | 64207 | 408.79 | 686 | 674 | 155.4 |
| B | 4 | 81 | 2713626 | 21579.55 | 590 | 577 | 125.7 |
| B | 4 | 171 | 2089949 | 16618.83 | 590 | 577 | 125.7 |
| B | 3 | 112 | 49664 | 390.44 | 590 | 577 | 125.7 |
| C | 5 | 250 | 300390 | 1738.16 | 669 | 673 | 172.4 |
| C | 15 | 214 | 228106 | 1318.96 | 669 | 673 | 172.4 |
| C | 13 | 61 | 4565 | 22.57 | 669 | 673 | 172.4 |
| D | 1 | 47 | 830318 | 4792.67 | 650 | 627 | 173.1 |
| D | 1 | 52 | 399756 | 2305.55 | 650 | 627 | 173.1 |
| D | 13 | 249 | 358648 | 2068.09 | 650 | 627 | 173.1 |
Histogram calculated using DETX and DETY for each event in the final _common_clean file
| Quadrant A | 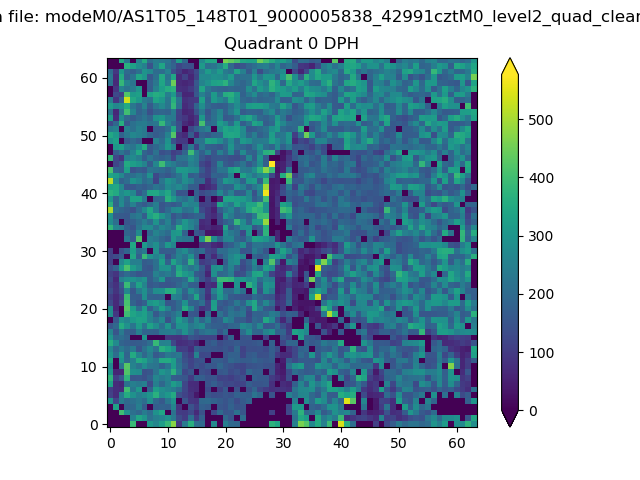 |
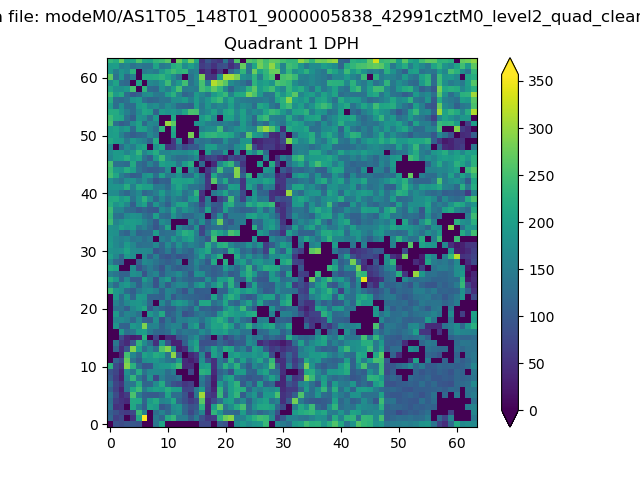 |
Quadrant B |
|---|---|---|---|
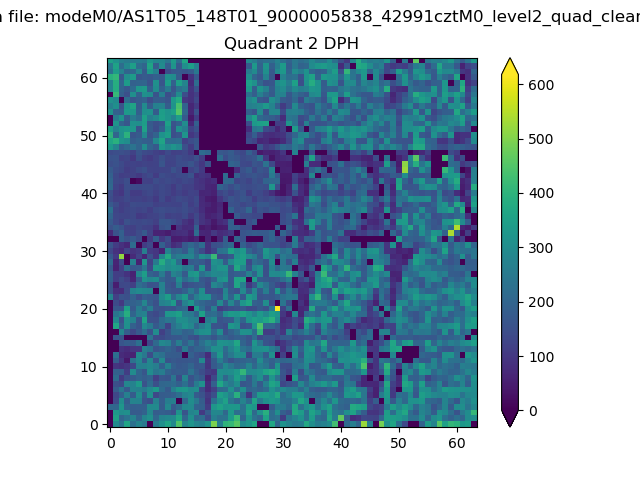
| Quadrant D | 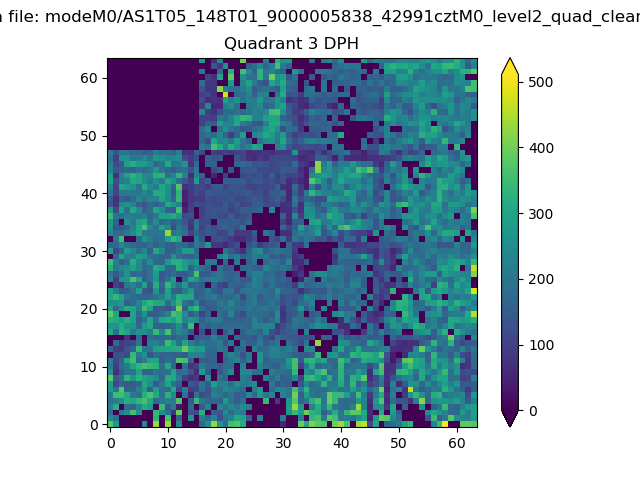 |
 |
Quadrant C |
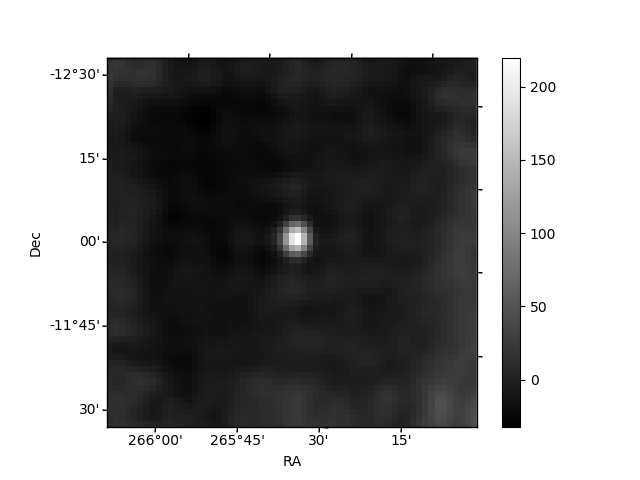
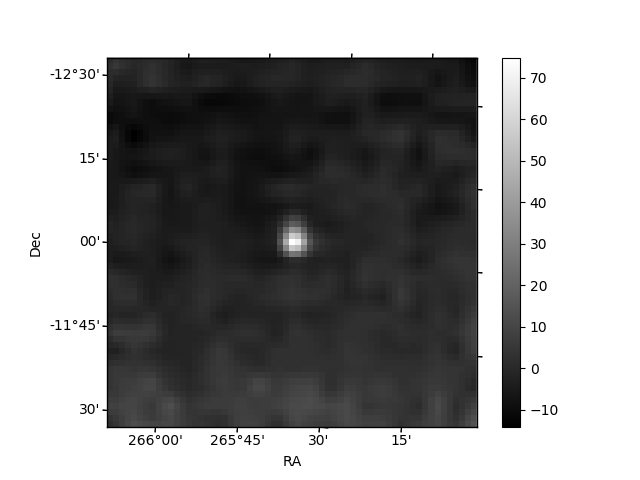
| Plot type | Count rate plots | Images |
|---|---|---|
| Comparison with Poisson distribution Blue bars denote a histogram of data divided into 1 sec bins. Red curve is a Poisson curve with rate = median count rate of data. |
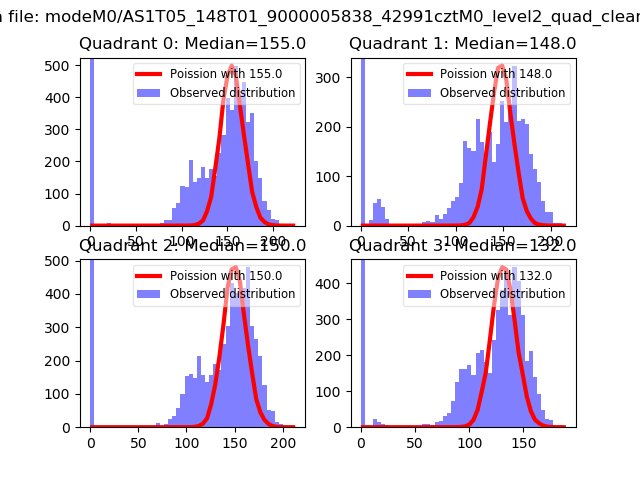 |
 |
| Quadrant-wise count rates Data is divided into 100 sec bins |
 |
|
| Module-wise count rates for Quadrant A Data is divided into 100 sec bins |
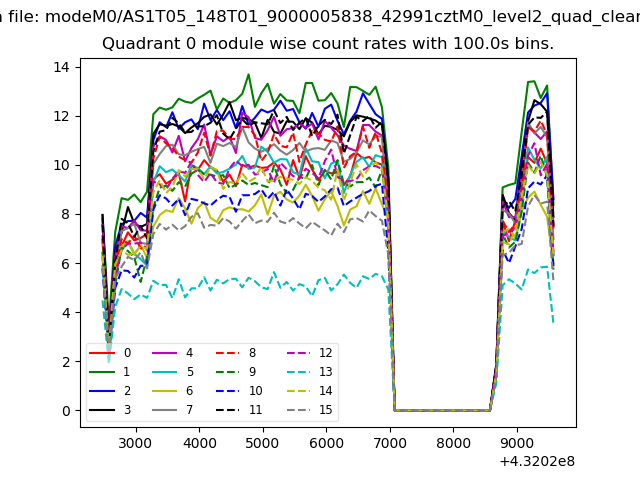 |
 |
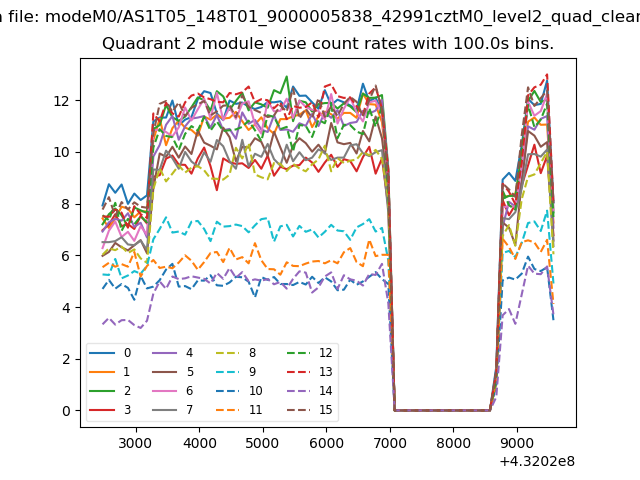
| Module-wise count rates for Quadrant B Data is divided into 100 sec bins |
 |
 |
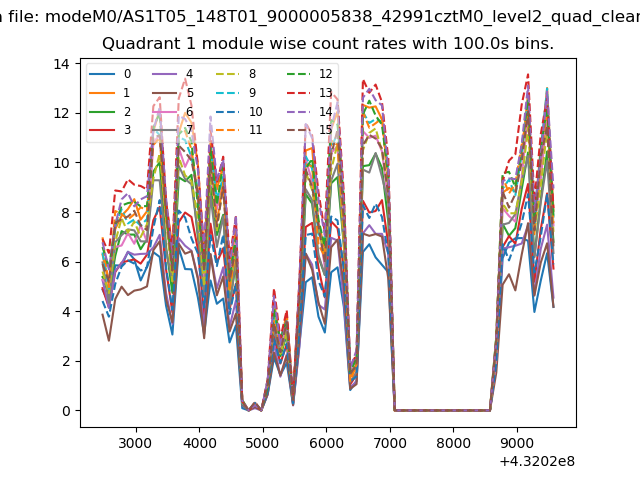
| Module-wise count rates for Quadrant C Data is divided into 100 sec bins |
 |
 |
| Module-wise count rates for Quadrant D Data is divided into 100 sec bins |
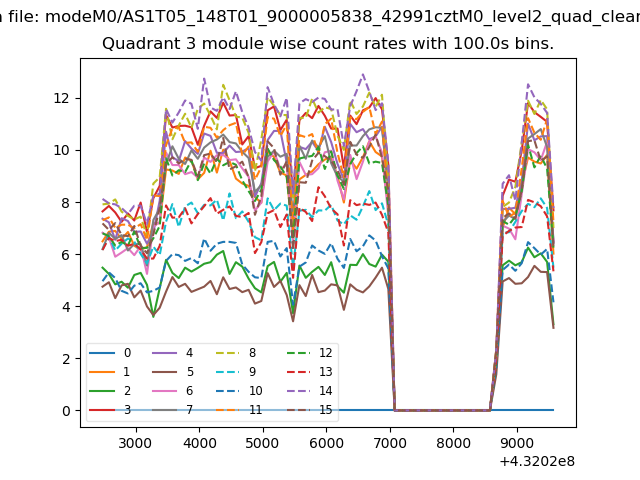 |
 |
| Parameter | Plot |
|---|---|
| CZT HV Monitor | 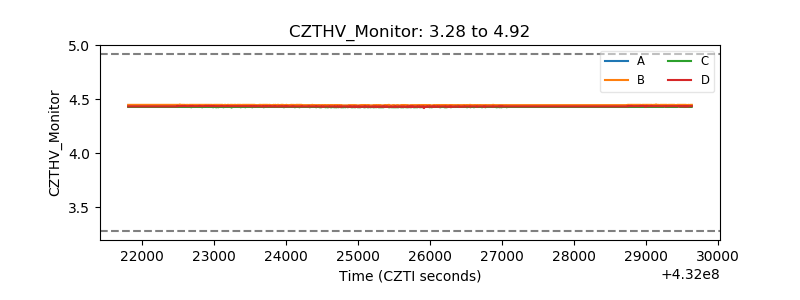 |
| D_VDD | 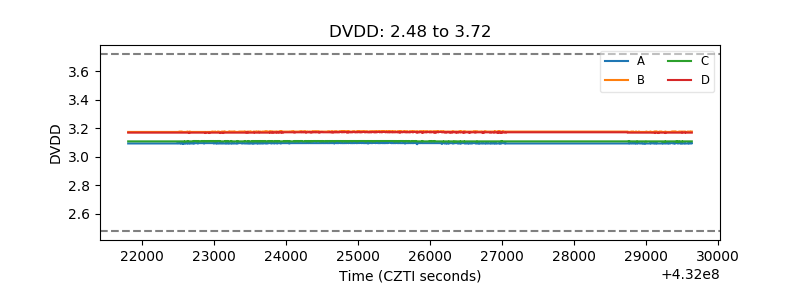 |
| Temperature 1 | 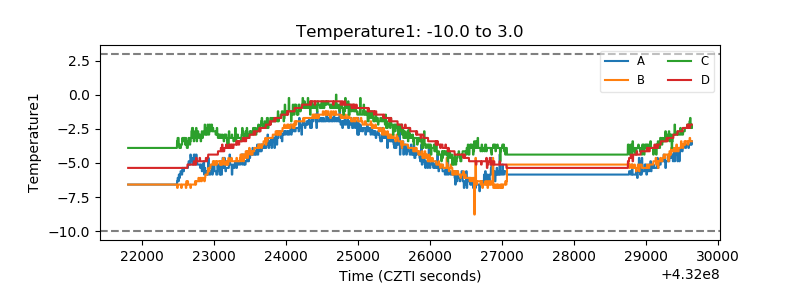 |
| Veto HV Monitor | 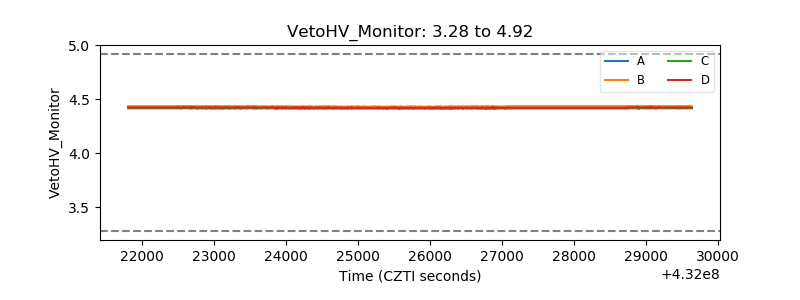 |
| Veto LLD | 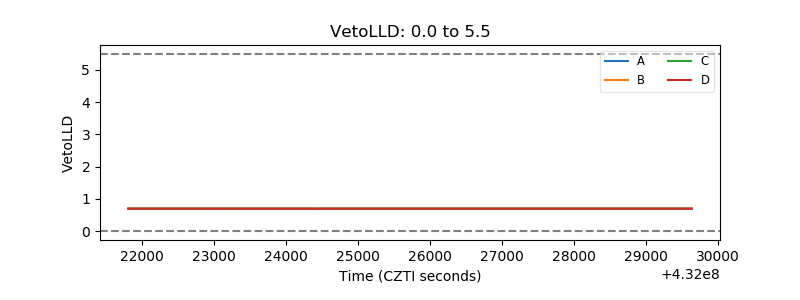 |
| Alpha Counter | 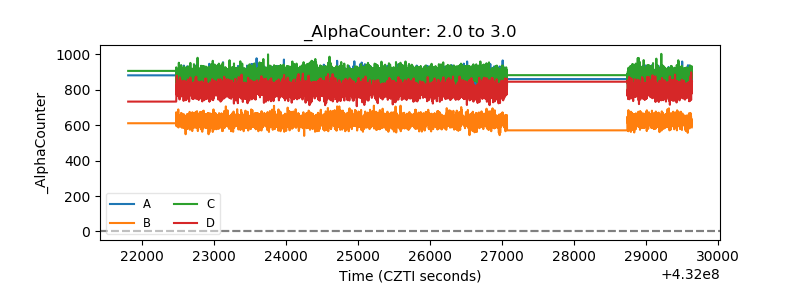 |
| _CPM_Rate | 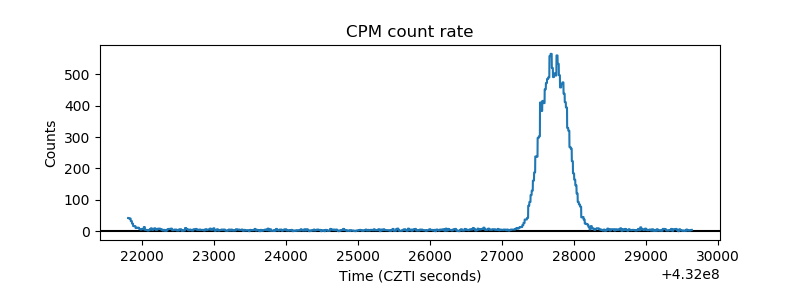 |
| CZT Counter | 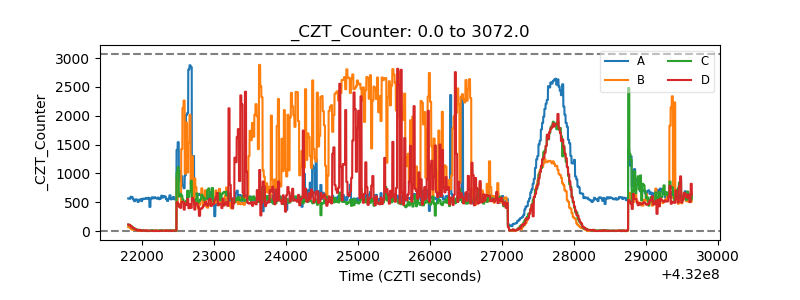 |
| +2.5 Volts monitor | 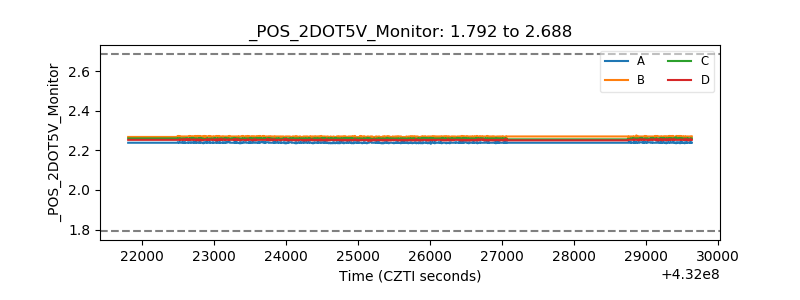 |
| +5 Volts monitor | 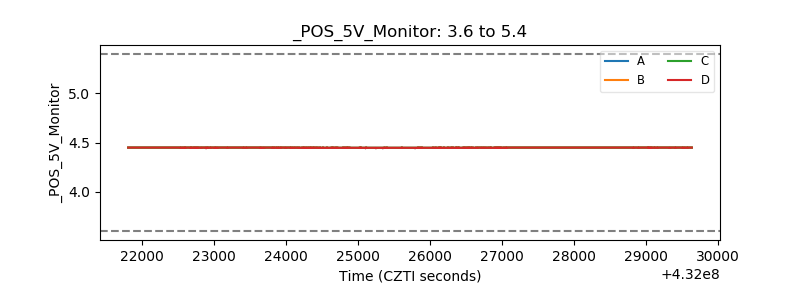 |
| _ROLL_ROT | 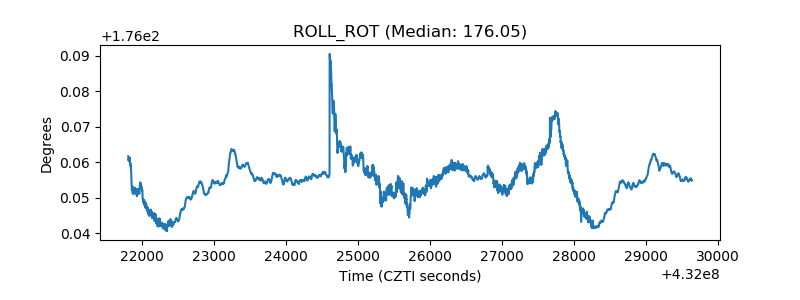 |
| _Roll_DEC | 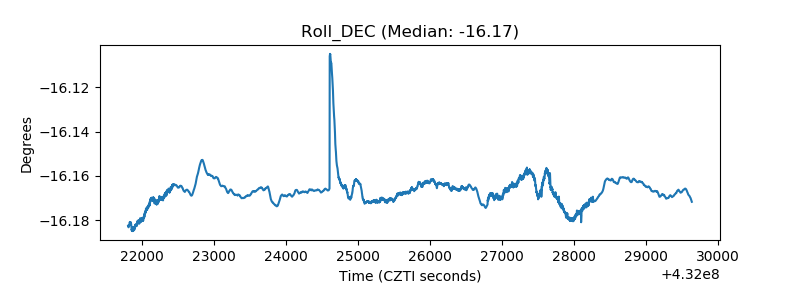 |
| _Roll_RA | 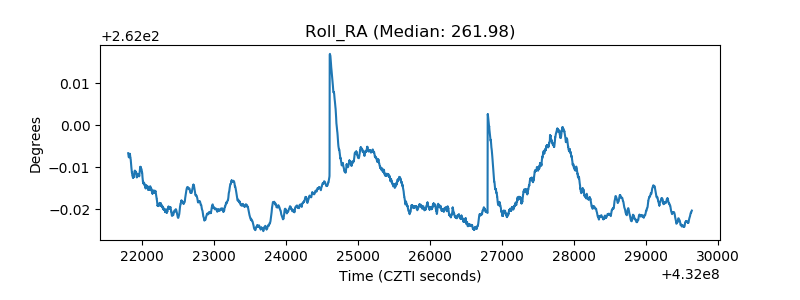 |
| Veto Counter | 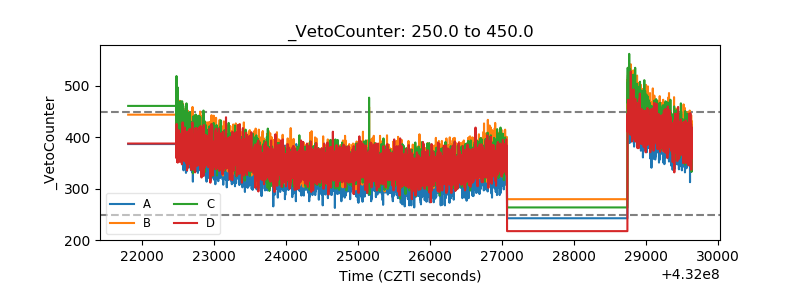 |