| Param | Original file | Final file |
|---|---|---|
| Filename | modeM0/AS1T05_148T01_9000005838_42993cztM0_level2.fits | modeM0/AS1T05_148T01_9000005838_42993cztM0_level2_quad_clean.evt |
| Size (bytes) | 493,928,640 | 115,951,680 |
| Size | 471.0 MB | 110.6 MB |
| Events in quadrant A | 3,483,253 | 860,728 |
| Events in quadrant B | 4,943,557 | 749,786 |
| Events in quadrant C | 4,687,089 | 825,172 |
| Events in quadrant D | 4,752,113 | 698,756 |
| Mode M9 | |||
|---|---|---|---|
| Quadrant | BADHDUFLAG | Total packets | Discarded packets |
| A | 0 | 25 | 0 |
| B | 0 | 26 | 0 |
| C | 0 | 26 | 0 |
| D | 0 | 26 | 0 |
| Mode SS | |||
|---|---|---|---|
| Quadrant | BADHDUFLAG | Total packets | Discarded packets |
| A | 0 | 110 | 0 |
| B | 0 | 110 | 0 |
| C | 0 | 110 | 0 |
| D | 0 | 110 | 0 |
| Mode M0 | |||
|---|---|---|---|
| Quadrant | BADHDUFLAG | Total packets | Discarded packets |
| A | 0 | 13832 | 2 |
| B | 0 | 18069 | 2 |
| C | 0 | 17693 | 2 |
| D | 0 | 17651 | 2 |
| Quadrant | Total seconds | Saturated seconds | Saturation percentage |
|---|---|---|---|
| A | 5386 | 71 | 1.318232% |
| B | 5385 | 926 | 17.195915% |
| C | 5385 | 115 | 2.135562% |
| D | 5385 | 474 | 8.802228% |
Noise dominated data is calculated using 1-second bins in cleaned event files. If a bin has >2000 counts, and if more than 50% of those come from <1% of pixels, then it is considered to be noise-dominated and hence unusable.
| Quadrant | # 1 sec bins | Bins with >0 counts | Bins with >2000 counts | High rate bins dominated by noise | Noise dominated (total time) | Noise dominated (detector-on time) | Marked lightcurve |
|---|---|---|---|---|---|---|---|
| A | 7149 | 5387 | 41 | 41 | 0.57% | 0.76% | 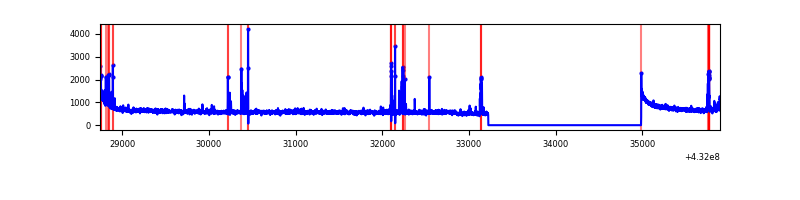 |
| B | 7148 | 5386 | 556 | 556 | 7.78% | 10.32% | 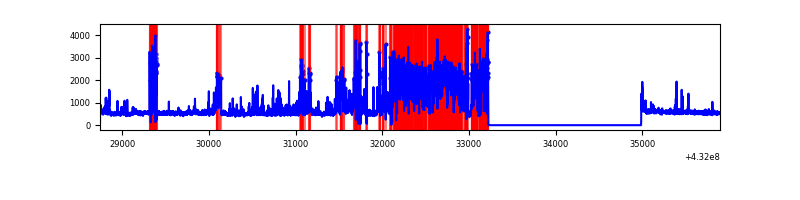 |
| C | 7148 | 5386 | 133 | 133 | 1.86% | 2.47% | 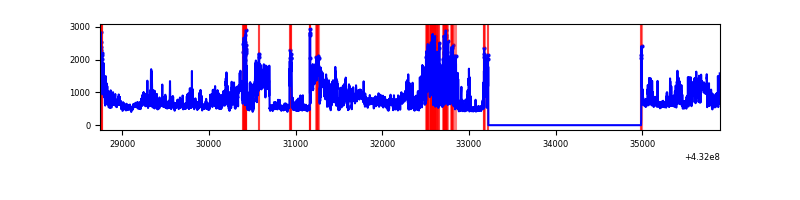 |
| D | 7148 | 5386 | 444 | 444 | 6.21% | 8.24% | 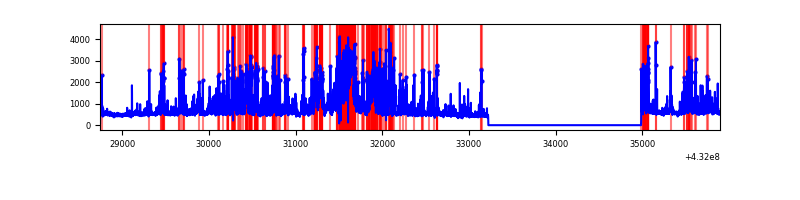 |
Top three noisy pixels from each quadrant. If the there are fewer than three noisy pixels in the level2.evt file, extra rows are filled as -1
| Pixel properties | Quadrant properties | ||||||
|---|---|---|---|---|---|---|---|
| Quadrant | DetID | PixID | Counts | Sigma | Mean | Median | Sigma |
| A | 10 | 83 | 579223 | 3565.55 | 701 | 687 | 162.3 |
| A | 15 | 237 | 150014 | 920.31 | 701 | 687 | 162.3 |
| A | 15 | 222 | 44331 | 268.98 | 701 | 687 | 162.3 |
| B | 4 | 81 | 2095172 | 14900.13 | 642 | 627 | 140.6 |
| B | 4 | 171 | 197111 | 1397.74 | 642 | 627 | 140.6 |
| B | 5 | 255 | 68655 | 483.94 | 642 | 627 | 140.6 |
| C | 5 | 250 | 1818481 | 10333.76 | 673 | 676 | 175.9 |
| C | 15 | 214 | 223750 | 1268.12 | 673 | 676 | 175.9 |
| C | 14 | 254 | 12516 | 67.31 | 673 | 676 | 175.9 |
| D | 13 | 249 | 1070249 | 6051.04 | 647 | 625 | 176.8 |
| D | 1 | 47 | 736729 | 4164.26 | 647 | 625 | 176.8 |
| D | 1 | 52 | 327638 | 1849.97 | 647 | 625 | 176.8 |
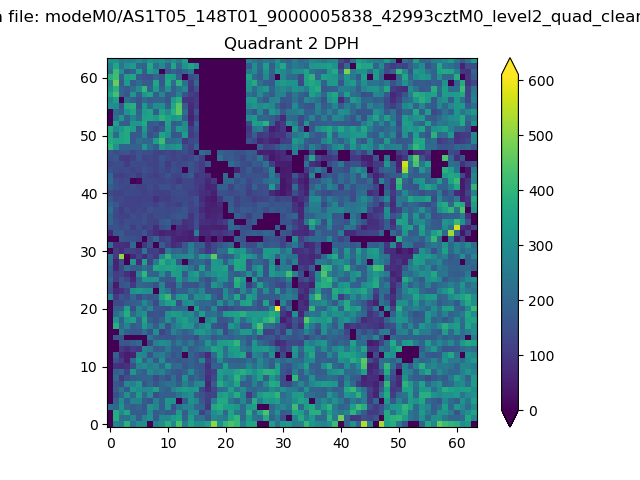
Histogram calculated using DETX and DETY for each event in the final _common_clean file
| Quadrant A | 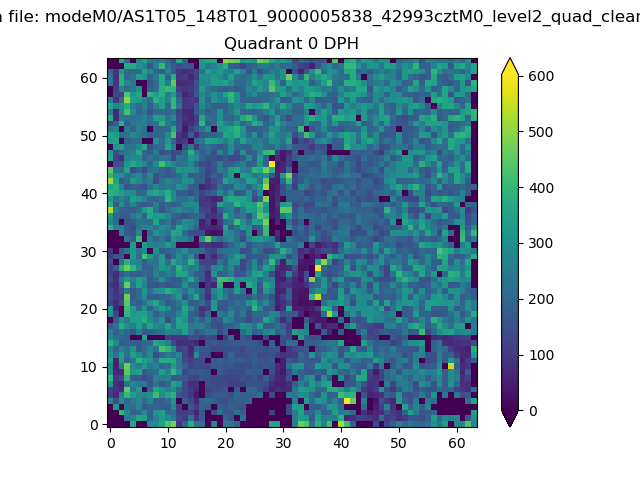 |
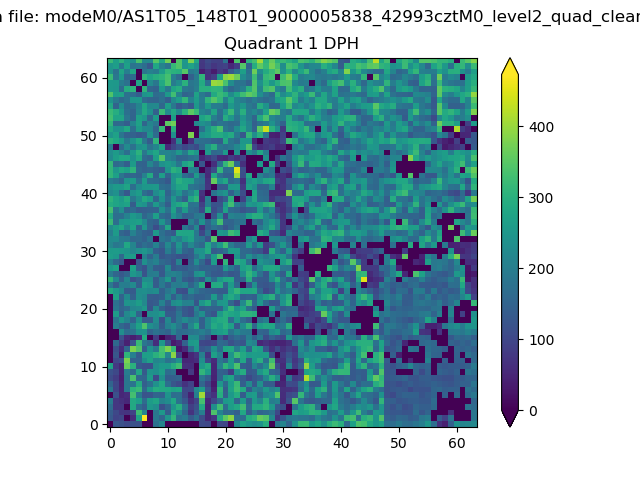 |
Quadrant B |
|---|---|---|---|
| Quadrant D | 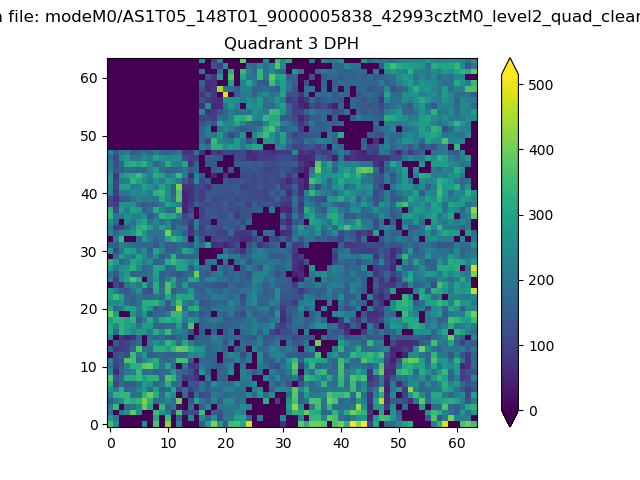 |
 |
Quadrant C |
| Plot type | Count rate plots | Images |
|---|---|---|
| Comparison with Poisson distribution Blue bars denote a histogram of data divided into 1 sec bins. Red curve is a Poisson curve with rate = median count rate of data. |
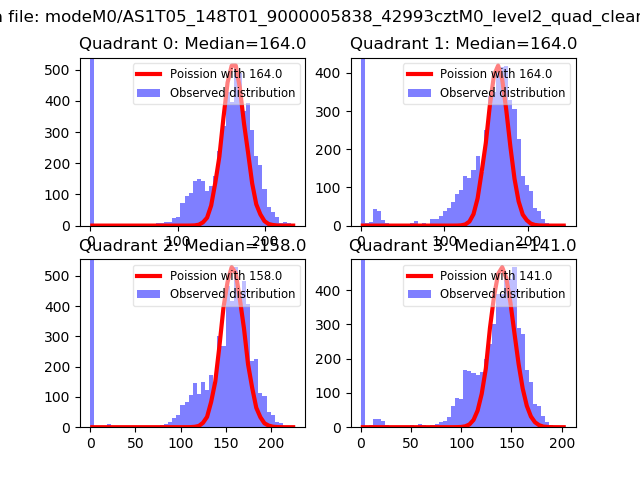 |
 |
| Quadrant-wise count rates Data is divided into 100 sec bins |
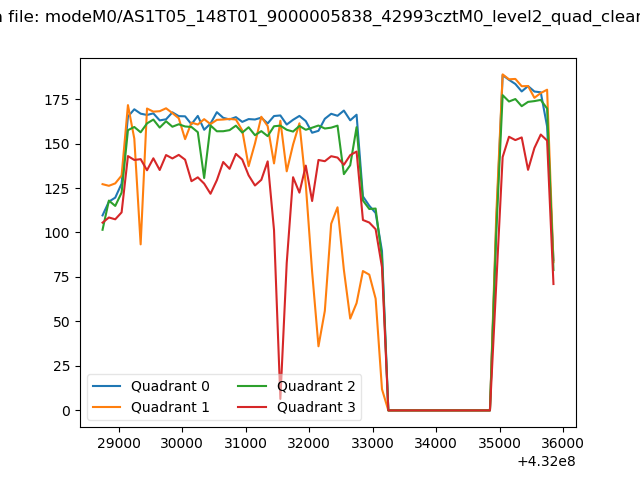 |
|
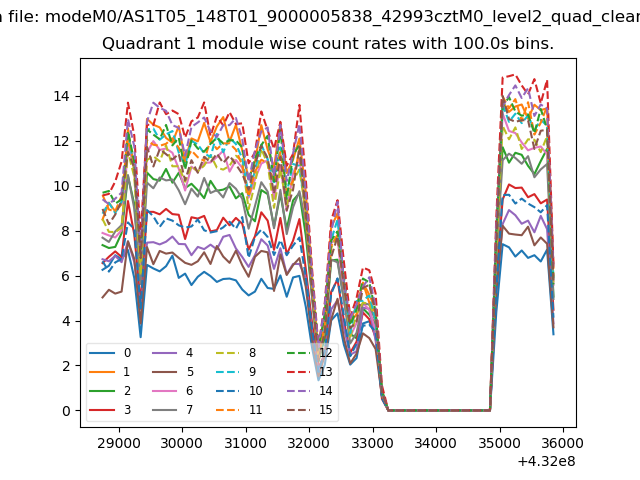
| Module-wise count rates for Quadrant A Data is divided into 100 sec bins |
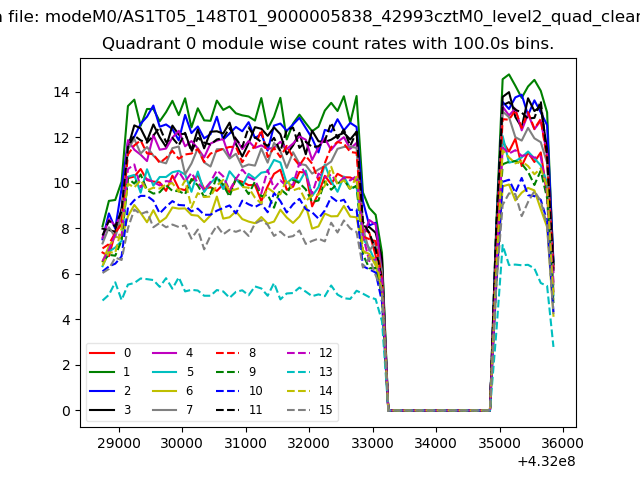 |
 |
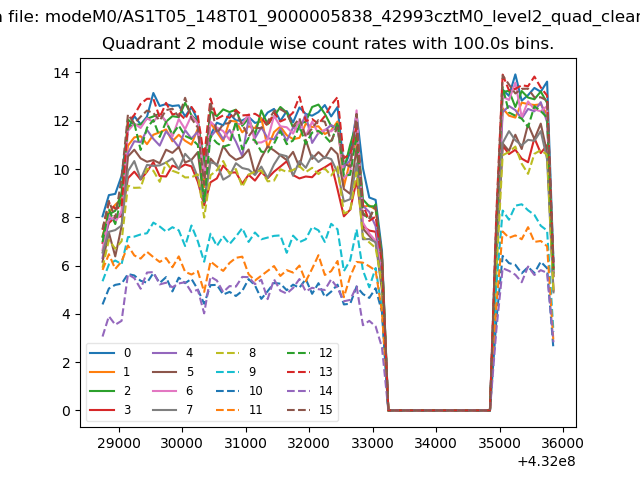
| Module-wise count rates for Quadrant B Data is divided into 100 sec bins |
 |
 |
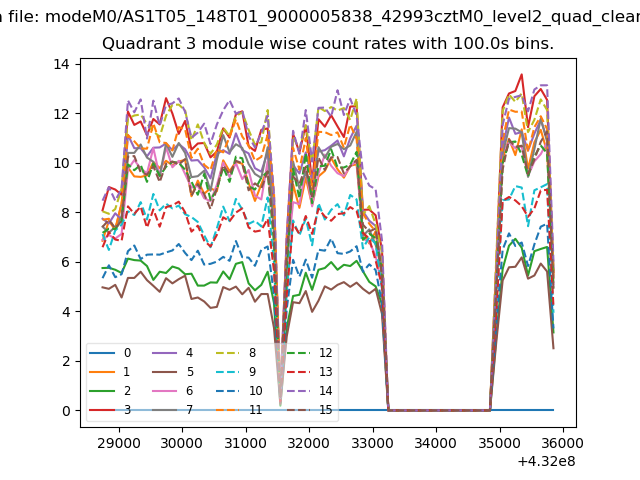
| Module-wise count rates for Quadrant C Data is divided into 100 sec bins |
 |
 |
| Module-wise count rates for Quadrant D Data is divided into 100 sec bins |
 |
 |
| Parameter | Plot |
|---|---|
| CZT HV Monitor | 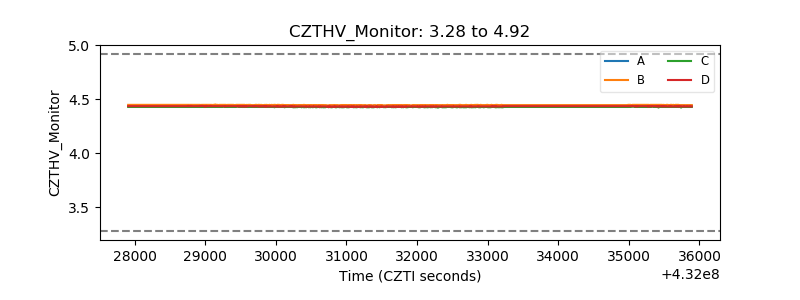 |
| D_VDD | 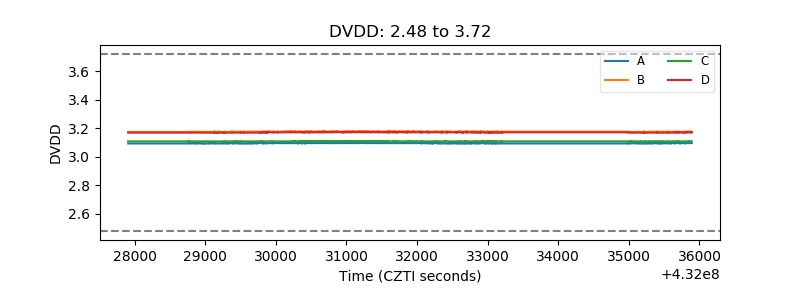 |
| Temperature 1 | 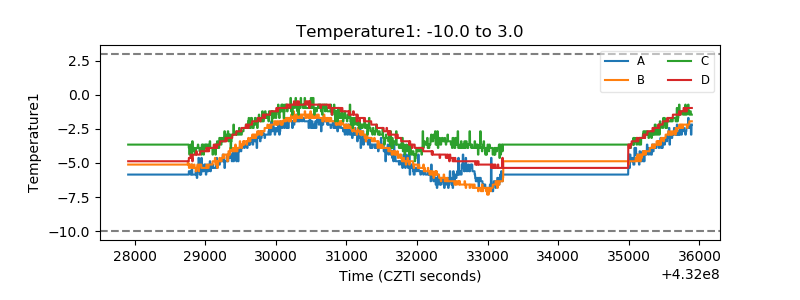 |
| Veto HV Monitor | 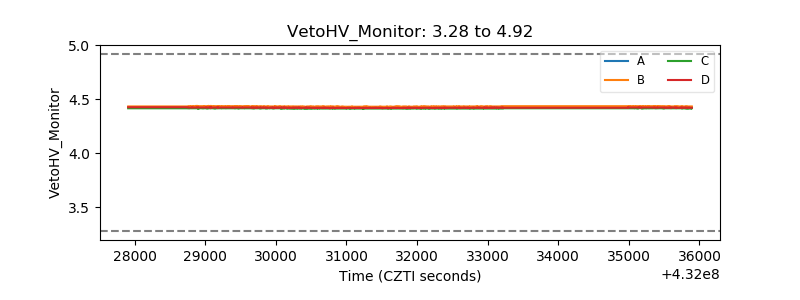 |
| Veto LLD | 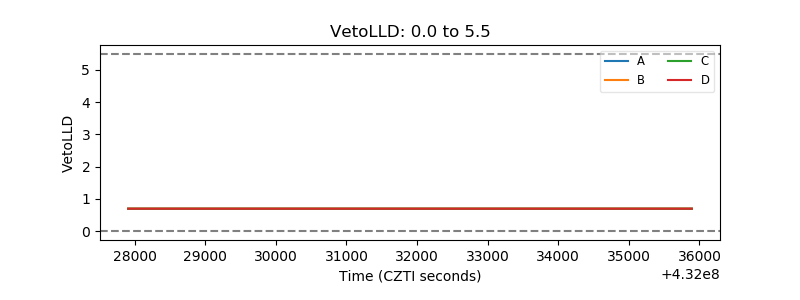 |
| Alpha Counter | 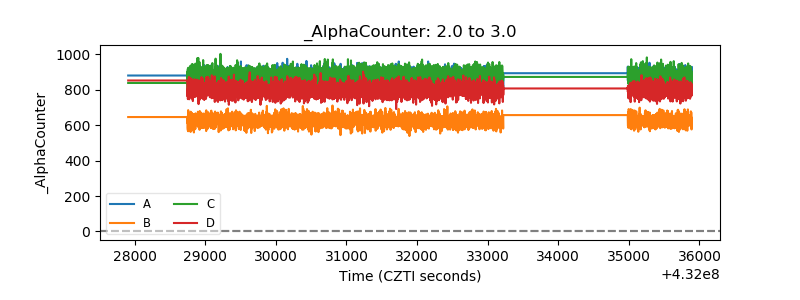 |
| _CPM_Rate | 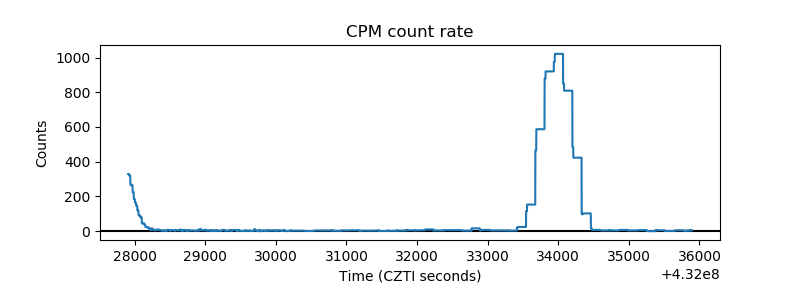 |
| CZT Counter | 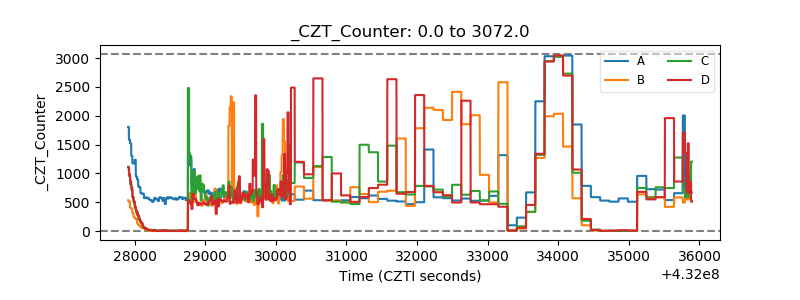 |
| +2.5 Volts monitor | 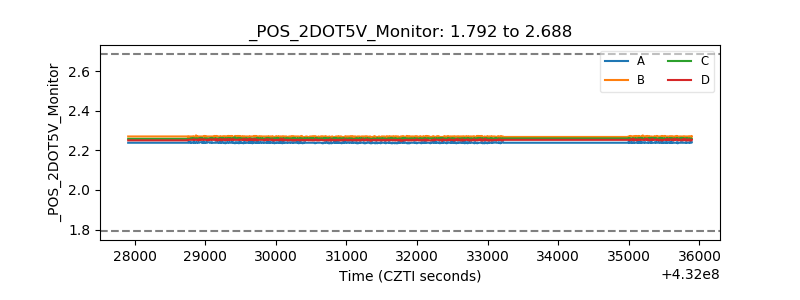 |
| +5 Volts monitor | 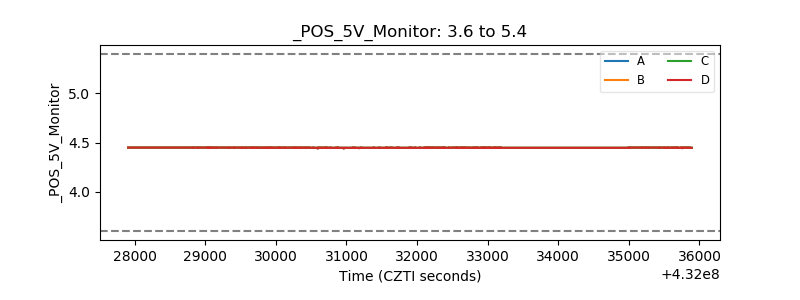 |
| _ROLL_ROT | 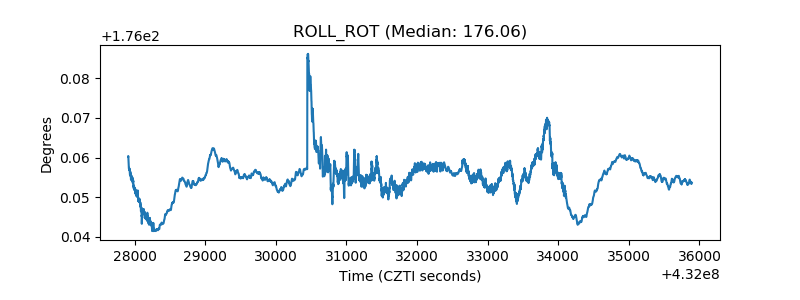 |
| _Roll_DEC | 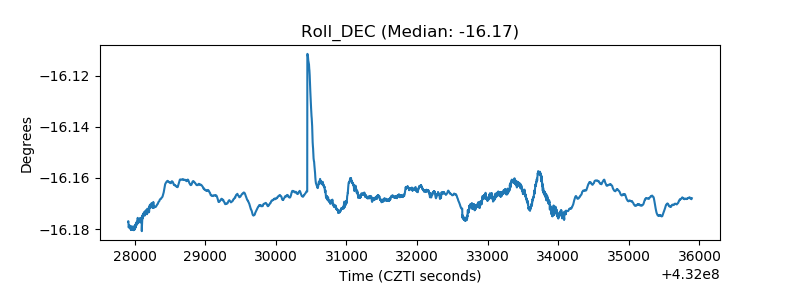 |
| _Roll_RA | 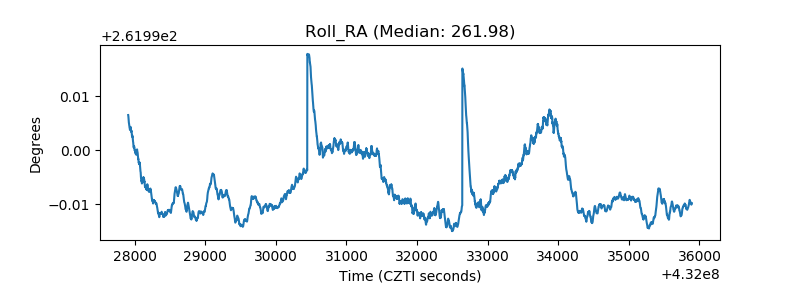 |
| Veto Counter | 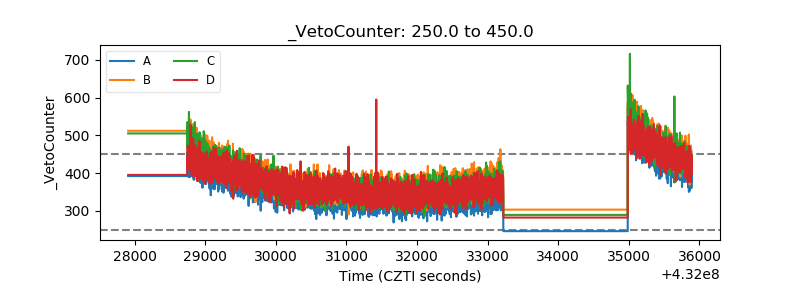 |