| Param | Original file | Final file |
|---|---|---|
| Filename | modeM0/AS1T05_148T01_9000005838_42994cztM0_level2.fits | modeM0/AS1T05_148T01_9000005838_42994cztM0_level2_quad_clean.evt |
| Size (bytes) | 480,545,280 | 119,010,240 |
| Size | 458.3 MB | 113.5 MB |
| Events in quadrant A | 3,483,710 | 871,416 |
| Events in quadrant B | 3,405,107 | 869,477 |
| Events in quadrant C | 6,421,520 | 765,646 |
| Events in quadrant D | 4,076,396 | 734,594 |
| Mode M9 | |||
|---|---|---|---|
| Quadrant | BADHDUFLAG | Total packets | Discarded packets |
| A | 0 | 25 | 0 |
| B | 0 | 26 | 0 |
| C | 0 | 26 | 0 |
| D | 0 | 26 | 0 |
| Mode SS | |||
|---|---|---|---|
| Quadrant | BADHDUFLAG | Total packets | Discarded packets |
| A | 0 | 106 | 0 |
| B | 0 | 106 | 0 |
| C | 0 | 106 | 0 |
| D | 0 | 106 | 0 |
| Mode M0 | |||
|---|---|---|---|
| Quadrant | BADHDUFLAG | Total packets | Discarded packets |
| A | 0 | 13824 | 2 |
| B | 0 | 13387 | 2 |
| C | 0 | 22724 | 2 |
| D | 0 | 15667 | 2 |
| Quadrant | Total seconds | Saturated seconds | Saturation percentage |
|---|---|---|---|
| A | 5184 | 71 | 1.369599% |
| B | 5184 | 87 | 1.678241% |
| C | 5184 | 702 | 13.541667% |
| D | 5184 | 218 | 4.205247% |
Noise dominated data is calculated using 1-second bins in cleaned event files. If a bin has >2000 counts, and if more than 50% of those come from <1% of pixels, then it is considered to be noise-dominated and hence unusable.
| Quadrant | # 1 sec bins | Bins with >0 counts | Bins with >2000 counts | High rate bins dominated by noise | Noise dominated (total time) | Noise dominated (detector-on time) | Marked lightcurve |
|---|---|---|---|---|---|---|---|
| A | 7097 | 5185 | 44 | 44 | 0.62% | 0.85% | 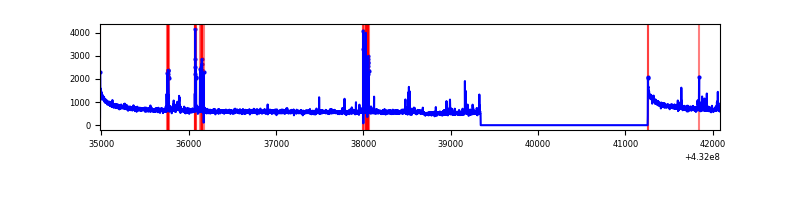 |
| B | 7097 | 5185 | 39 | 39 | 0.55% | 0.75% | 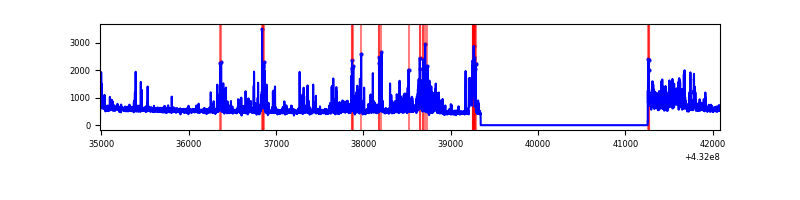 |
| C | 7097 | 5185 | 803 | 803 | 11.31% | 15.49% | 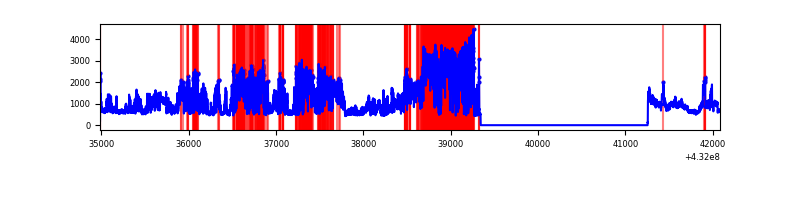 |
| D | 7097 | 5185 | 213 | 213 | 3.00% | 4.11% | 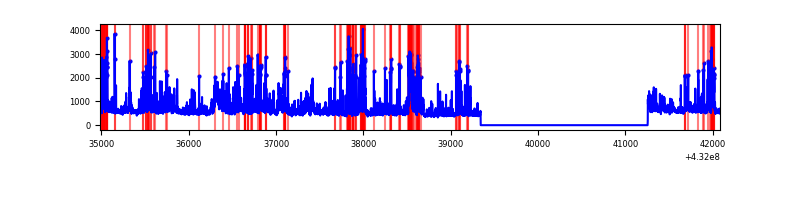 |
Top three noisy pixels from each quadrant. If the there are fewer than three noisy pixels in the level2.evt file, extra rows are filled as -1
| Pixel properties | Quadrant properties | ||||||
|---|---|---|---|---|---|---|---|
| Quadrant | DetID | PixID | Counts | Sigma | Mean | Median | Sigma |
| A | 10 | 83 | 580037 | 3640.02 | 695 | 681 | 159.2 |
| A | 15 | 237 | 163536 | 1023.2 | 695 | 681 | 159.2 |
| A | 15 | 222 | 28892 | 177.25 | 695 | 681 | 159.2 |
| B | 4 | 171 | 604111 | 4057.91 | 682 | 667 | 148.7 |
| B | 5 | 255 | 49707 | 329.77 | 682 | 667 | 148.7 |
| B | 4 | 81 | 24187 | 158.16 | 682 | 667 | 148.7 |
| C | 5 | 250 | 3735319 | 22338.89 | 629 | 630 | 167.2 |
| C | 15 | 214 | 201956 | 1204.22 | 629 | 630 | 167.2 |
| C | 5 | 233 | 30909 | 181.11 | 629 | 630 | 167.2 |
| D | 1 | 47 | 530670 | 2961.22 | 657 | 633 | 179.0 |
| D | 12 | 233 | 324385 | 1808.74 | 657 | 633 | 179.0 |
| D | 13 | 249 | 272070 | 1516.47 | 657 | 633 | 179.0 |
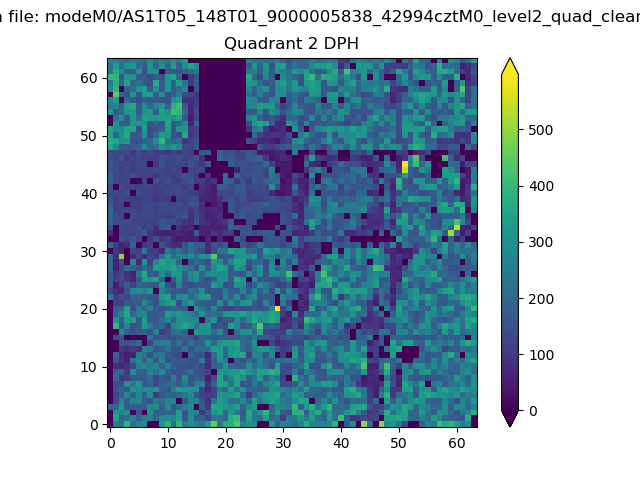
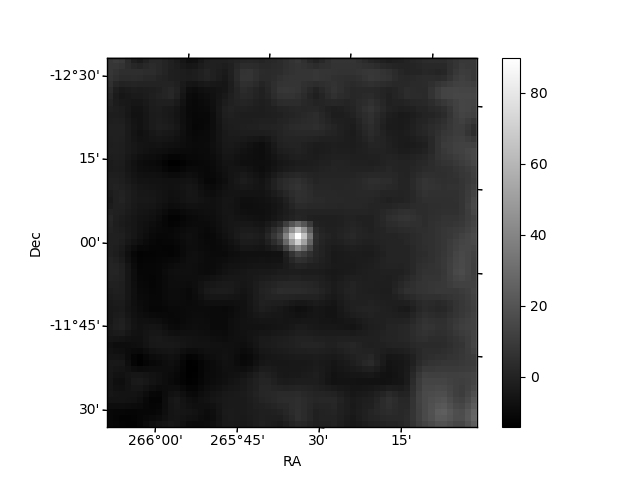
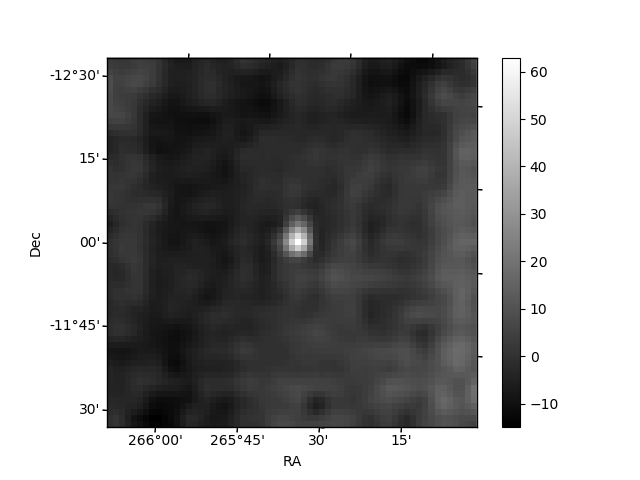
Histogram calculated using DETX and DETY for each event in the final _common_clean file
| Quadrant A |  |
 |
Quadrant B |
|---|---|---|---|
| Quadrant D | 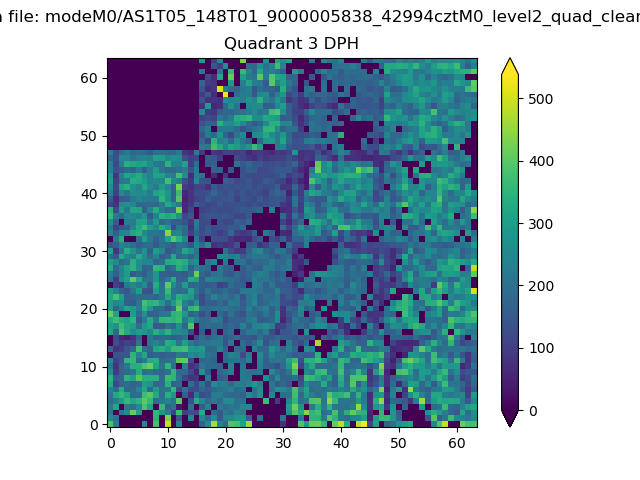 |
 |
Quadrant C |
| Plot type | Count rate plots | Images |
|---|---|---|
| Comparison with Poisson distribution Blue bars denote a histogram of data divided into 1 sec bins. Red curve is a Poisson curve with rate = median count rate of data. |
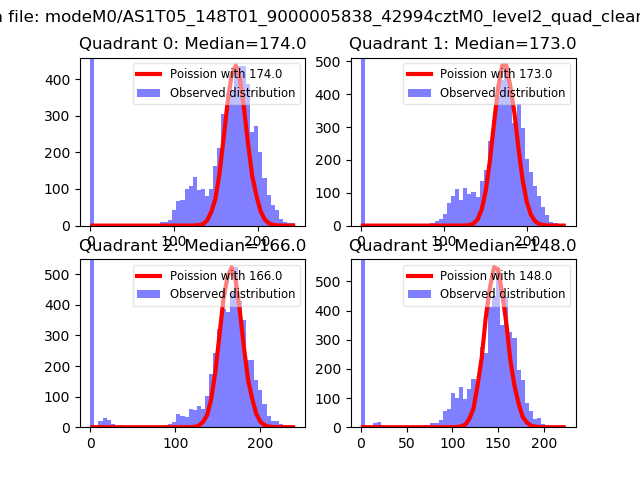 |
 |
| Quadrant-wise count rates Data is divided into 100 sec bins |
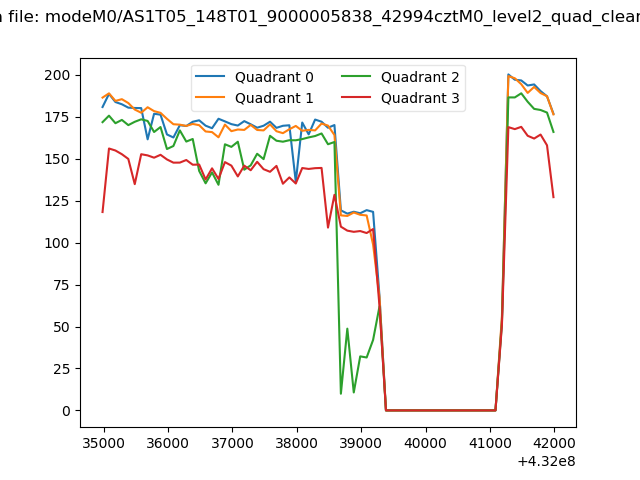 |
|
| Module-wise count rates for Quadrant A Data is divided into 100 sec bins |
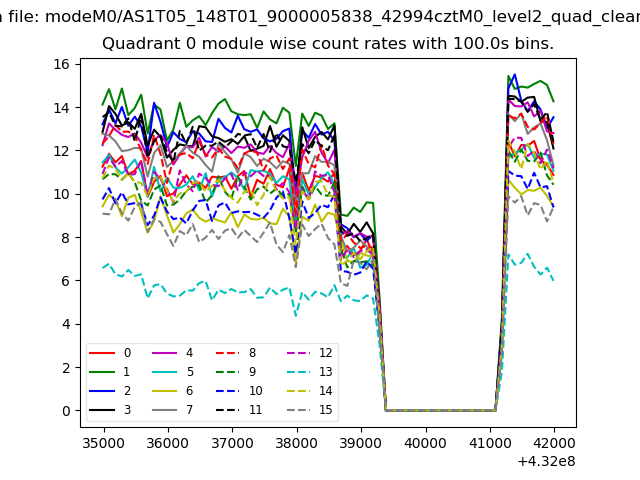 |
 |
| Module-wise count rates for Quadrant B Data is divided into 100 sec bins |
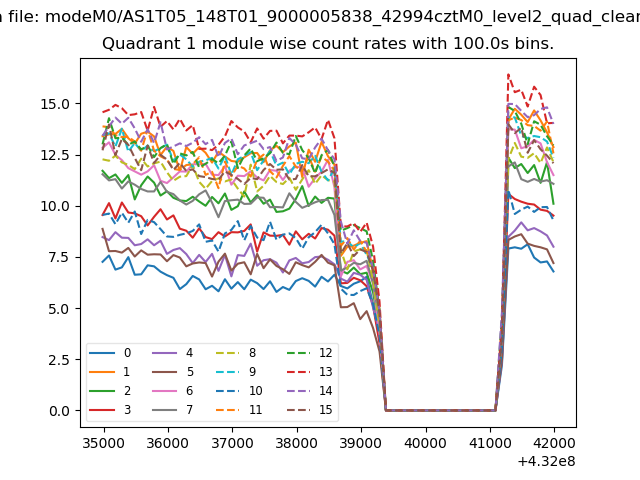 |
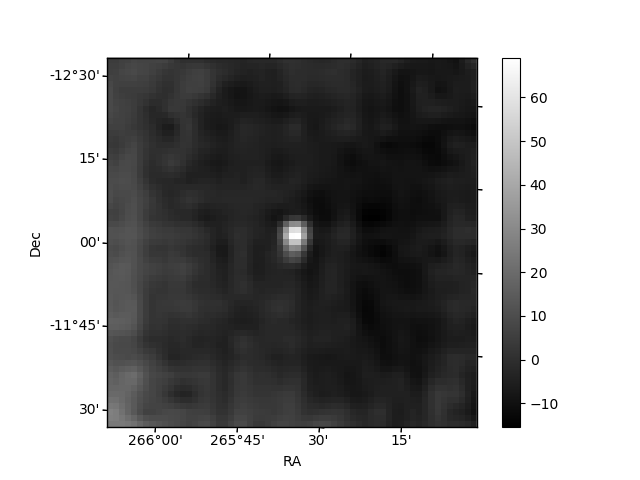 |
| Module-wise count rates for Quadrant C Data is divided into 100 sec bins |
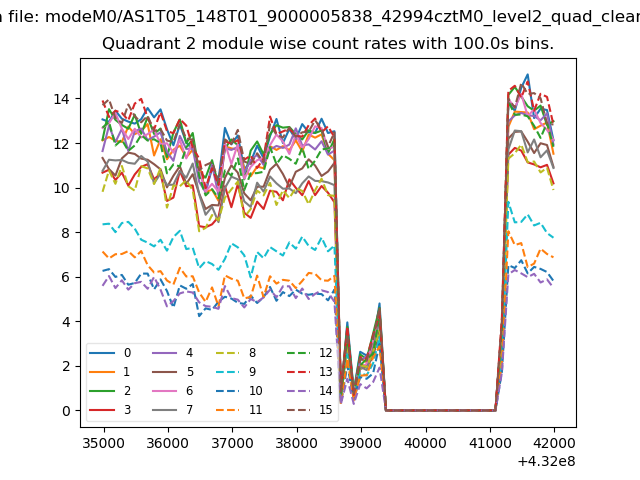 |
 |
| Module-wise count rates for Quadrant D Data is divided into 100 sec bins |
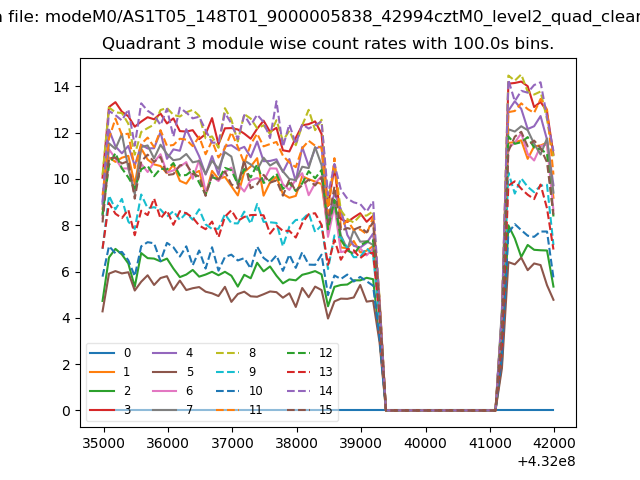 |
 |
| Parameter | Plot |
|---|---|
| CZT HV Monitor | 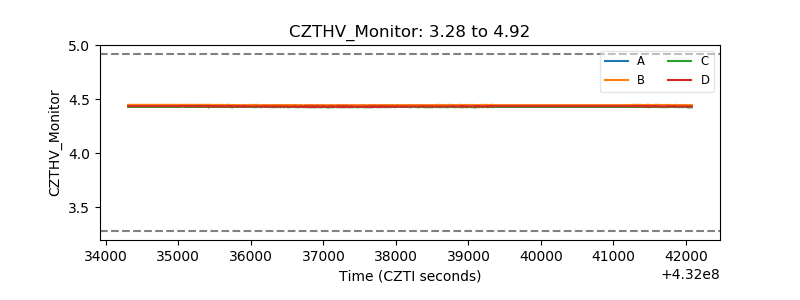 |
| D_VDD | 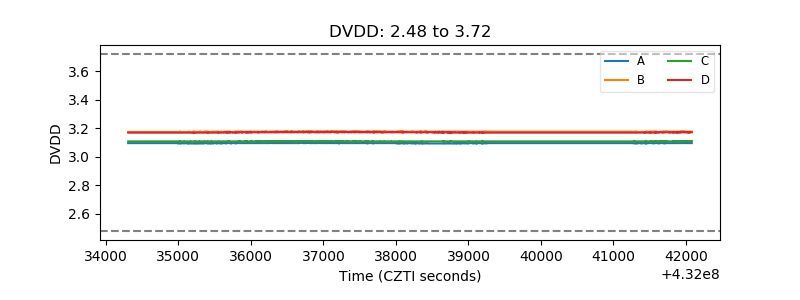 |
| Temperature 1 | 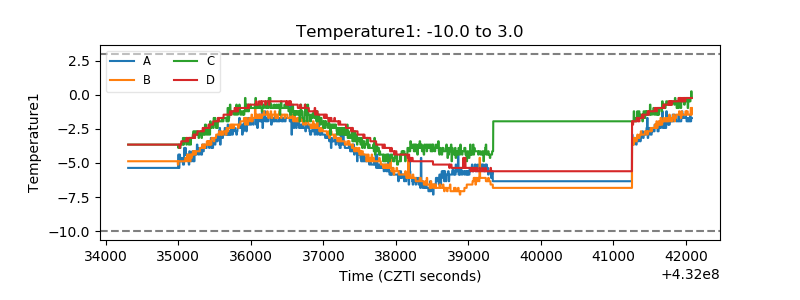 |
| Veto HV Monitor | 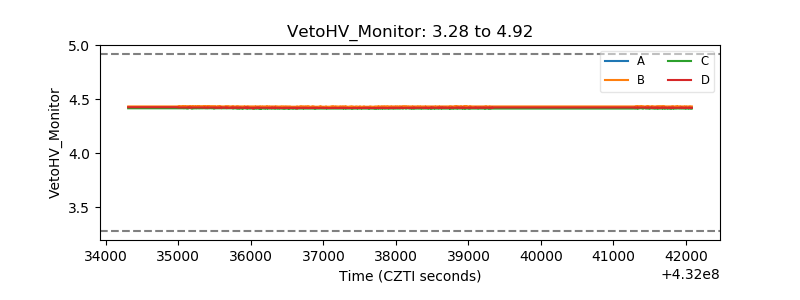 |
| Veto LLD | 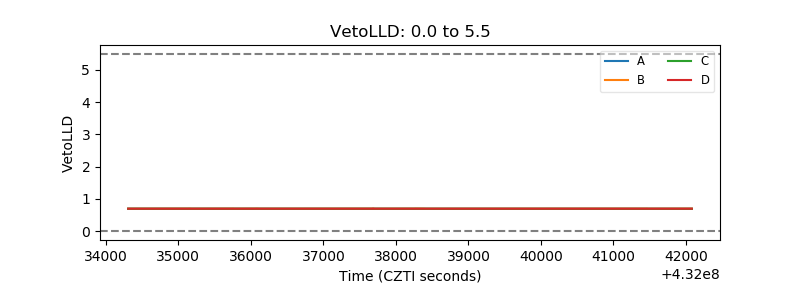 |
| Alpha Counter | 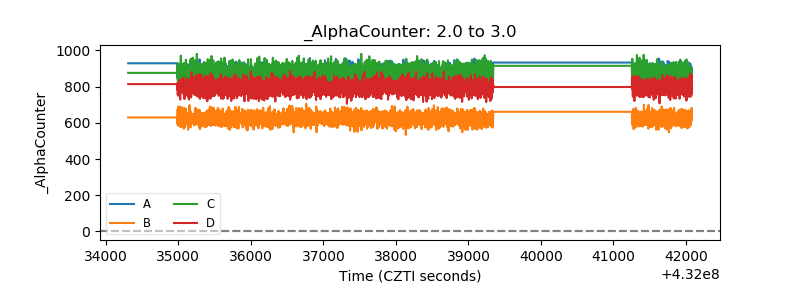 |
| _CPM_Rate |  |
| CZT Counter | 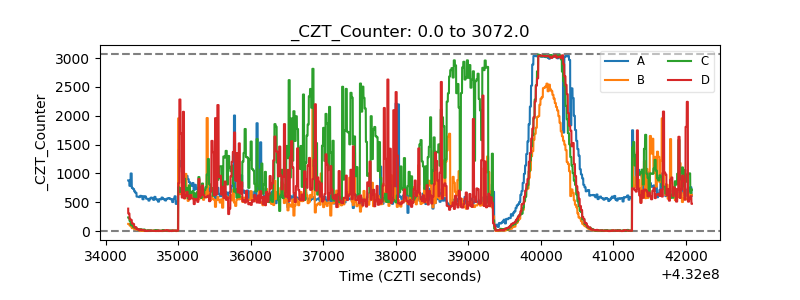 |
| +2.5 Volts monitor |  |
| +5 Volts monitor | 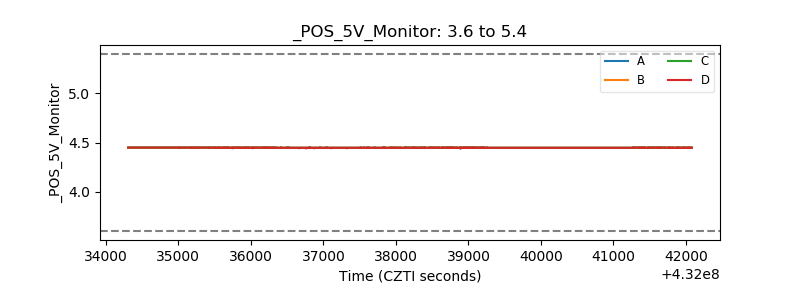 |
| _ROLL_ROT | 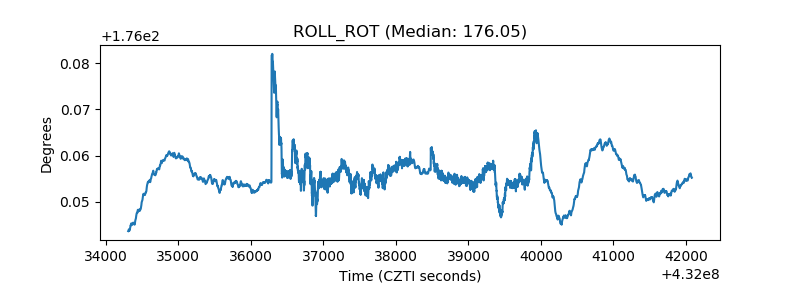 |
| _Roll_DEC | 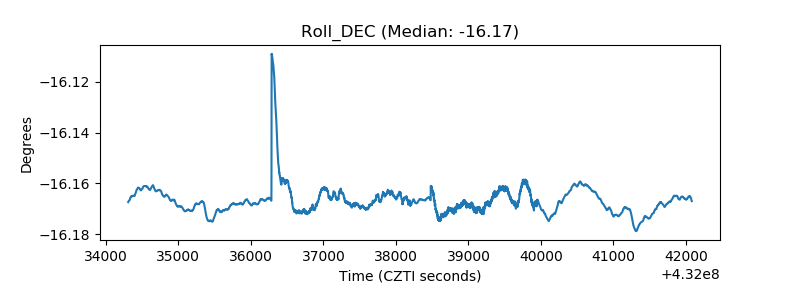 |
| _Roll_RA | 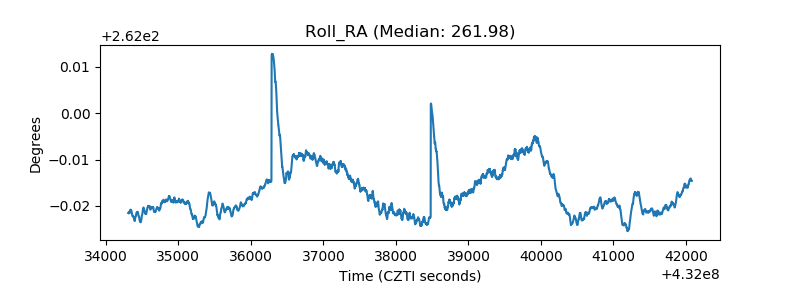 |
| Veto Counter | 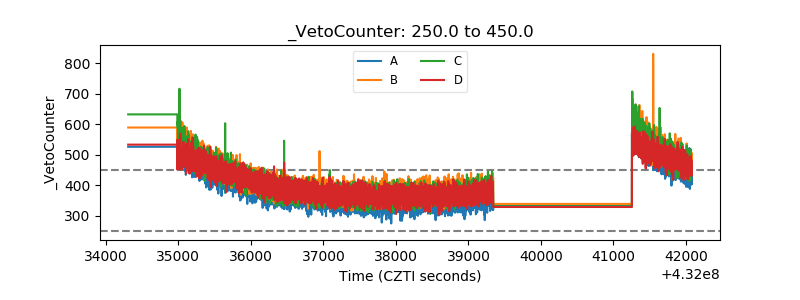 |