| Param | Original file | Final file |
|---|---|---|
| Filename | modeM0/AS1T05_148T01_9000005838_42995cztM0_level2.fits | modeM0/AS1T05_148T01_9000005838_42995cztM0_level2_quad_clean.evt |
| Size (bytes) | 420,298,560 | 121,446,720 |
| Size | 400.8 MB | 115.8 MB |
| Events in quadrant A | 3,518,707 | 890,017 |
| Events in quadrant B | 3,234,508 | 889,209 |
| Events in quadrant C | 4,686,018 | 786,056 |
| Events in quadrant D | 3,710,442 | 745,059 |
| Mode M9 | |||
|---|---|---|---|
| Quadrant | BADHDUFLAG | Total packets | Discarded packets |
| A | 0 | 21 | 0 |
| B | 0 | 22 | 0 |
| C | 0 | 22 | 0 |
| D | 0 | 22 | 0 |
| Mode SS | |||
|---|---|---|---|
| Quadrant | BADHDUFLAG | Total packets | Discarded packets |
| A | 0 | 106 | 0 |
| B | 0 | 106 | 0 |
| C | 0 | 106 | 0 |
| D | 0 | 106 | 0 |
| Mode M0 | |||
|---|---|---|---|
| Quadrant | BADHDUFLAG | Total packets | Discarded packets |
| A | 0 | 14074 | 2 |
| B | 0 | 12978 | 2 |
| C | 0 | 17317 | 2 |
| D | 0 | 14507 | 4 |
| Quadrant | Total seconds | Saturated seconds | Saturation percentage |
|---|---|---|---|
| A | 5257 | 62 | 1.179380% |
| B | 5257 | 62 | 1.179380% |
| C | 5257 | 533 | 10.138862% |
| D | 5256 | 236 | 4.490107% |
Noise dominated data is calculated using 1-second bins in cleaned event files. If a bin has >2000 counts, and if more than 50% of those come from <1% of pixels, then it is considered to be noise-dominated and hence unusable.
| Quadrant | # 1 sec bins | Bins with >0 counts | Bins with >2000 counts | High rate bins dominated by noise | Noise dominated (total time) | Noise dominated (detector-on time) | Marked lightcurve |
|---|---|---|---|---|---|---|---|
| A | 7290 | 5258 | 36 | 36 | 0.49% | 0.68% | 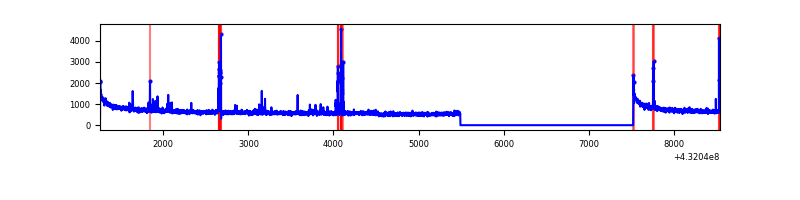 |
| B | 7290 | 5258 | 25 | 25 | 0.34% | 0.48% | 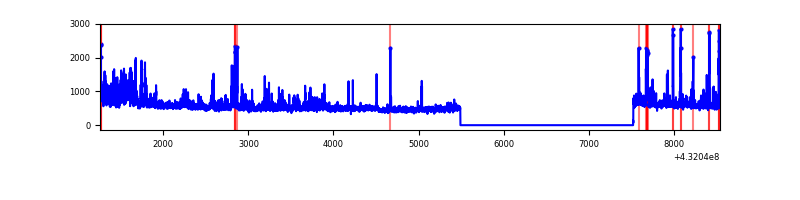 |
| C | 7290 | 5258 | 510 | 510 | 7.00% | 9.70% | 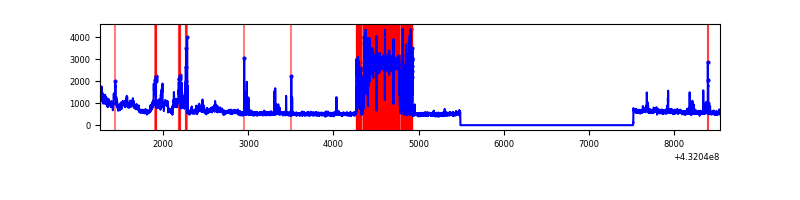 |
| D | 7289 | 5256 | 210 | 210 | 2.88% | 4.00% | 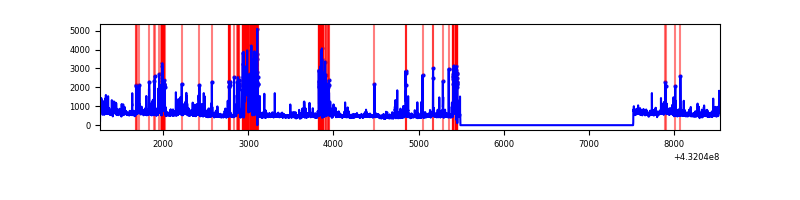 |
Top three noisy pixels from each quadrant. If the there are fewer than three noisy pixels in the level2.evt file, extra rows are filled as -1
| Pixel properties | Quadrant properties | ||||||
|---|---|---|---|---|---|---|---|
| Quadrant | DetID | PixID | Counts | Sigma | Mean | Median | Sigma |
| A | 10 | 83 | 607641 | 3764.31 | 707 | 693 | 161.2 |
| A | 15 | 237 | 139203 | 859.04 | 707 | 693 | 161.2 |
| A | 13 | 6 | 14727 | 87.04 | 707 | 693 | 161.2 |
| B | 4 | 171 | 283208 | 1894.05 | 694 | 679 | 149.2 |
| B | 5 | 255 | 105811 | 704.8 | 694 | 679 | 149.2 |
| B | 15 | 85 | 70978 | 471.28 | 694 | 679 | 149.2 |
| C | 5 | 250 | 1936998 | 11793.9 | 630 | 633 | 164.2 |
| C | 15 | 214 | 202057 | 1226.82 | 630 | 633 | 164.2 |
| C | 5 | 233 | 38912 | 233.15 | 630 | 633 | 164.2 |
| D | 10 | 118 | 340976 | 1897.24 | 665 | 642 | 179.4 |
| D | 1 | 47 | 193588 | 1075.61 | 665 | 642 | 179.4 |
| D | 1 | 52 | 187191 | 1039.95 | 665 | 642 | 179.4 |
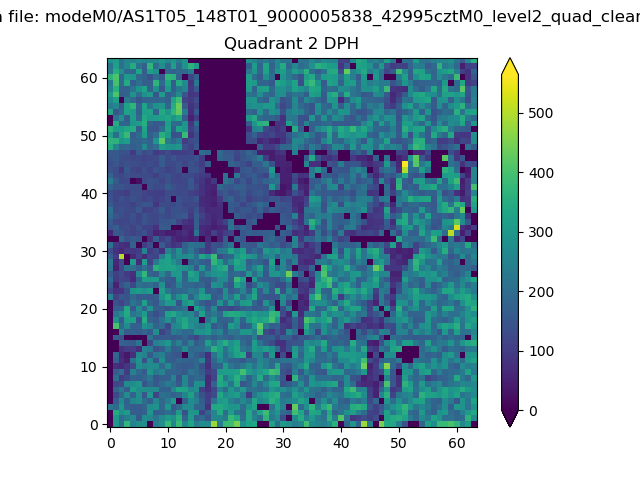
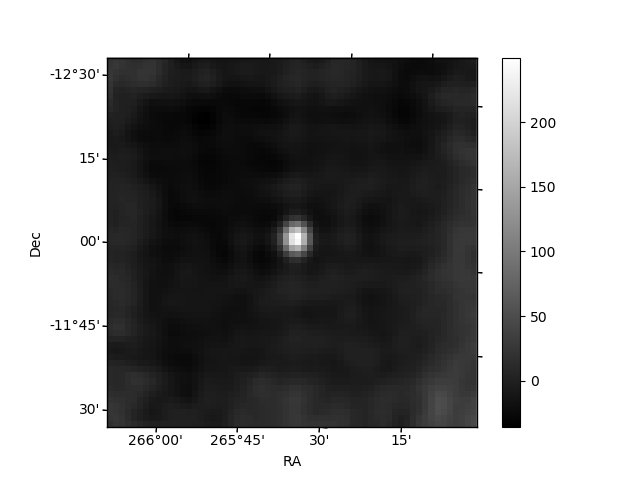
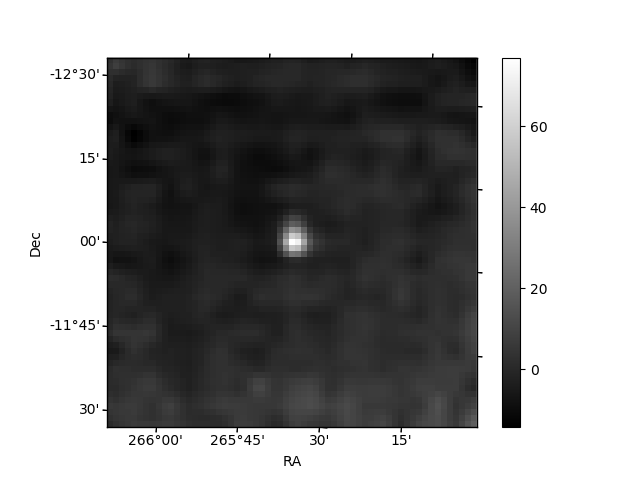
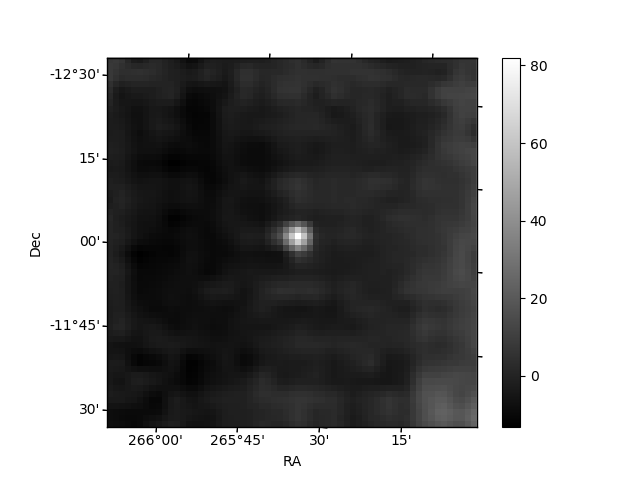
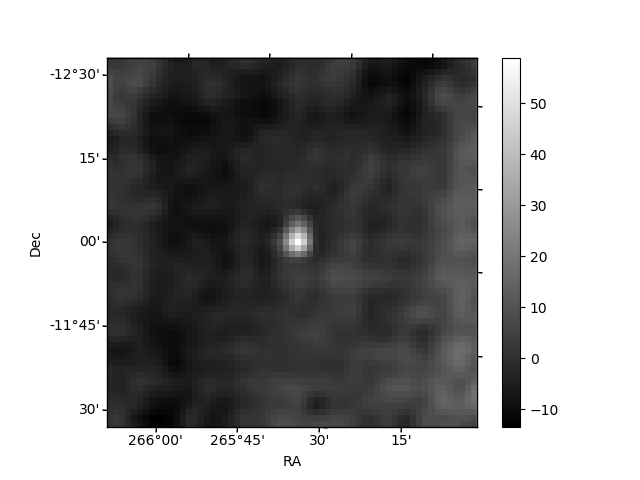
Histogram calculated using DETX and DETY for each event in the final _common_clean file
| Quadrant A | 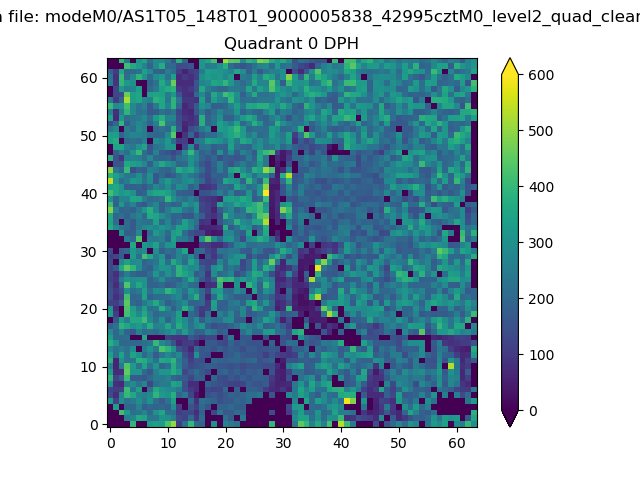 |
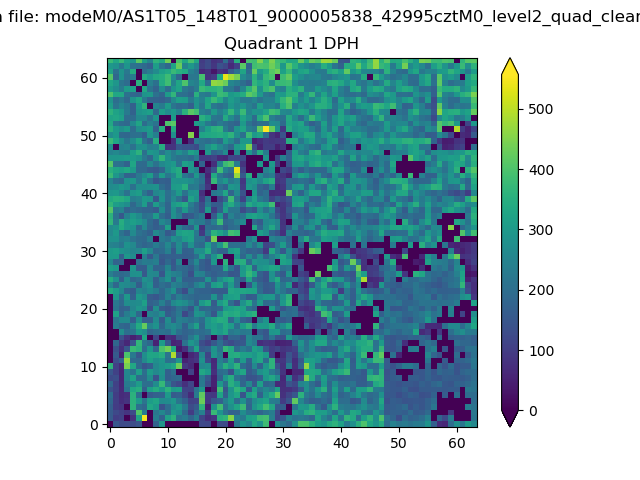 |
Quadrant B |
|---|---|---|---|
| Quadrant D | 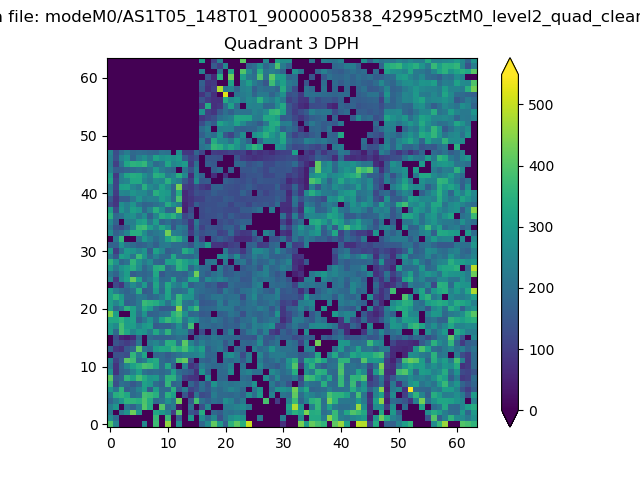 |
 |
Quadrant C |
| Plot type | Count rate plots | Images |
|---|---|---|
| Comparison with Poisson distribution Blue bars denote a histogram of data divided into 1 sec bins. Red curve is a Poisson curve with rate = median count rate of data. |
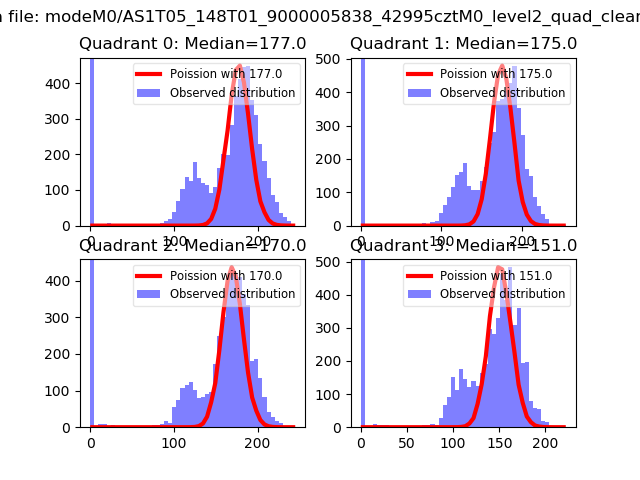 |
 |
| Quadrant-wise count rates Data is divided into 100 sec bins |
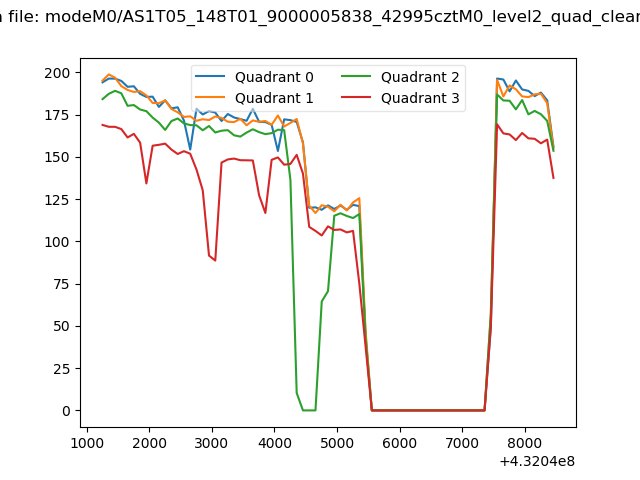 |
|
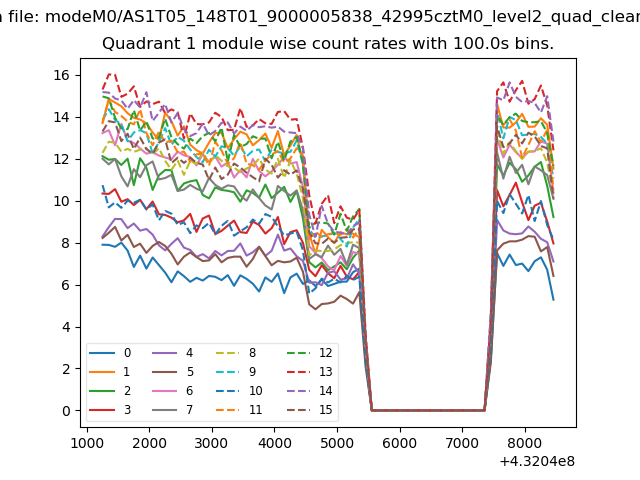
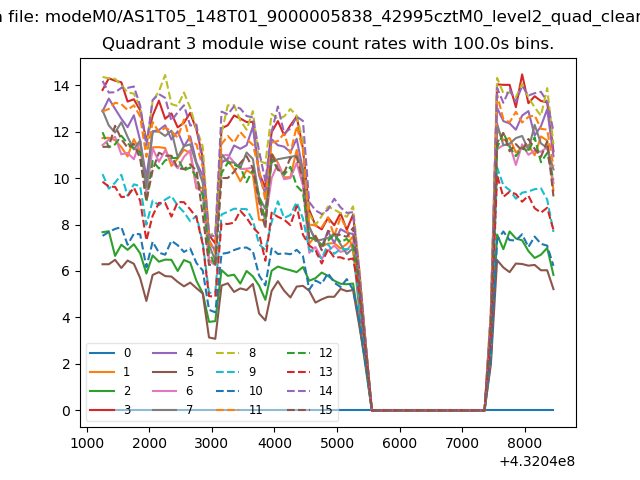
| Module-wise count rates for Quadrant A Data is divided into 100 sec bins |
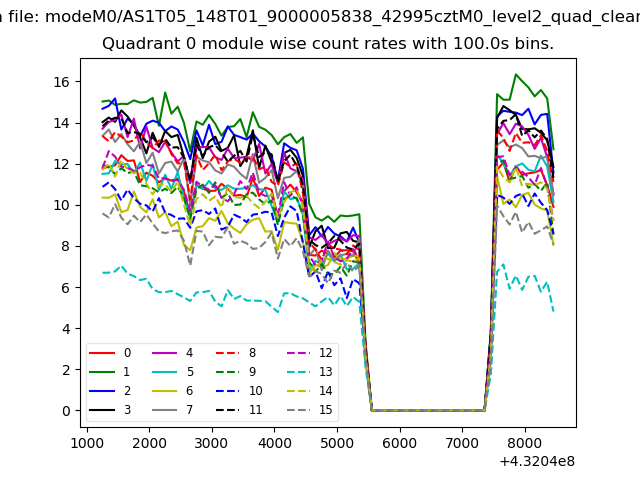 |
 |
| Module-wise count rates for Quadrant B Data is divided into 100 sec bins |
 |
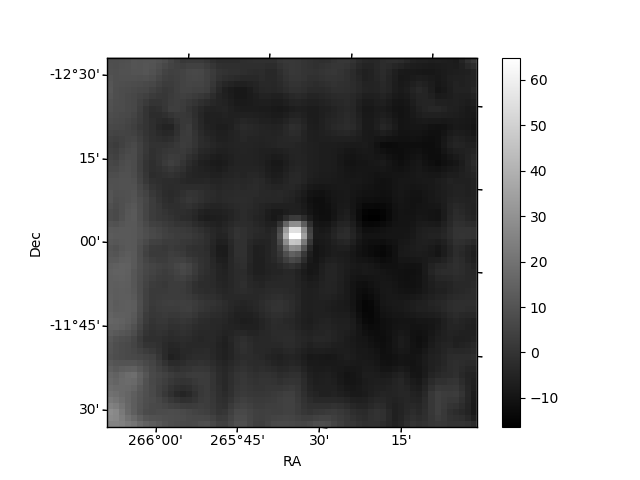 |
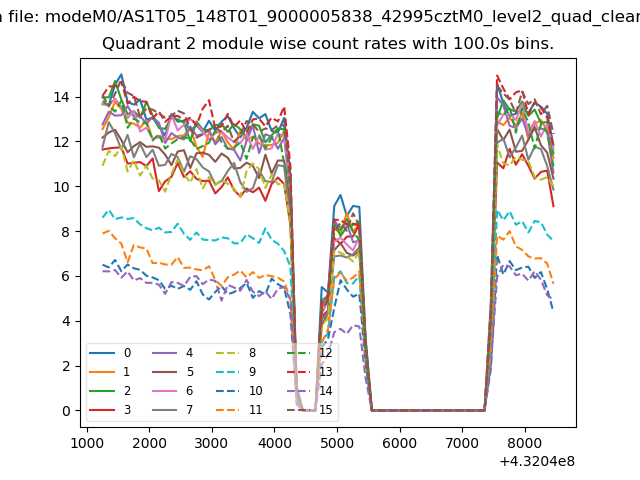
| Module-wise count rates for Quadrant C Data is divided into 100 sec bins |
 |
 |
| Module-wise count rates for Quadrant D Data is divided into 100 sec bins |
 |
 |
| Parameter | Plot |
|---|---|
| CZT HV Monitor | 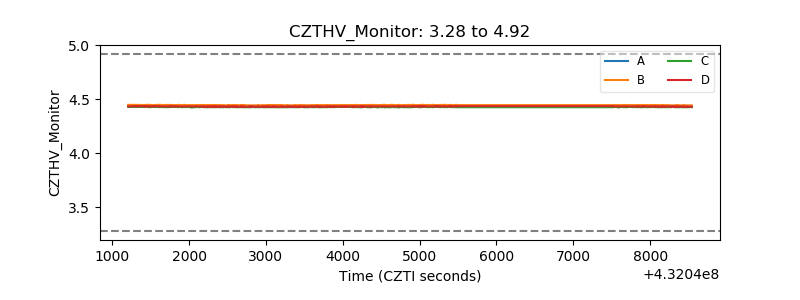 |
| D_VDD | 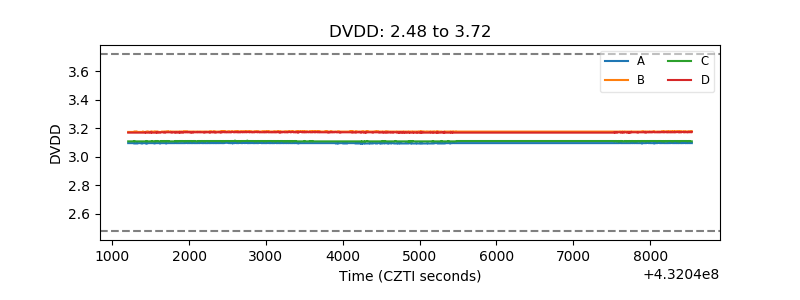 |
| Temperature 1 | 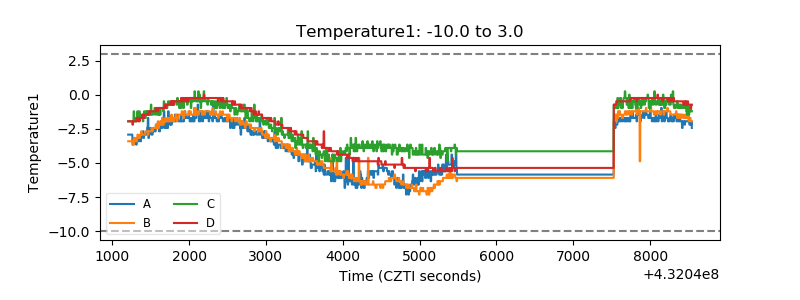 |
| Veto HV Monitor | 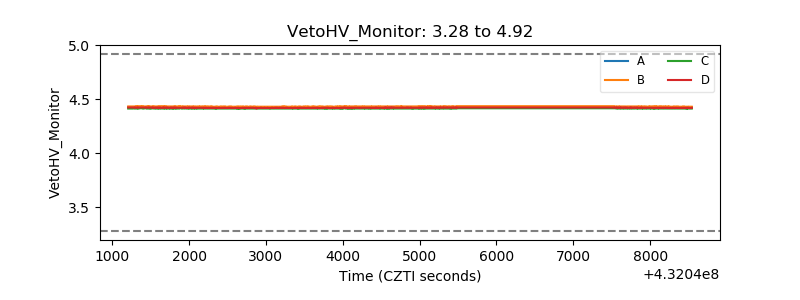 |
| Veto LLD | 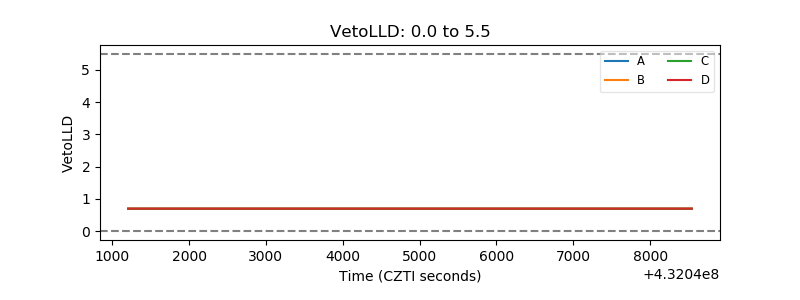 |
| Alpha Counter | 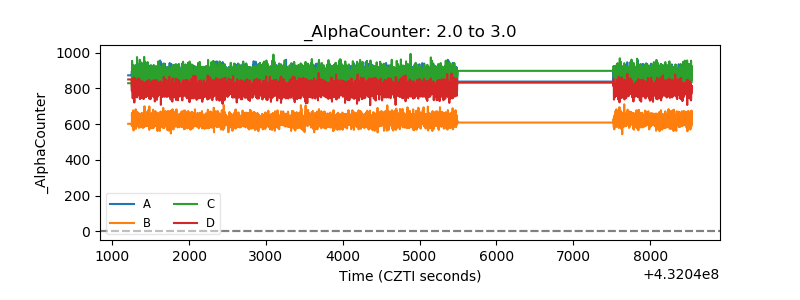 |
| _CPM_Rate | 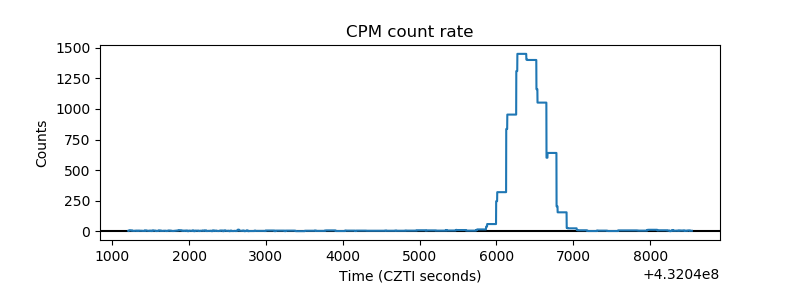 |
| CZT Counter | 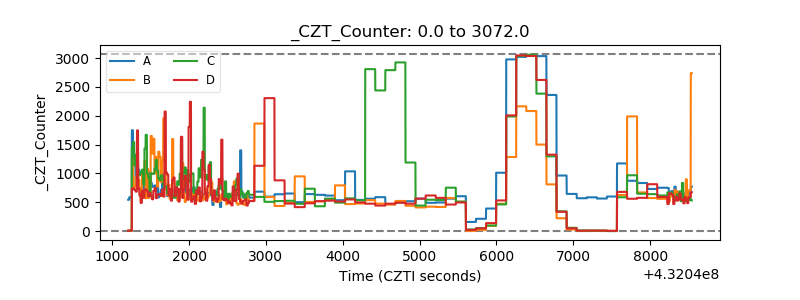 |
| +2.5 Volts monitor |  |
| +5 Volts monitor | 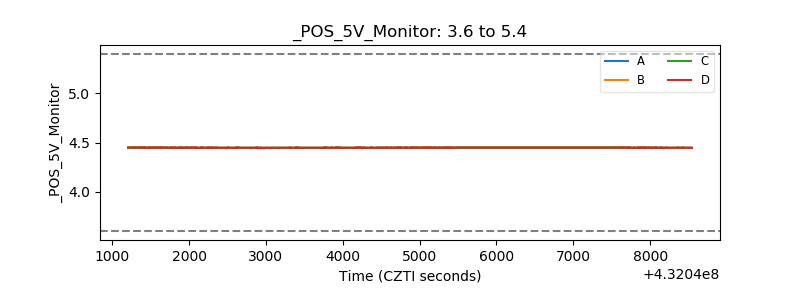 |
| _ROLL_ROT | 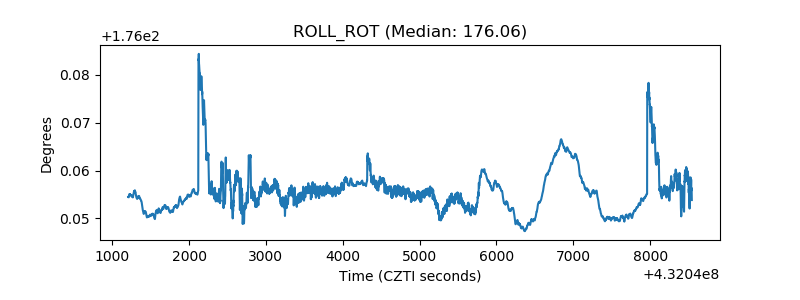 |
| _Roll_DEC | 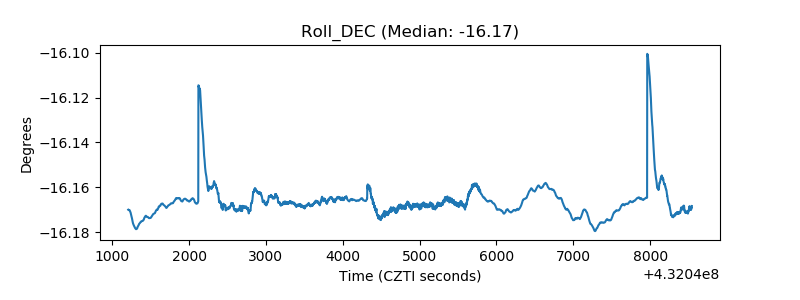 |
| _Roll_RA | 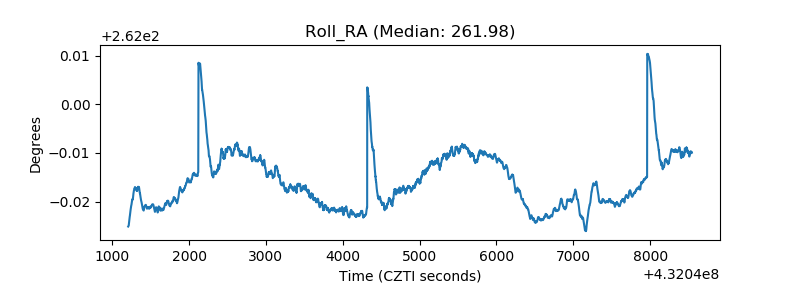 |
| Veto Counter | 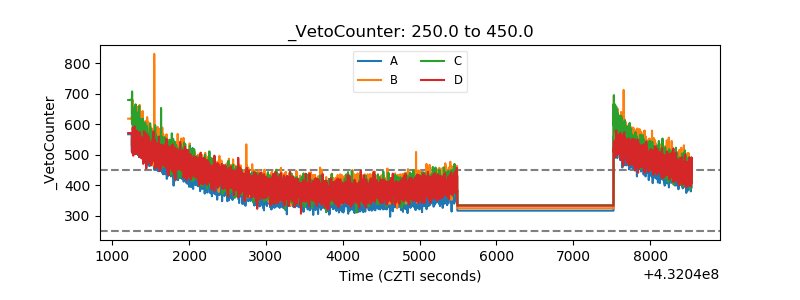 |