| Param | Original file | Final file |
|---|---|---|
| Filename | modeM0/AS1T05_148T01_9000005838_42996cztM0_level2.fits | modeM0/AS1T05_148T01_9000005838_42996cztM0_level2_quad_clean.evt |
| Size (bytes) | 400,115,520 | 109,399,680 |
| Size | 381.6 MB | 104.3 MB |
| Events in quadrant A | 3,358,667 | 819,804 |
| Events in quadrant B | 4,491,832 | 681,361 |
| Events in quadrant C | 2,715,526 | 783,063 |
| Events in quadrant D | 3,854,802 | 677,549 |
| Mode M9 | |||
|---|---|---|---|
| Quadrant | BADHDUFLAG | Total packets | Discarded packets |
| A | 0 | 21 | 0 |
| B | 0 | 21 | 0 |
| C | 0 | 21 | 0 |
| D | 0 | 21 | 0 |
| Mode SS | |||
|---|---|---|---|
| Quadrant | BADHDUFLAG | Total packets | Discarded packets |
| A | 0 | 102 | 0 |
| B | 0 | 102 | 0 |
| C | 0 | 102 | 0 |
| D | 0 | 102 | 0 |
| Mode M0 | |||
|---|---|---|---|
| Quadrant | BADHDUFLAG | Total packets | Discarded packets |
| A | 0 | 13388 | 1 |
| B | 0 | 16614 | 8 |
| C | 0 | 10998 | 1 |
| D | 0 | 14780 | 1 |
| Quadrant | Total seconds | Saturated seconds | Saturation percentage |
|---|---|---|---|
| A | 5016 | 77 | 1.535088% |
| B | 5015 | 839 | 16.729811% |
| C | 5015 | 4 | 0.079761% |
| D | 5015 | 321 | 6.400798% |
Noise dominated data is calculated using 1-second bins in cleaned event files. If a bin has >2000 counts, and if more than 50% of those come from <1% of pixels, then it is considered to be noise-dominated and hence unusable.
| Quadrant | # 1 sec bins | Bins with >0 counts | Bins with >2000 counts | High rate bins dominated by noise | Noise dominated (total time) | Noise dominated (detector-on time) | Marked lightcurve |
|---|---|---|---|---|---|---|---|
| A | 7140 | 5017 | 56 | 56 | 0.78% | 1.12% | 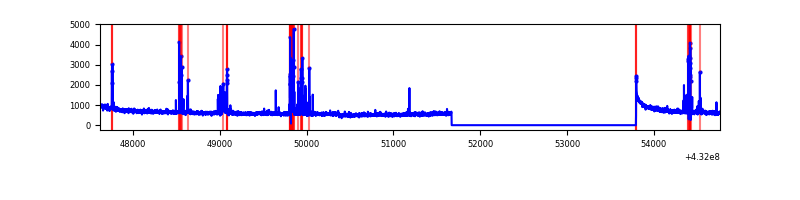 |
| B | 7139 | 5016 | 754 | 754 | 10.56% | 15.03% |  |
| C | 7139 | 5016 | 3 | 3 | 0.04% | 0.06% | 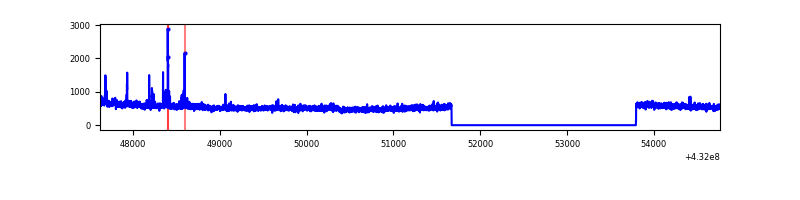 |
| D | 7139 | 5016 | 316 | 316 | 4.43% | 6.30% | 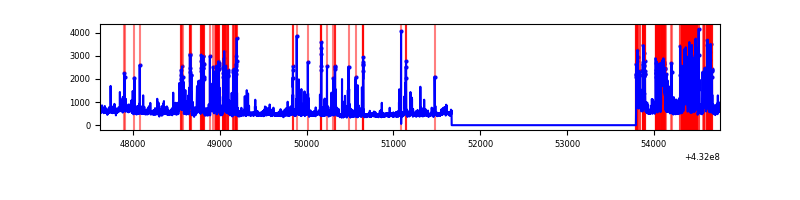 |
Top three noisy pixels from each quadrant. If the there are fewer than three noisy pixels in the level2.evt file, extra rows are filled as -1
| Pixel properties | Quadrant properties | ||||||
|---|---|---|---|---|---|---|---|
| Quadrant | DetID | PixID | Counts | Sigma | Mean | Median | Sigma |
| A | 10 | 83 | 552045 | 3753.09 | 653 | 645 | 146.9 |
| A | 15 | 237 | 255921 | 1737.53 | 653 | 645 | 146.9 |
| A | 13 | 6 | 12394 | 79.97 | 653 | 645 | 146.9 |
| B | 4 | 81 | 1834583 | 15151.5 | 573 | 561 | 121.0 |
| B | 5 | 255 | 195381 | 1609.48 | 573 | 561 | 121.0 |
| B | 4 | 171 | 155935 | 1283.6 | 573 | 561 | 121.0 |
| C | 15 | 214 | 205526 | 1288.6 | 626 | 632 | 159.0 |
| C | 14 | 254 | 39346 | 243.48 | 626 | 632 | 159.0 |
| C | 5 | 250 | 21821 | 133.26 | 626 | 632 | 159.0 |
| D | 1 | 47 | 664576 | 4064.64 | 611 | 592 | 163.4 |
| D | 1 | 52 | 358697 | 2192.17 | 611 | 592 | 163.4 |
| D | 10 | 118 | 228717 | 1396.49 | 611 | 592 | 163.4 |
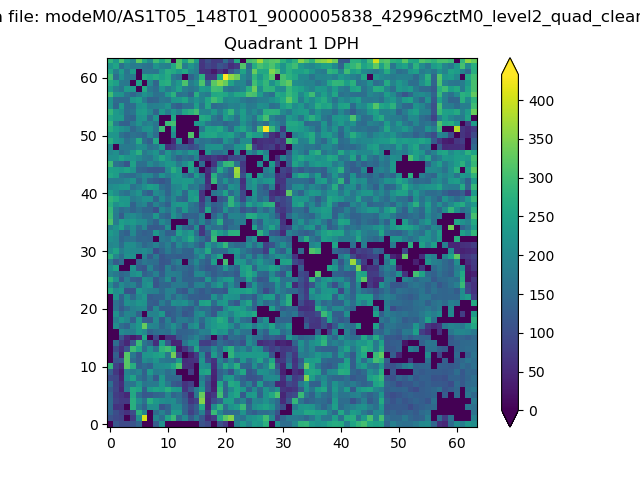
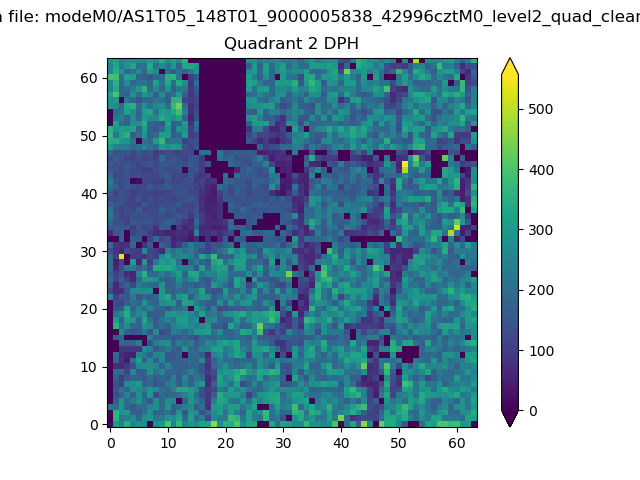
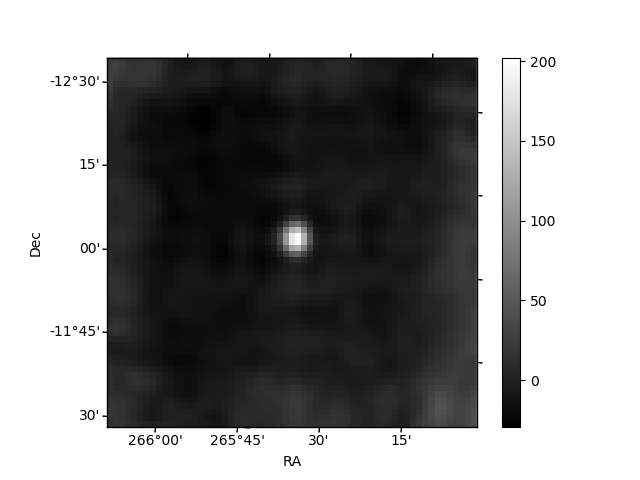
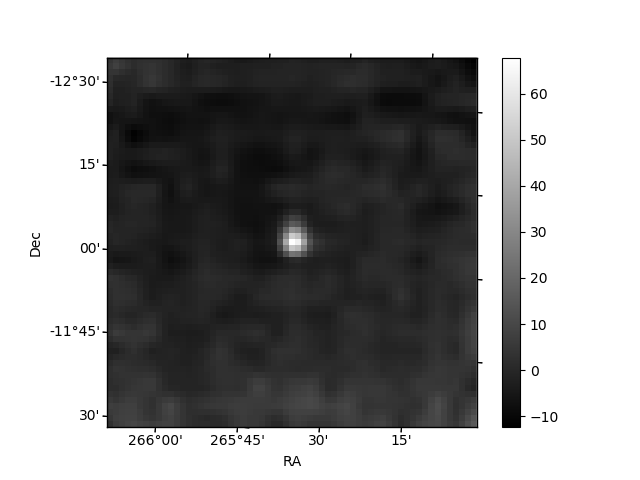
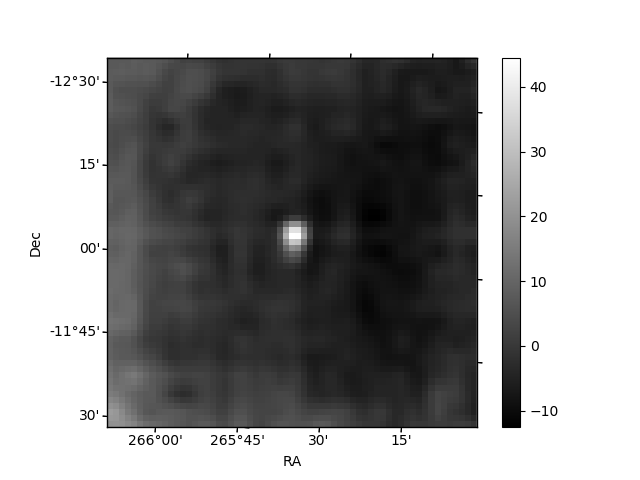
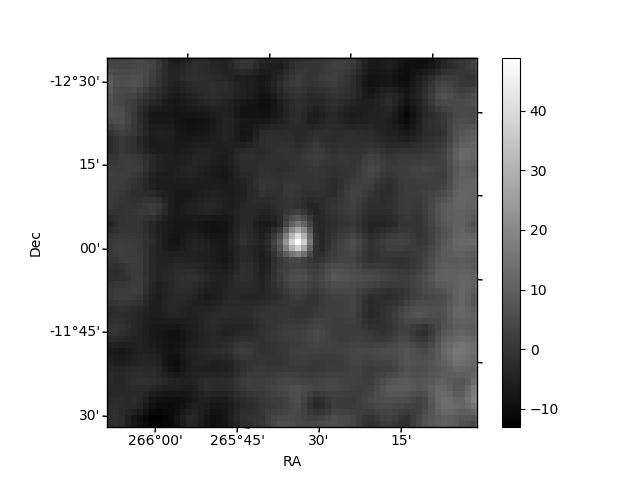
Histogram calculated using DETX and DETY for each event in the final _common_clean file
| Quadrant A | 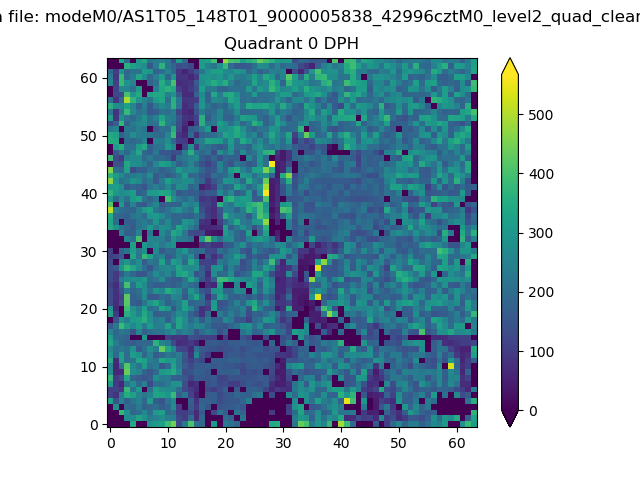 |
 |
Quadrant B |
|---|---|---|---|
| Quadrant D | 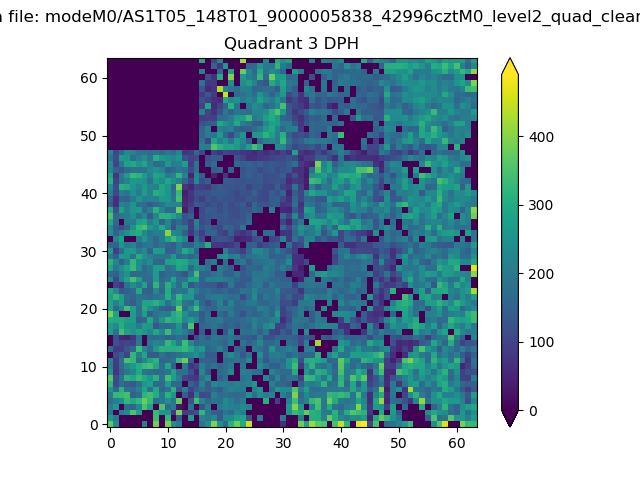 |
 |
Quadrant C |
| Plot type | Count rate plots | Images |
|---|---|---|
| Comparison with Poisson distribution Blue bars denote a histogram of data divided into 1 sec bins. Red curve is a Poisson curve with rate = median count rate of data. |
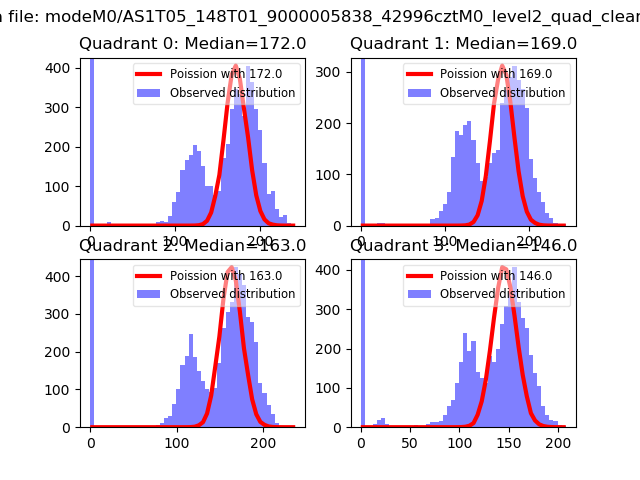 |
 |
| Quadrant-wise count rates Data is divided into 100 sec bins |
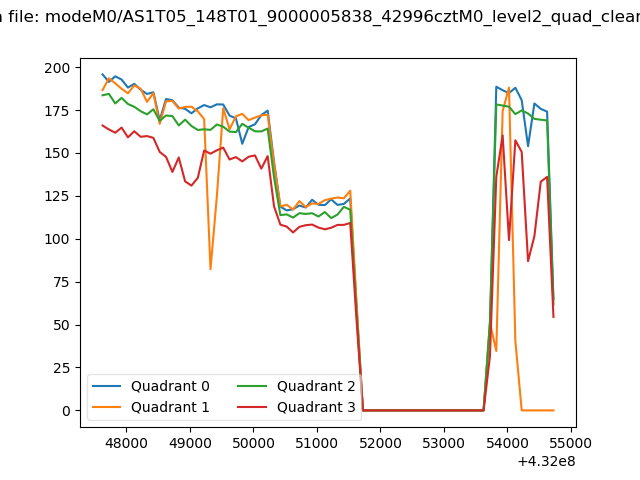 |
|
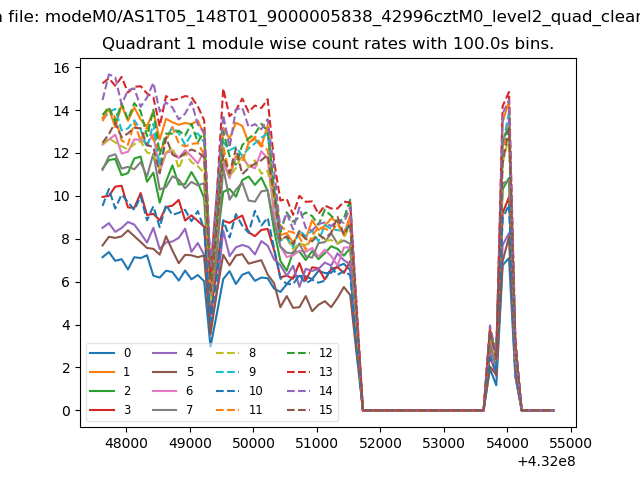
| Module-wise count rates for Quadrant A Data is divided into 100 sec bins |
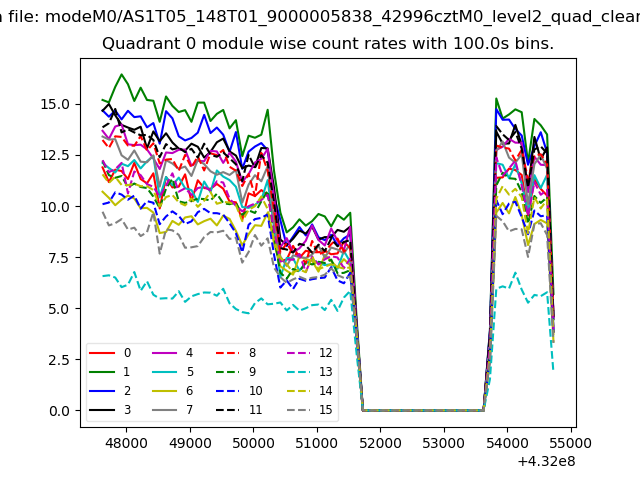 |
 |
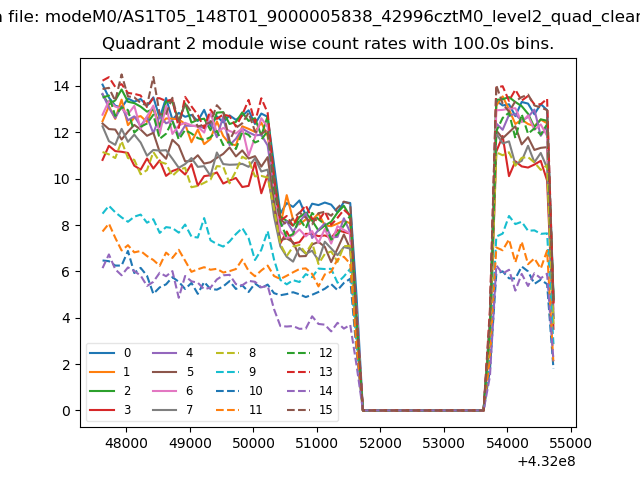
| Module-wise count rates for Quadrant B Data is divided into 100 sec bins |
 |
 |
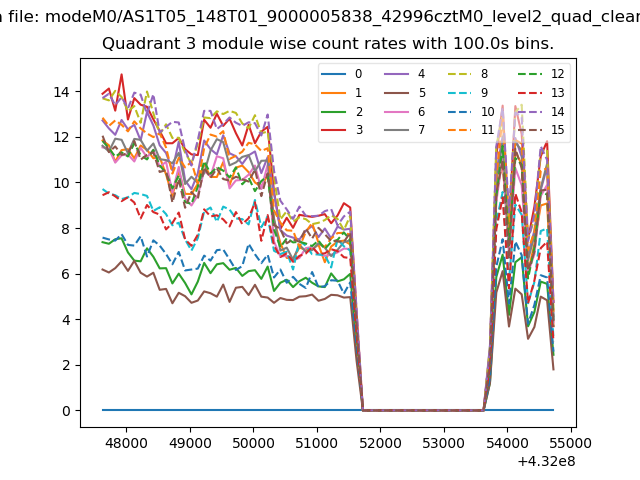
| Module-wise count rates for Quadrant C Data is divided into 100 sec bins |
 |
 |
| Module-wise count rates for Quadrant D Data is divided into 100 sec bins |
 |
 |
| Parameter | Plot |
|---|---|
| CZT HV Monitor | 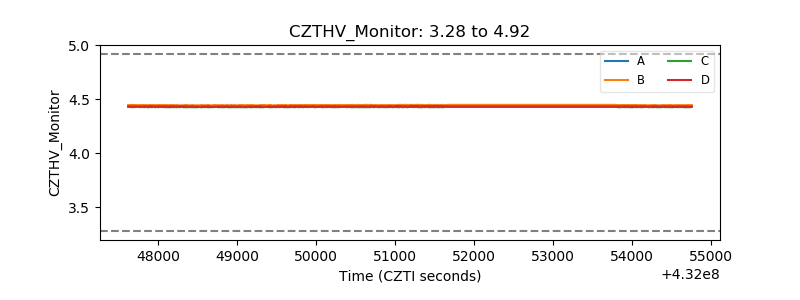 |
| D_VDD | 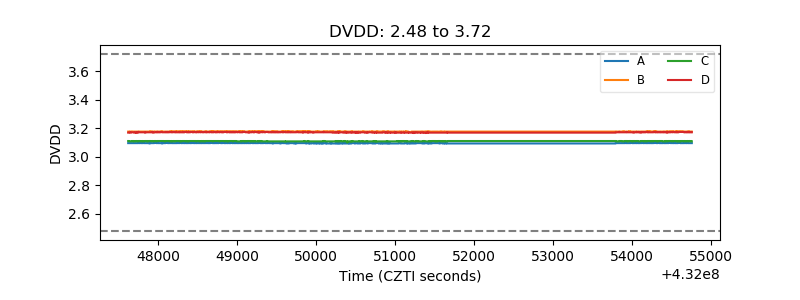 |
| Temperature 1 | 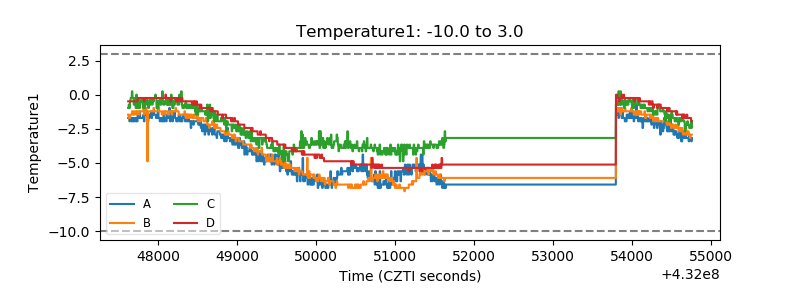 |
| Veto HV Monitor | 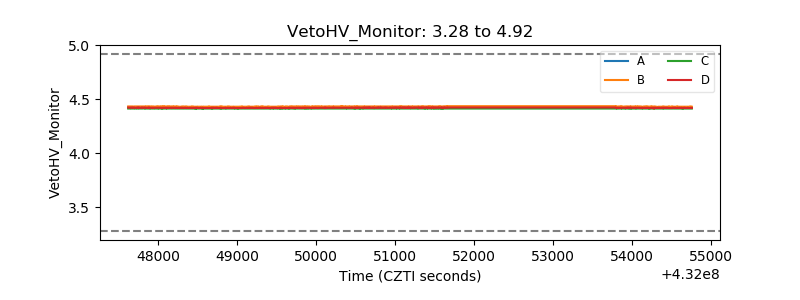 |
| Veto LLD | 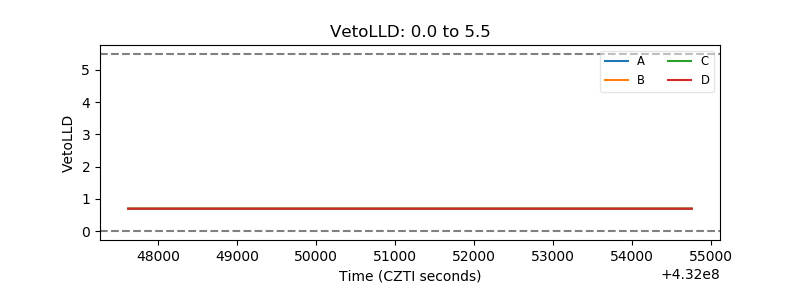 |
| Alpha Counter | 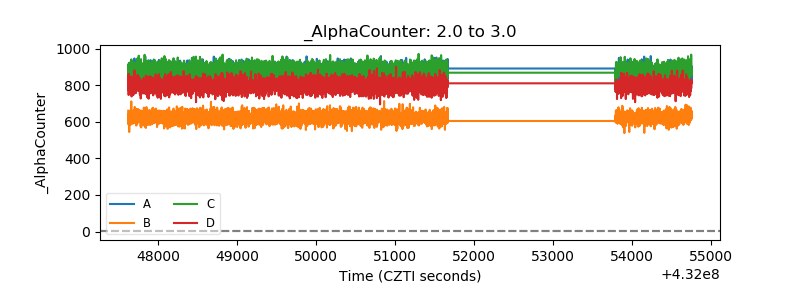 |
| _CPM_Rate | 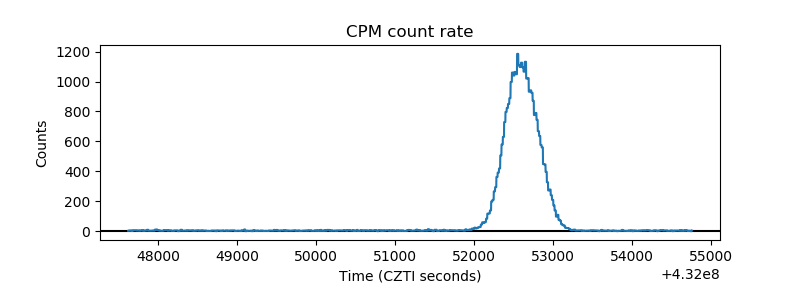 |
| CZT Counter | 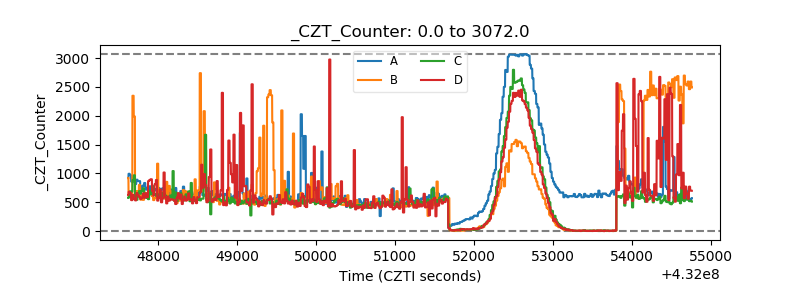 |
| +2.5 Volts monitor | 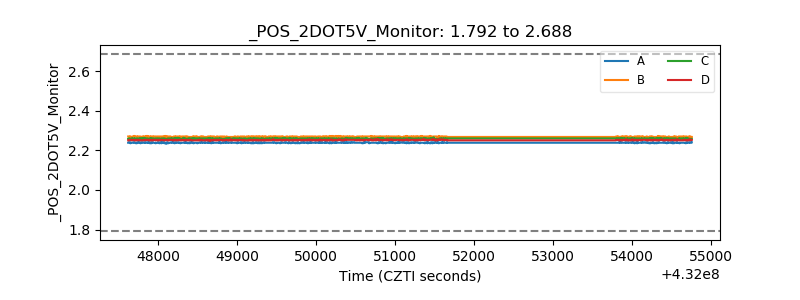 |
| +5 Volts monitor | 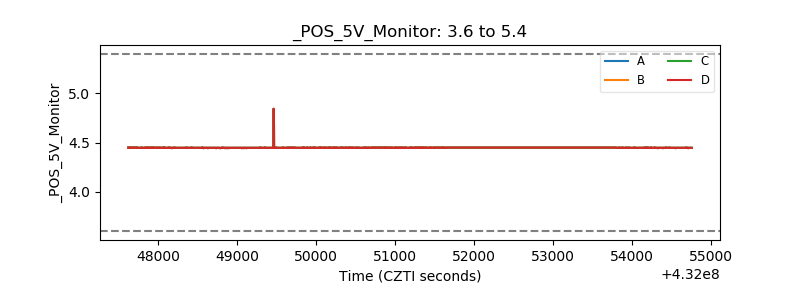 |
| _ROLL_ROT | 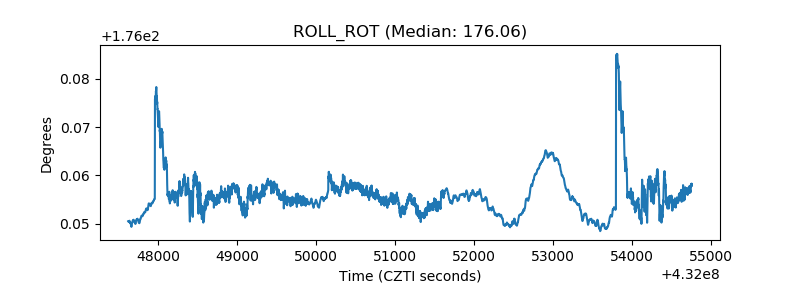 |
| _Roll_DEC | 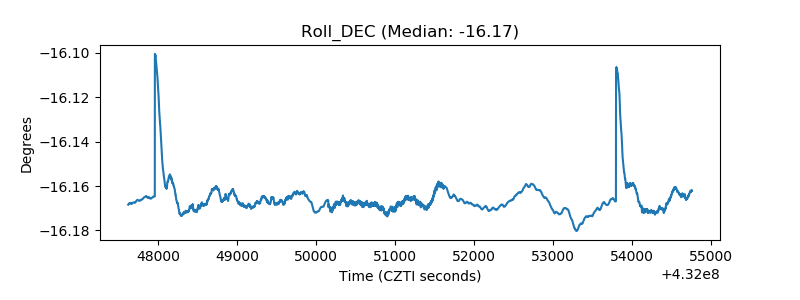 |
| _Roll_RA | 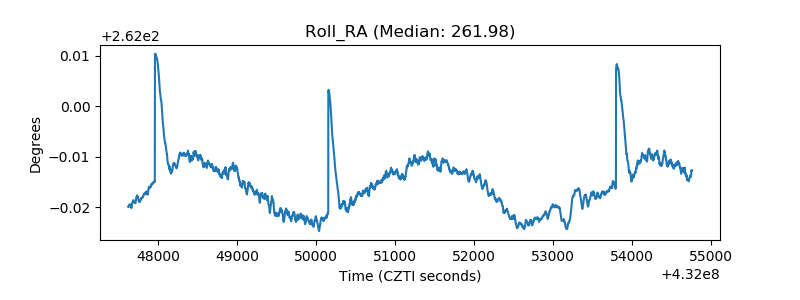 |
| Veto Counter | 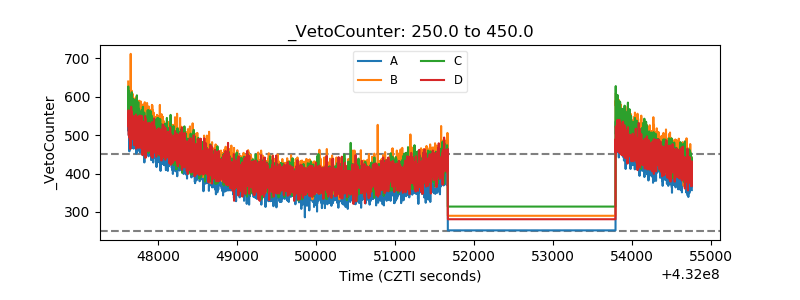 |