| Param | Original file | Final file |
|---|---|---|
| Filename | modeM0/AS1T05_148T01_9000005838_42997cztM0_level2.fits | modeM0/AS1T05_148T01_9000005838_42997cztM0_level2_quad_clean.evt |
| Size (bytes) | 428,572,800 | 99,601,920 |
| Size | 408.7 MB | 95.0 MB |
| Events in quadrant A | 3,243,963 | 761,297 |
| Events in quadrant B | 4,715,575 | 598,561 |
| Events in quadrant C | 2,559,860 | 733,976 |
| Events in quadrant D | 4,959,121 | 574,148 |
| Mode M9 | |||
|---|---|---|---|
| Quadrant | BADHDUFLAG | Total packets | Discarded packets |
| A | 0 | 23 | 0 |
| B | 0 | 24 | 0 |
| C | 0 | 24 | 0 |
| D | 0 | 24 | 0 |
| Mode SS | |||
|---|---|---|---|
| Quadrant | BADHDUFLAG | Total packets | Discarded packets |
| A | 0 | 104 | 0 |
| B | 0 | 104 | 0 |
| C | 0 | 104 | 0 |
| D | 0 | 104 | 0 |
| Mode M0 | |||
|---|---|---|---|
| Quadrant | BADHDUFLAG | Total packets | Discarded packets |
| A | 0 | 12767 | 2 |
| B | 0 | 17241 | 2 |
| C | 0 | 10437 | 2 |
| D | 0 | 18086 | 2 |
| Quadrant | Total seconds | Saturated seconds | Saturation percentage |
|---|---|---|---|
| A | 4959 | 79 | 1.593063% |
| B | 4959 | 1013 | 20.427506% |
| C | 4959 | 3 | 0.060496% |
| D | 4959 | 837 | 16.878403% |
Noise dominated data is calculated using 1-second bins in cleaned event files. If a bin has >2000 counts, and if more than 50% of those come from <1% of pixels, then it is considered to be noise-dominated and hence unusable.
| Quadrant | # 1 sec bins | Bins with >0 counts | Bins with >2000 counts | High rate bins dominated by noise | Noise dominated (total time) | Noise dominated (detector-on time) | Marked lightcurve |
|---|---|---|---|---|---|---|---|
| A | 7112 | 4960 | 60 | 60 | 0.84% | 1.21% | 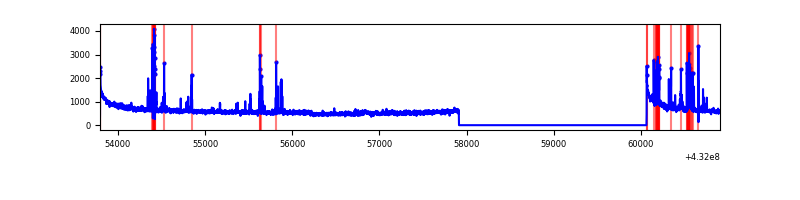 |
| B | 7112 | 4960 | 903 | 903 | 12.70% | 18.21% | 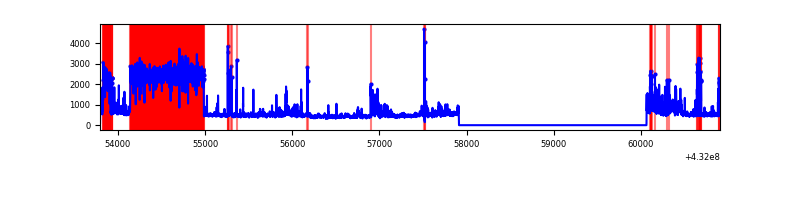 |
| C | 7112 | 4960 | 0 | 0 | 0.00% | 0.00% | 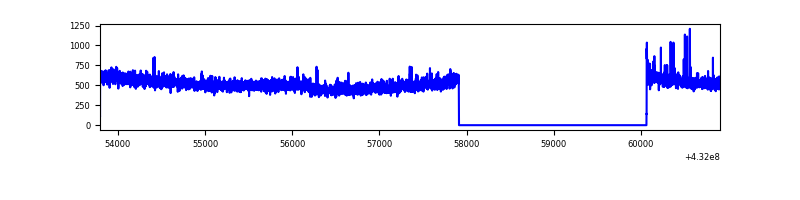 |
| D | 7112 | 4960 | 782 | 782 | 11.00% | 15.77% | 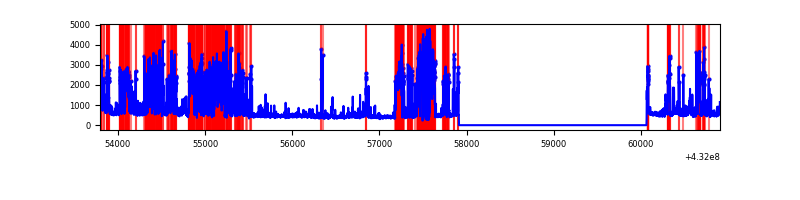 |
Top three noisy pixels from each quadrant. If the there are fewer than three noisy pixels in the level2.evt file, extra rows are filled as -1
| Pixel properties | Quadrant properties | ||||||
|---|---|---|---|---|---|---|---|
| Quadrant | DetID | PixID | Counts | Sigma | Mean | Median | Sigma |
| A | 10 | 83 | 586589 | 4282.83 | 616 | 607 | 136.8 |
| A | 15 | 237 | 243013 | 1771.7 | 616 | 607 | 136.8 |
| A | 7 | 3 | 18173 | 128.39 | 616 | 607 | 136.8 |
| B | 4 | 81 | 2265912 | 20663.79 | 525 | 514 | 109.6 |
| B | 4 | 171 | 240540 | 2189.39 | 525 | 514 | 109.6 |
| B | 5 | 255 | 72820 | 659.54 | 525 | 514 | 109.6 |
| C | 15 | 214 | 203231 | 1345.99 | 598 | 604 | 150.5 |
| C | 7 | 220 | 11974 | 75.53 | 598 | 604 | 150.5 |
| C | 14 | 254 | 5560 | 32.92 | 598 | 604 | 150.5 |
| D | 1 | 47 | 1202867 | 8254.59 | 545 | 527 | 145.7 |
| D | 13 | 249 | 867354 | 5951.15 | 545 | 527 | 145.7 |
| D | 1 | 52 | 307540 | 2107.78 | 545 | 527 | 145.7 |
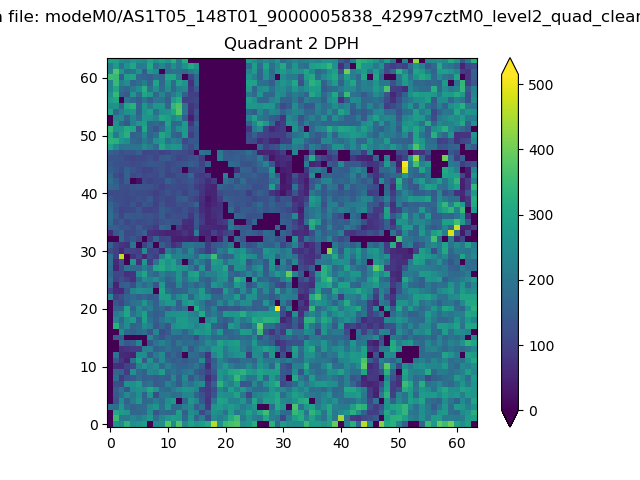
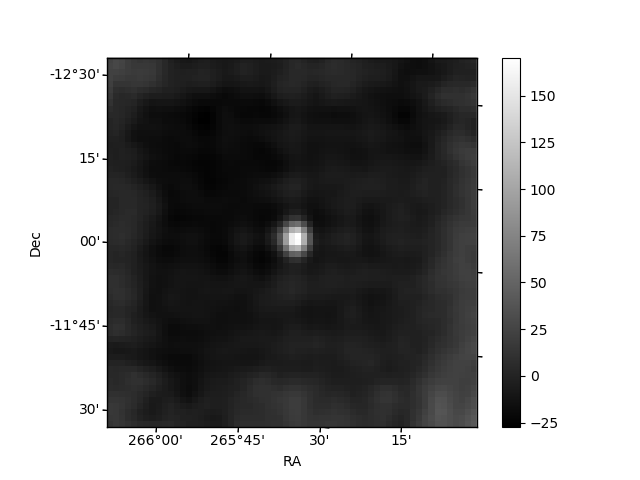
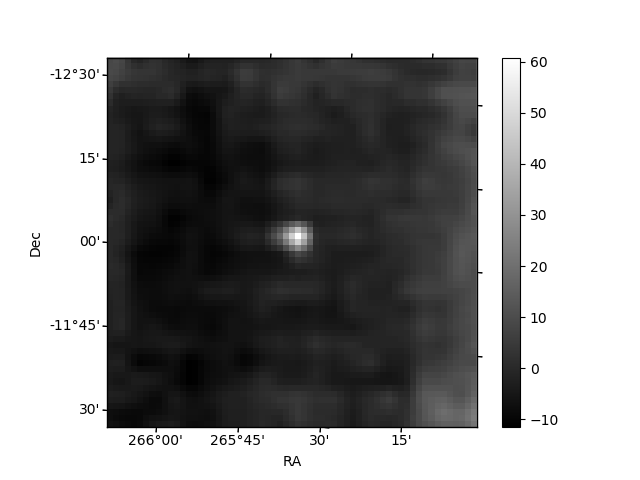
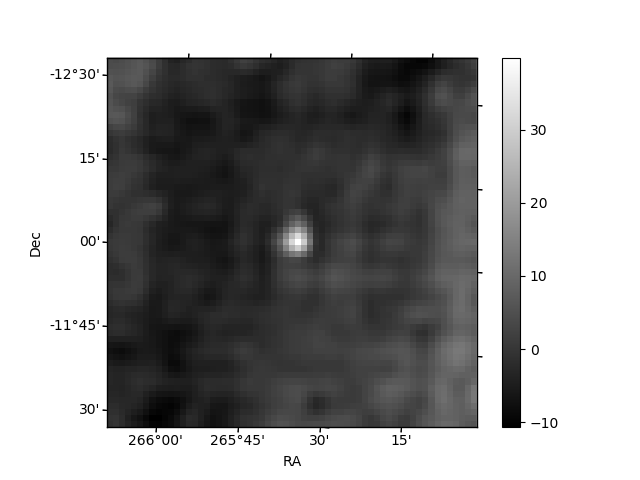
Histogram calculated using DETX and DETY for each event in the final _common_clean file
| Quadrant A | 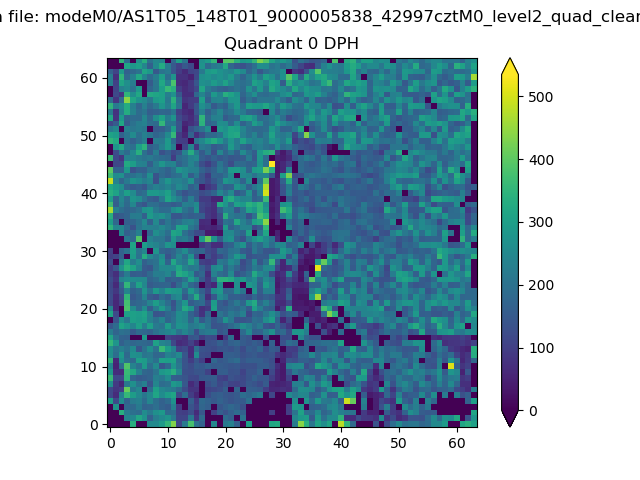 |
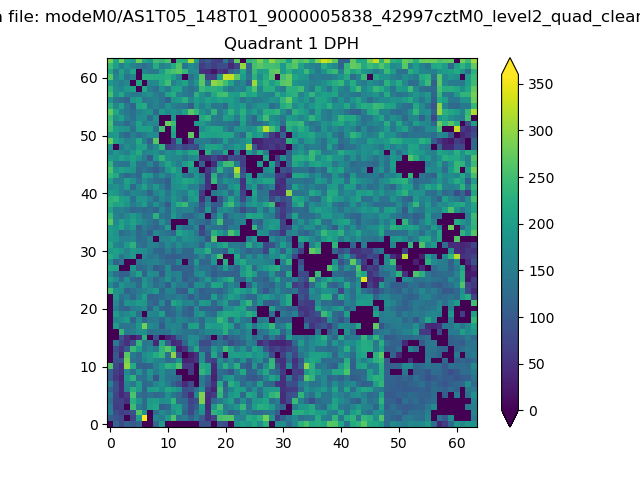 |
Quadrant B |
|---|---|---|---|
| Quadrant D | 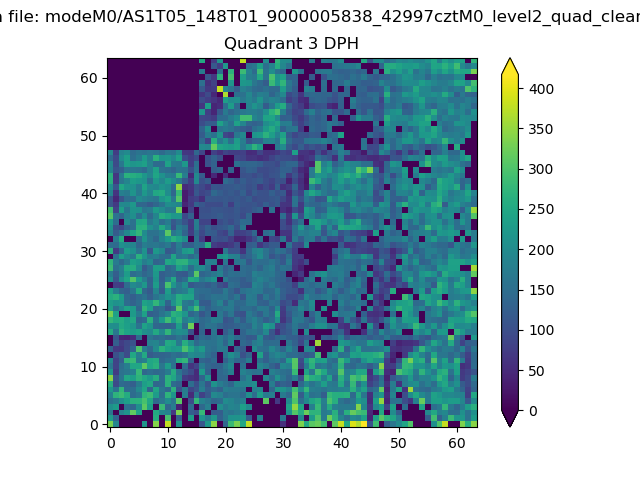 |
 |
Quadrant C |
| Plot type | Count rate plots | Images |
|---|---|---|
| Comparison with Poisson distribution Blue bars denote a histogram of data divided into 1 sec bins. Red curve is a Poisson curve with rate = median count rate of data. |
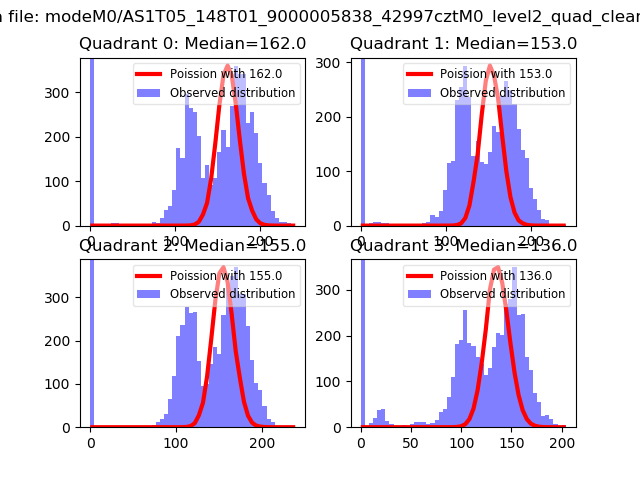 |
 |
| Quadrant-wise count rates Data is divided into 100 sec bins |
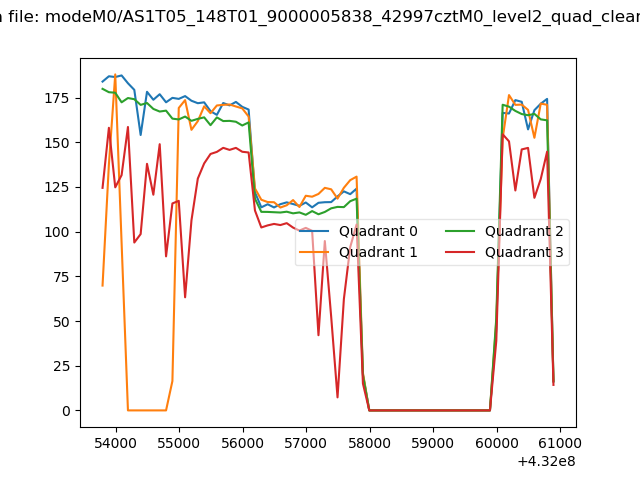 |
|
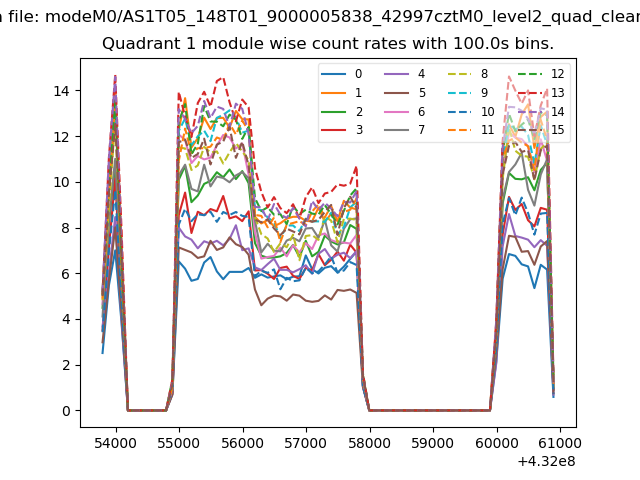
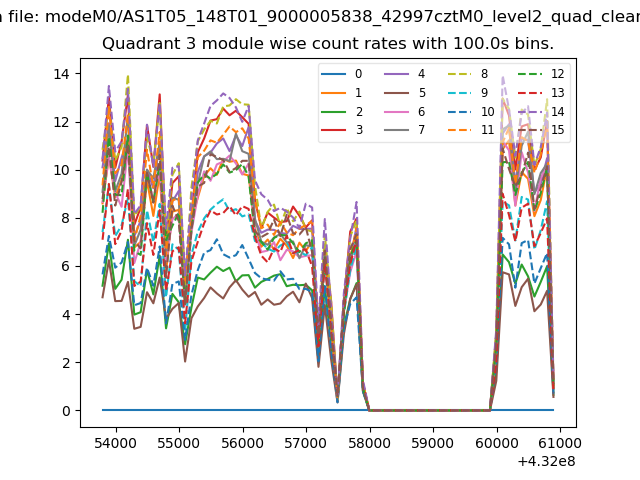
| Module-wise count rates for Quadrant A Data is divided into 100 sec bins |
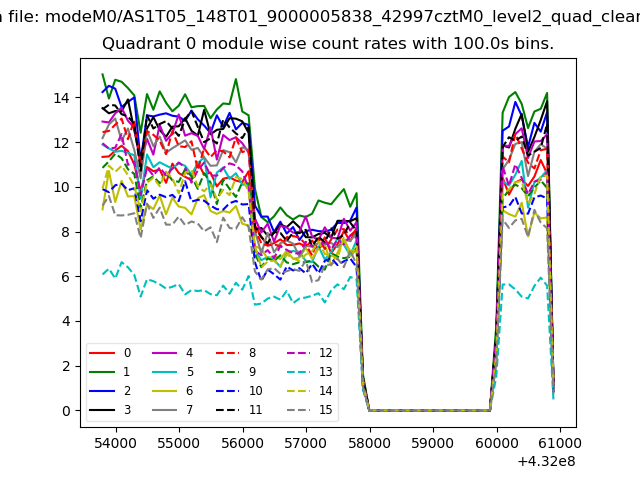 |
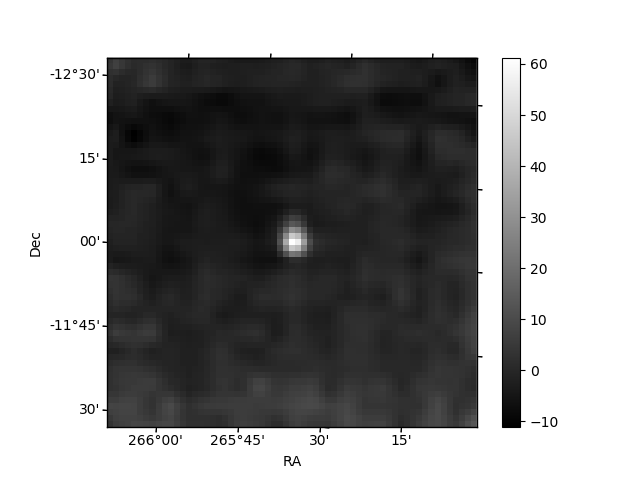 |
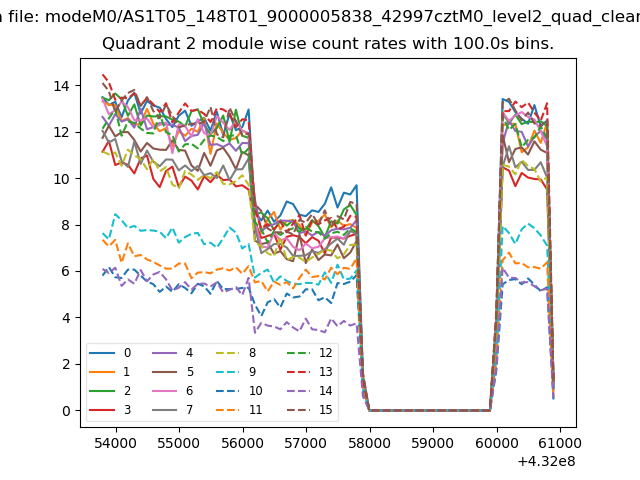
| Module-wise count rates for Quadrant B Data is divided into 100 sec bins |
 |
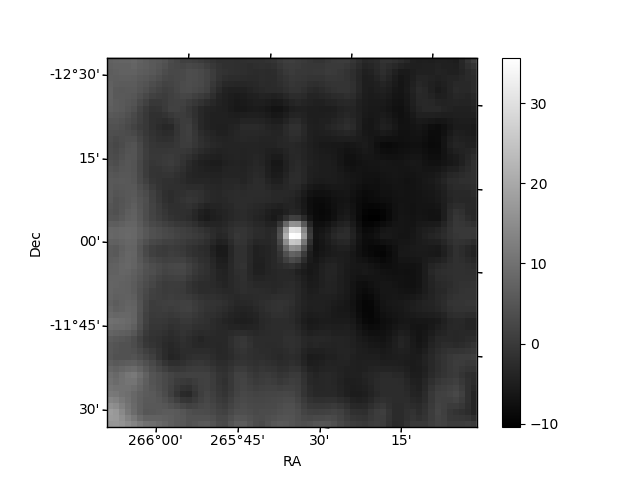 |
| Module-wise count rates for Quadrant C Data is divided into 100 sec bins |
 |
 |
| Module-wise count rates for Quadrant D Data is divided into 100 sec bins |
 |
 |
| Parameter | Plot |
|---|---|
| CZT HV Monitor | 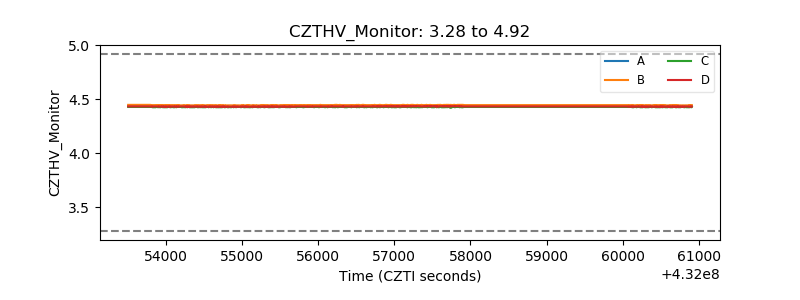 |
| D_VDD | 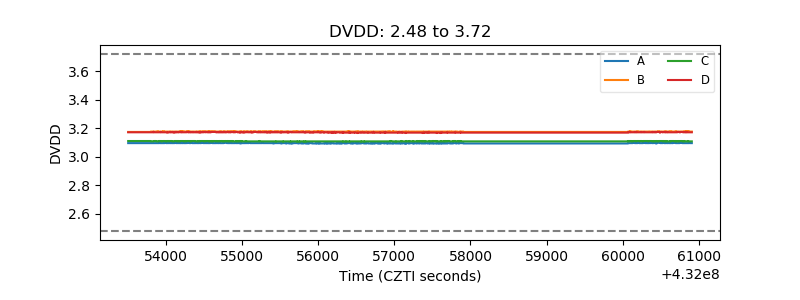 |
| Temperature 1 | 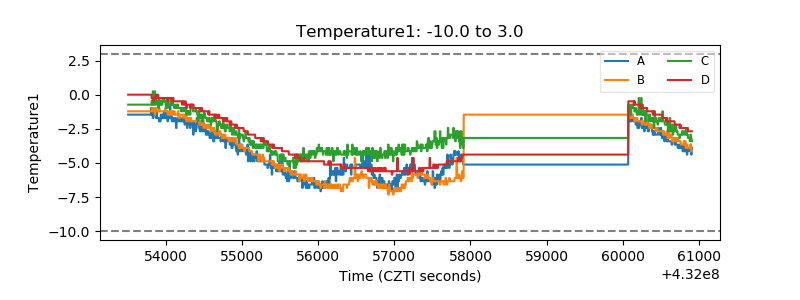 |
| Veto HV Monitor | 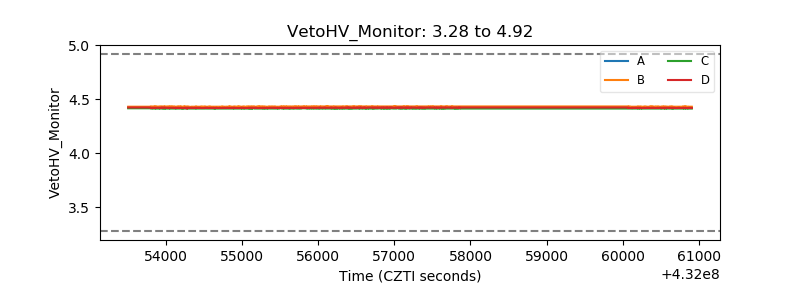 |
| Veto LLD | 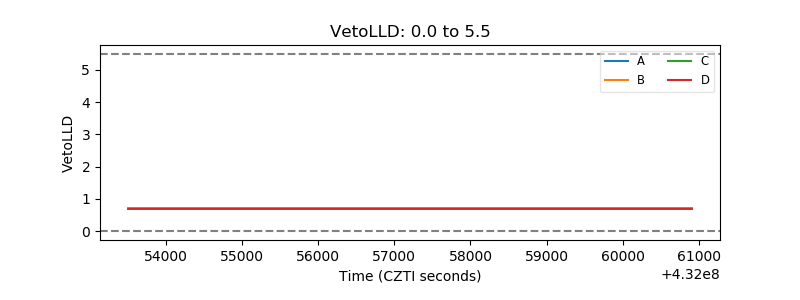 |
| Alpha Counter | 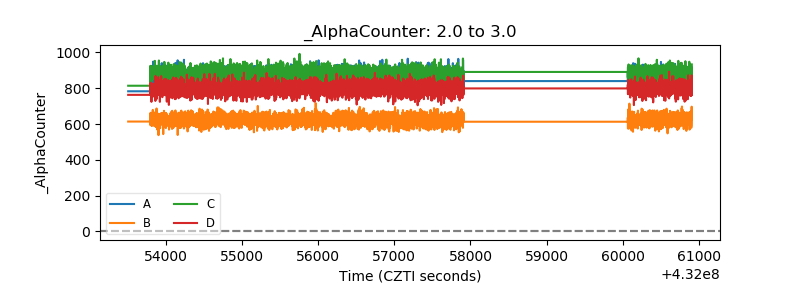 |
| _CPM_Rate | 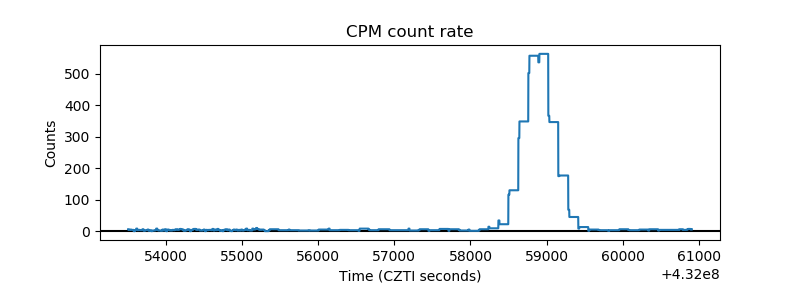 |
| CZT Counter | 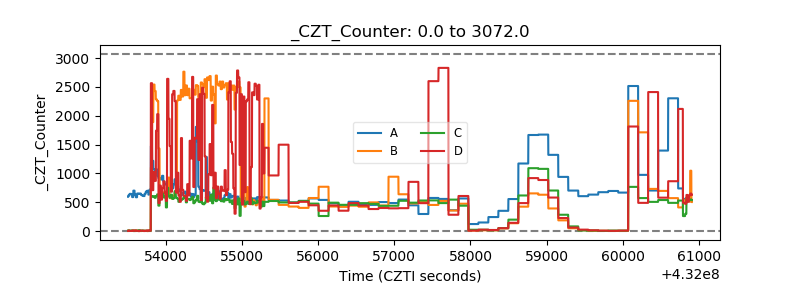 |
| +2.5 Volts monitor |  |
| +5 Volts monitor |  |
| _ROLL_ROT | 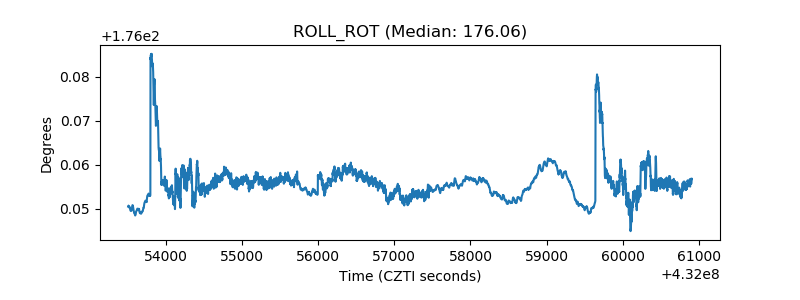 |
| _Roll_DEC | 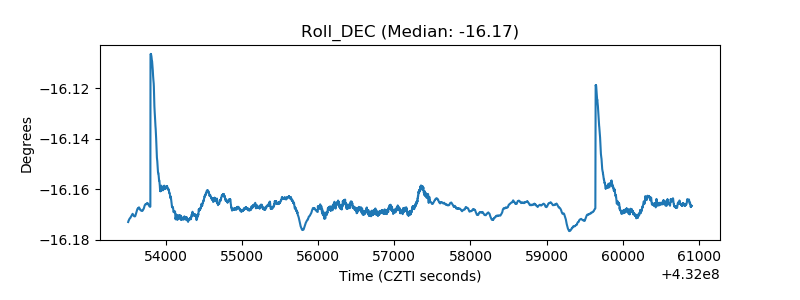 |
| _Roll_RA | 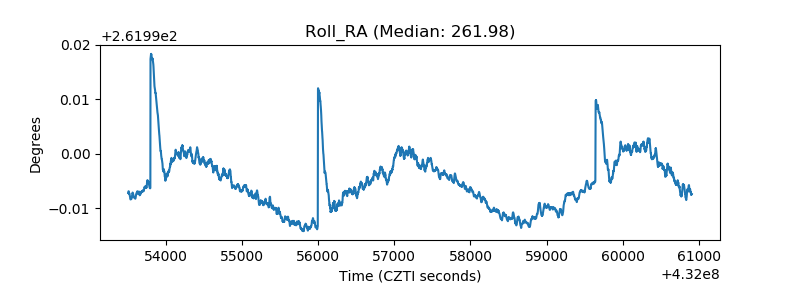 |
| Veto Counter | 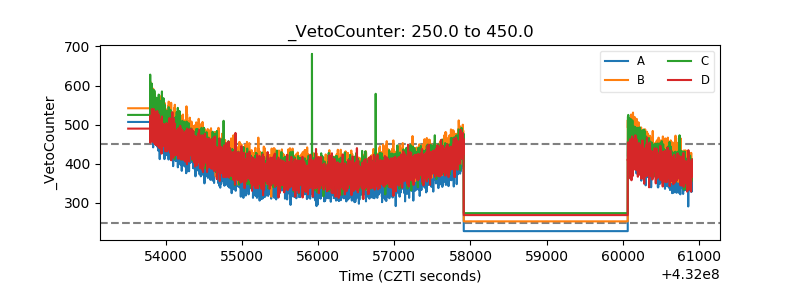 |