| Param | Original file | Final file |
|---|---|---|
| Filename | modeM0/AS1T05_148T01_9000005838_42998cztM0_level2.fits | modeM0/AS1T05_148T01_9000005838_42998cztM0_level2_quad_clean.evt |
| Size (bytes) | 336,291,840 | 99,264,960 |
| Size | 320.7 MB | 94.7 MB |
| Events in quadrant A | 3,074,551 | 703,067 |
| Events in quadrant B | 2,825,501 | 704,797 |
| Events in quadrant C | 2,479,288 | 677,769 |
| Events in quadrant D | 3,686,877 | 576,302 |
| Mode M9 | |||
|---|---|---|---|
| Quadrant | BADHDUFLAG | Total packets | Discarded packets |
| A | 0 | 30 | 0 |
| B | 0 | 31 | 0 |
| C | 0 | 31 | 0 |
| D | 0 | 31 | 0 |
| Mode SS | |||
|---|---|---|---|
| Quadrant | BADHDUFLAG | Total packets | Discarded packets |
| A | 0 | 139917405911080 | 139917149601838 |
| B | 0 | -1 | -1 |
| C | 0 | -1 | -1 |
| D | 0 | -1 | -1 |
| Mode M0 | |||
|---|---|---|---|
| Quadrant | BADHDUFLAG | Total packets | Discarded packets |
| A | 0 | 12160 | 2 |
| B | 0 | 11531 | 2 |
| C | 0 | 10225 | 2 |
| D | 0 | 14297 | 2 |
| Quadrant | Total seconds | Saturated seconds | Saturation percentage |
|---|---|---|---|
| A | 4908 | 77 | 1.568867% |
| B | 4907 | 80 | 1.630324% |
| C | 4907 | 4 | 0.081516% |
| D | 4907 | 330 | 6.725087% |
Noise dominated data is calculated using 1-second bins in cleaned event files. If a bin has >2000 counts, and if more than 50% of those come from <1% of pixels, then it is considered to be noise-dominated and hence unusable.
| Quadrant | # 1 sec bins | Bins with >0 counts | Bins with >2000 counts | High rate bins dominated by noise | Noise dominated (total time) | Noise dominated (detector-on time) | Marked lightcurve |
|---|---|---|---|---|---|---|---|
| A | 6942 | 4909 | 57 | 57 | 0.82% | 1.16% | 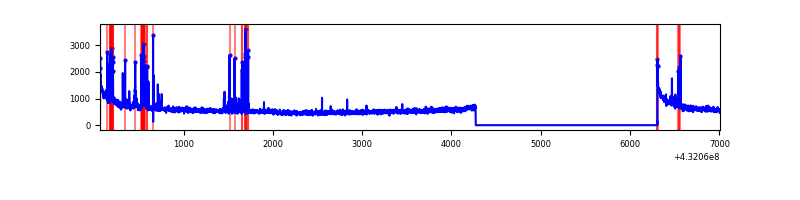 |
| B | 6941 | 4907 | 43 | 43 | 0.62% | 0.88% | 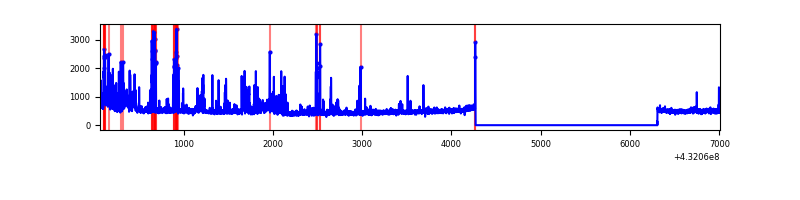 |
| C | 6941 | 4907 | 0 | 0 | 0.00% | 0.00% | 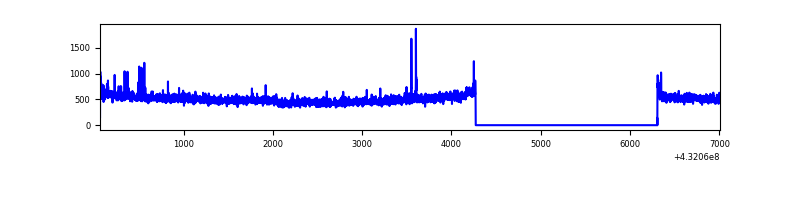 |
| D | 6941 | 4907 | 329 | 329 | 4.74% | 6.70% | 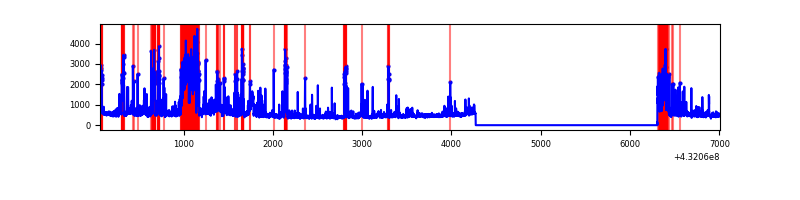 |
Top three noisy pixels from each quadrant. If the there are fewer than three noisy pixels in the level2.evt file, extra rows are filled as -1
| Pixel properties | Quadrant properties | ||||||
|---|---|---|---|---|---|---|---|
| Quadrant | DetID | PixID | Counts | Sigma | Mean | Median | Sigma |
| A | 10 | 83 | 568649 | 4359.57 | 587 | 578 | 130.3 |
| A | 15 | 237 | 204781 | 1567.12 | 587 | 578 | 130.3 |
| A | 7 | 3 | 27992 | 210.38 | 587 | 578 | 130.3 |
| B | 4 | 81 | 189186 | 1550.78 | 586 | 573 | 121.6 |
| B | 4 | 171 | 167297 | 1370.81 | 586 | 573 | 121.6 |
| B | 5 | 255 | 106535 | 871.22 | 586 | 573 | 121.6 |
| C | 15 | 214 | 199119 | 1382.01 | 572 | 578 | 143.7 |
| C | 14 | 254 | 11396 | 75.3 | 572 | 578 | 143.7 |
| C | 15 | 208 | 10694 | 70.42 | 572 | 578 | 143.7 |
| D | 13 | 249 | 548192 | 3823.71 | 550 | 532 | 143.2 |
| D | 10 | 118 | 364249 | 2539.44 | 550 | 532 | 143.2 |
| D | 1 | 47 | 168062 | 1169.68 | 550 | 532 | 143.2 |
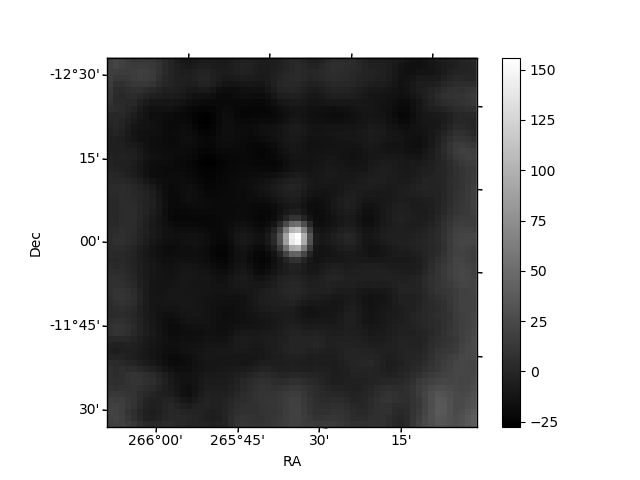
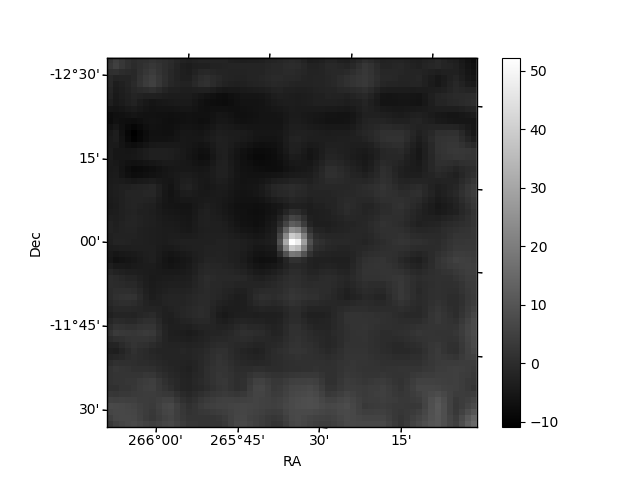
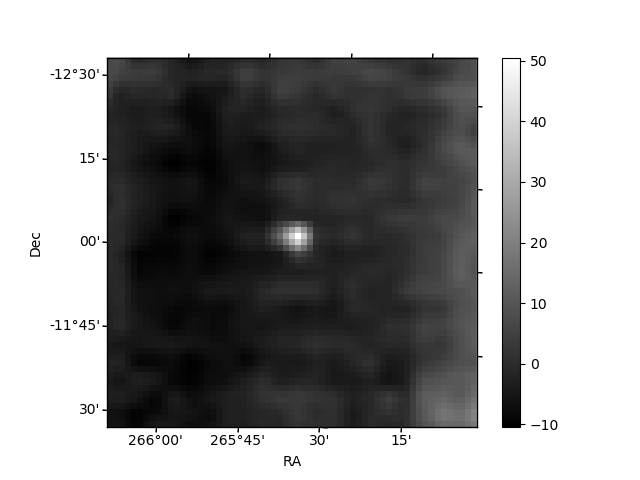
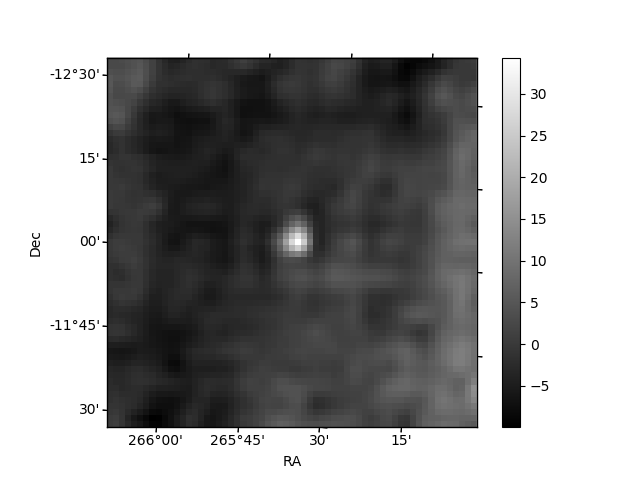
Histogram calculated using DETX and DETY for each event in the final _common_clean file
| Quadrant A | 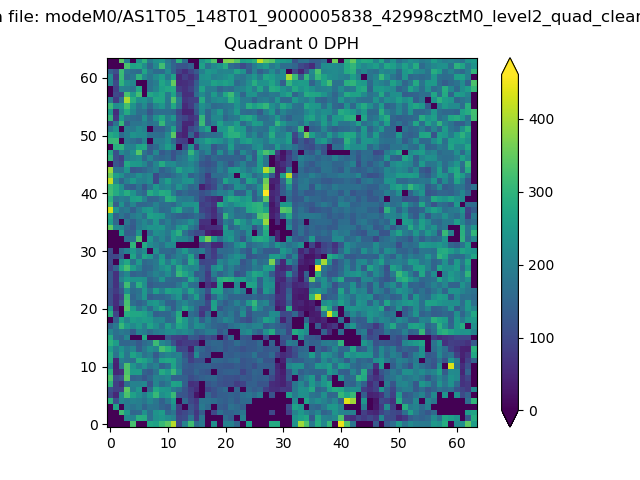 |
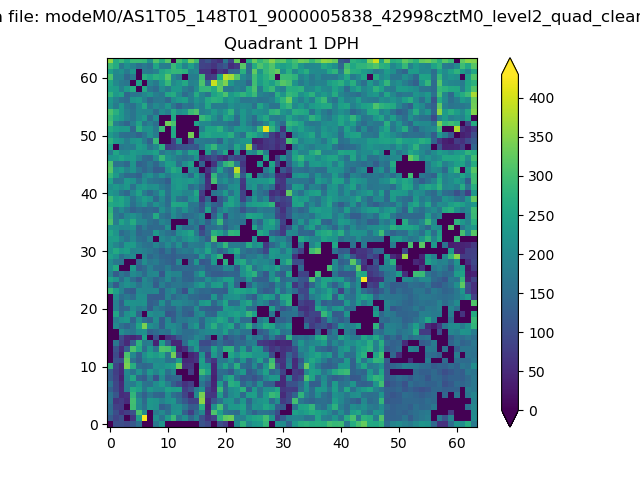 |
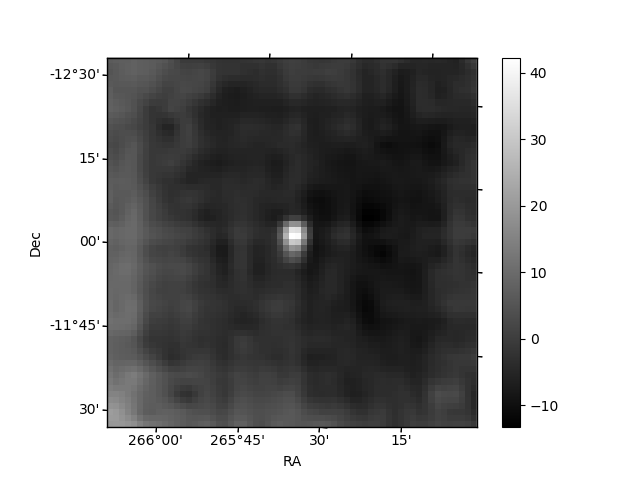
Quadrant B |
|---|---|---|---|
| Quadrant D | 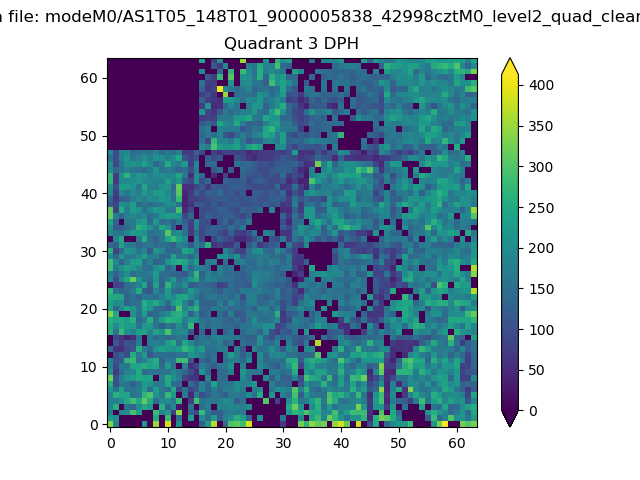 |
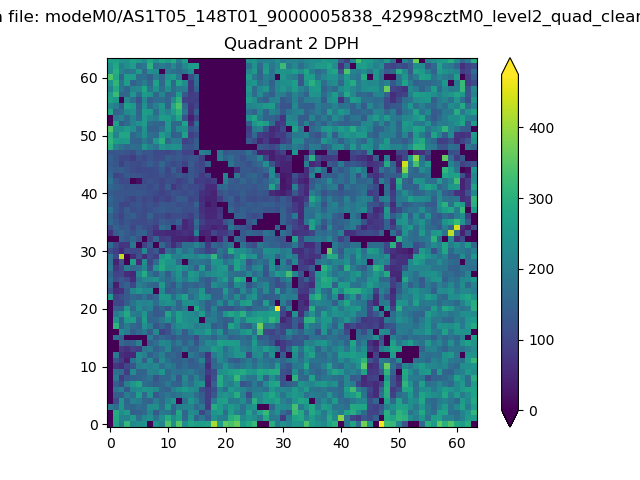 |
Quadrant C |
| Plot type | Count rate plots | Images |
|---|---|---|
| Comparison with Poisson distribution Blue bars denote a histogram of data divided into 1 sec bins. Red curve is a Poisson curve with rate = median count rate of data. |
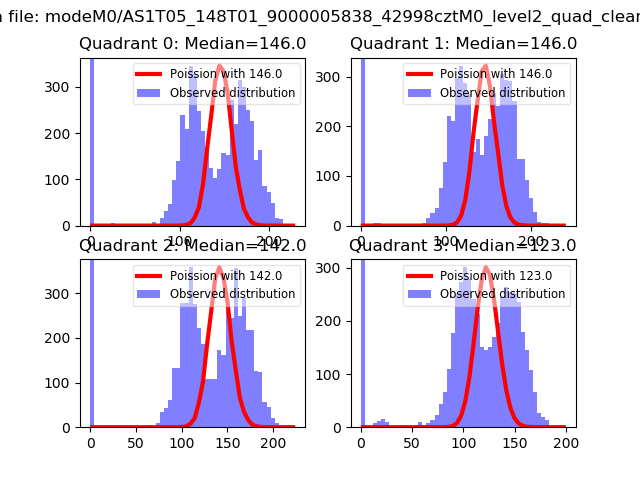 |
 |
| Quadrant-wise count rates Data is divided into 100 sec bins |
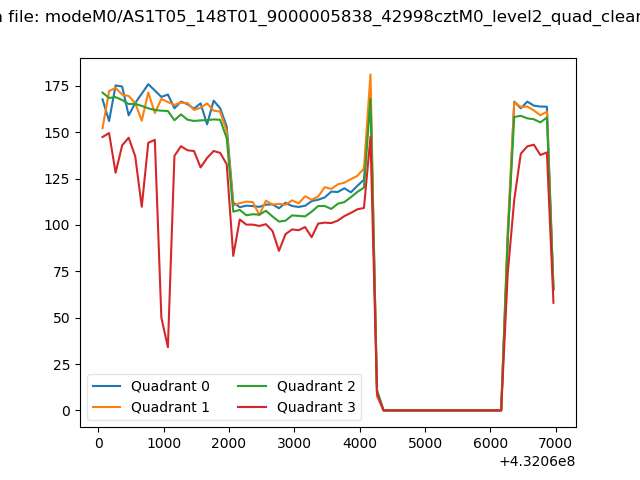 |
|
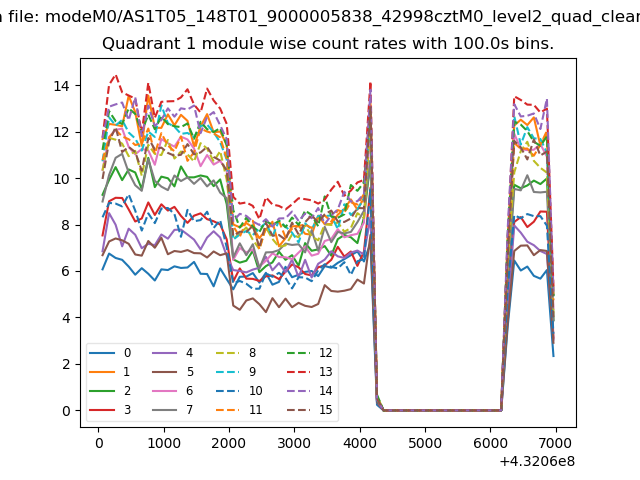
| Module-wise count rates for Quadrant A Data is divided into 100 sec bins |
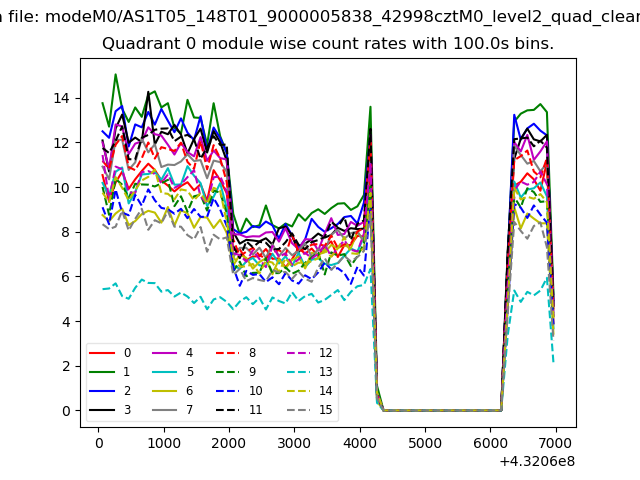 |
 |
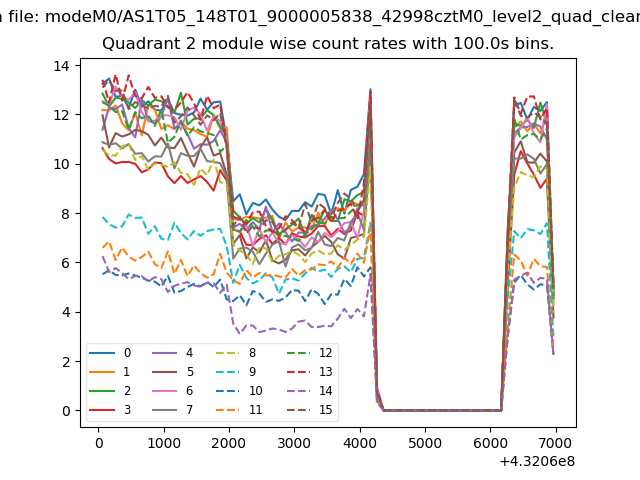
| Module-wise count rates for Quadrant B Data is divided into 100 sec bins |
 |
 |
| Module-wise count rates for Quadrant C Data is divided into 100 sec bins |
 |
 |
| Module-wise count rates for Quadrant D Data is divided into 100 sec bins |
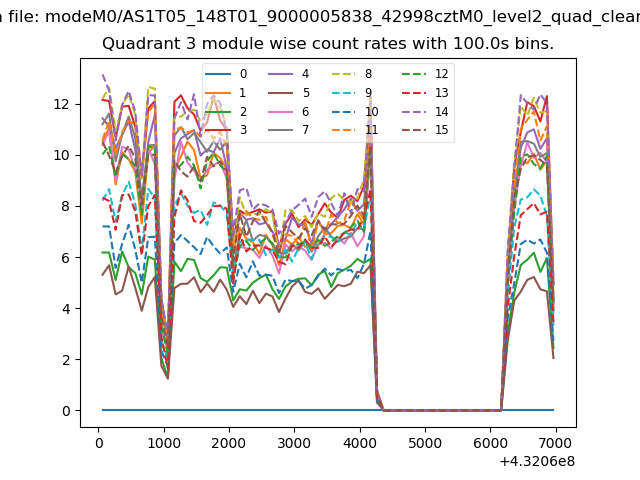 |
 |
| Parameter | Plot |
|---|---|
| CZT HV Monitor | 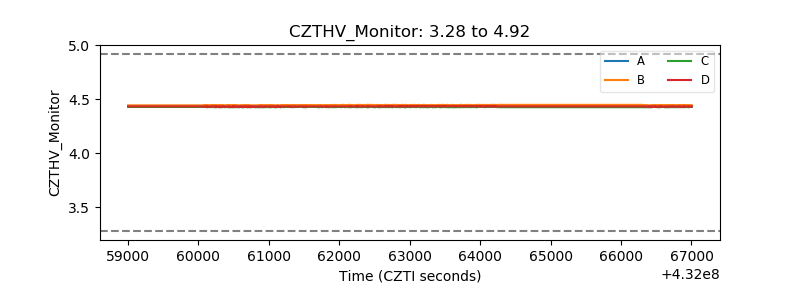 |
| D_VDD | 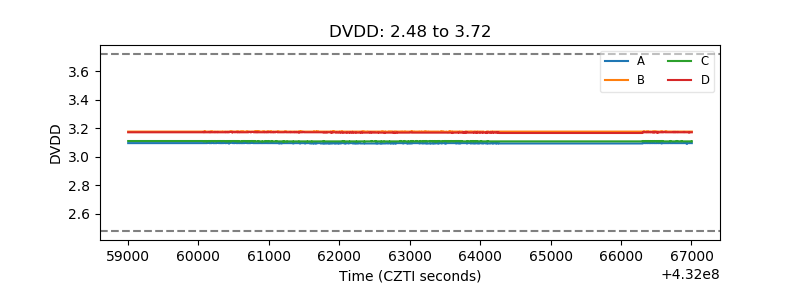 |
| Temperature 1 | 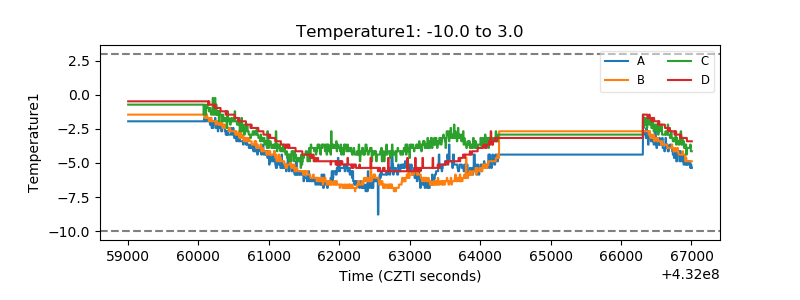 |
| Veto HV Monitor | 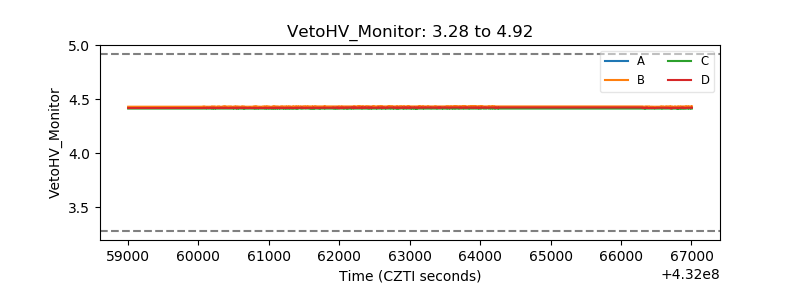 |
| Veto LLD | 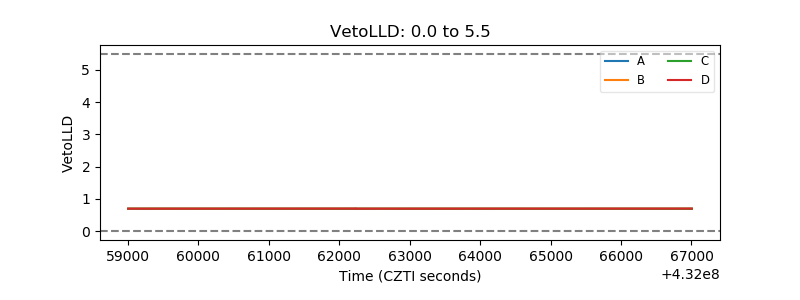 |
| Alpha Counter | 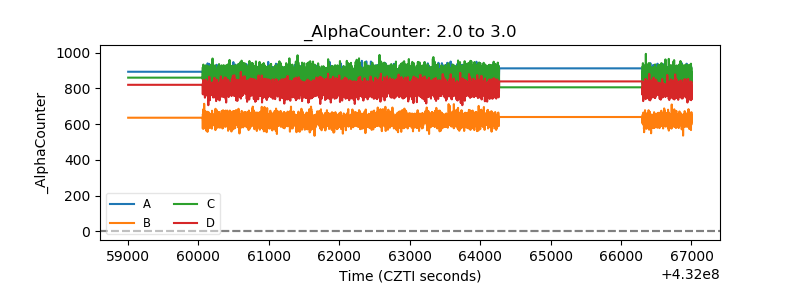 |
| _CPM_Rate | 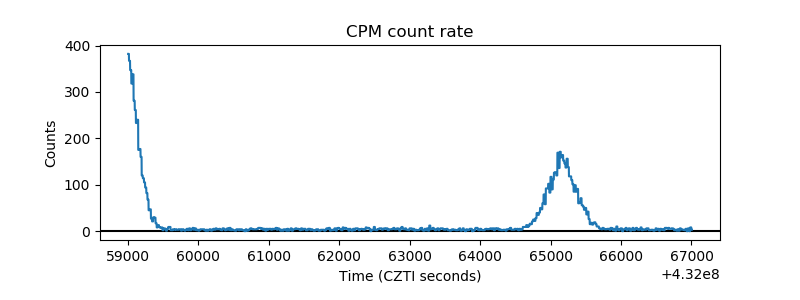 |
| CZT Counter | 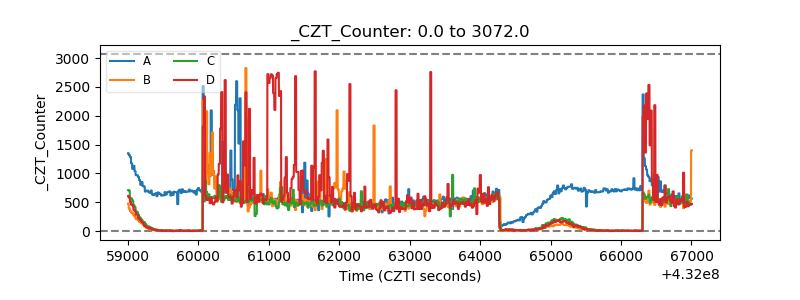 |
| +2.5 Volts monitor | 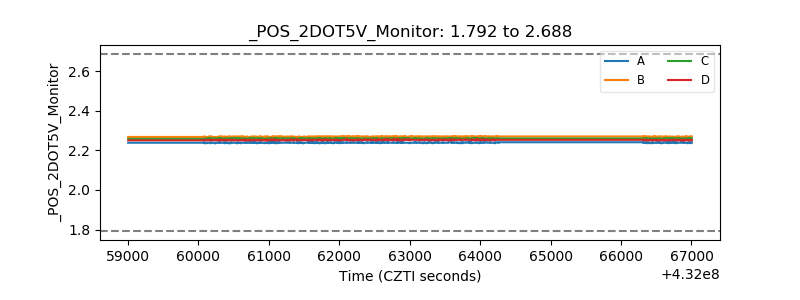 |
| +5 Volts monitor | 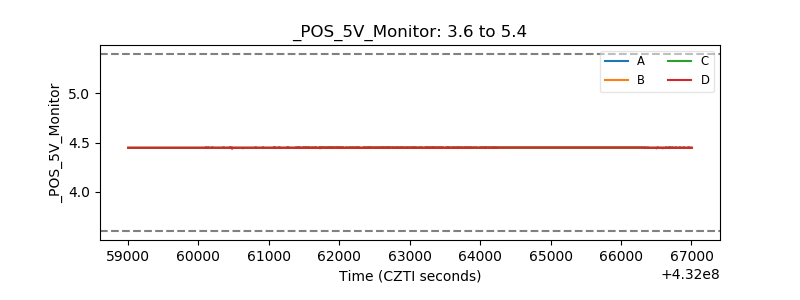 |
| _ROLL_ROT |  |
| _Roll_DEC | 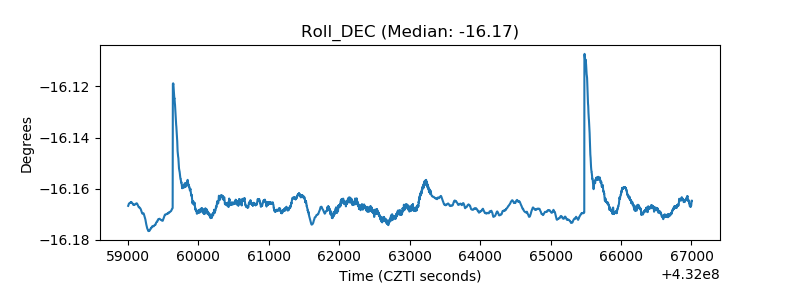 |
| _Roll_RA | 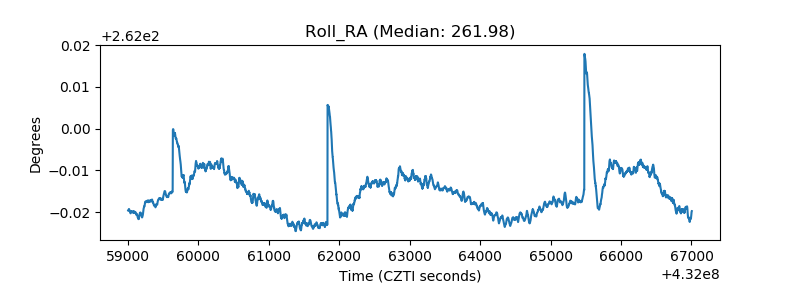 |
| Veto Counter | 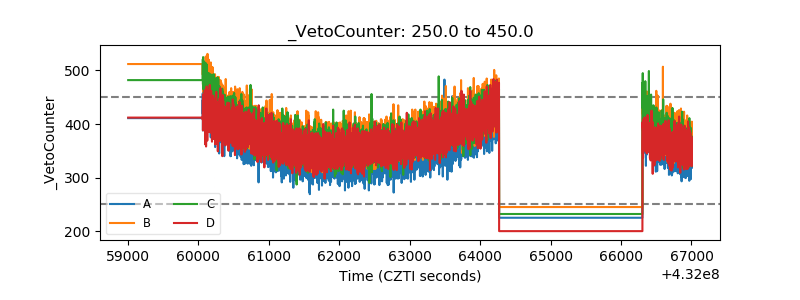 |