| Param | Original file | Final file |
|---|---|---|
| Filename | modeM0/AS1T05_148T01_9000005838_42999cztM0_level2.fits | modeM0/AS1T05_148T01_9000005838_42999cztM0_level2_quad_clean.evt |
| Size (bytes) | 331,968,960 | 106,689,600 |
| Size | 316.6 MB | 101.7 MB |
| Events in quadrant A | 3,230,518 | 743,836 |
| Events in quadrant B | 2,755,961 | 753,255 |
| Events in quadrant C | 2,698,769 | 719,555 |
| Events in quadrant D | 3,188,433 | 641,007 |
| Mode M9 | |||
|---|---|---|---|
| Quadrant | BADHDUFLAG | Total packets | Discarded packets |
| A | 0 | 33 | 0 |
| B | 0 | 34 | 0 |
| C | 0 | 34 | 0 |
| D | 0 | 34 | 0 |
| Mode SS | |||
|---|---|---|---|
| Quadrant | BADHDUFLAG | Total packets | Discarded packets |
| A | 0 | 110 | 0 |
| B | 0 | 110 | 0 |
| C | 0 | 110 | 0 |
| D | 0 | 110 | 0 |
| Mode M0 | |||
|---|---|---|---|
| Quadrant | BADHDUFLAG | Total packets | Discarded packets |
| A | 0 | 13140 | 2 |
| B | 0 | 11629 | 2 |
| C | 0 | 11312 | 2 |
| D | 0 | 13207 | 2 |
| Quadrant | Total seconds | Saturated seconds | Saturation percentage |
|---|---|---|---|
| A | 5325 | 71 | 1.333333% |
| B | 5325 | 36 | 0.676056% |
| C | 5325 | 15 | 0.281690% |
| D | 5325 | 118 | 2.215962% |
Noise dominated data is calculated using 1-second bins in cleaned event files. If a bin has >2000 counts, and if more than 50% of those come from <1% of pixels, then it is considered to be noise-dominated and hence unusable.
| Quadrant | # 1 sec bins | Bins with >0 counts | Bins with >2000 counts | High rate bins dominated by noise | Noise dominated (total time) | Noise dominated (detector-on time) | Marked lightcurve |
|---|---|---|---|---|---|---|---|
| A | 7118 | 5326 | 53 | 53 | 0.74% | 1.00% | 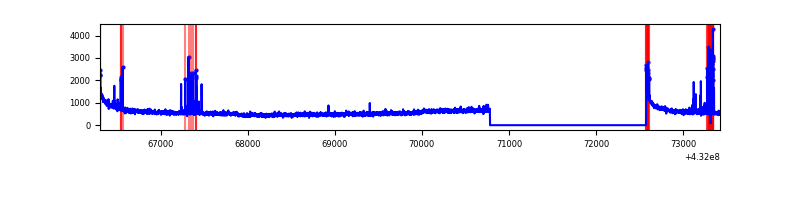 |
| B | 7118 | 5325 | 18 | 18 | 0.25% | 0.34% | 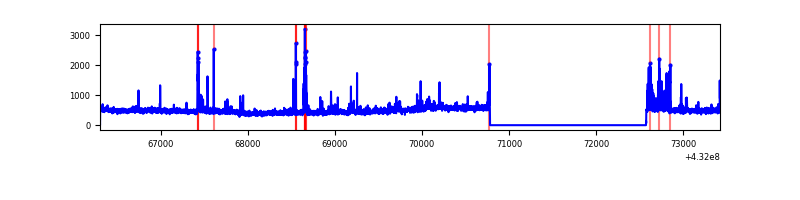 |
| C | 7118 | 5325 | 9 | 9 | 0.13% | 0.17% | 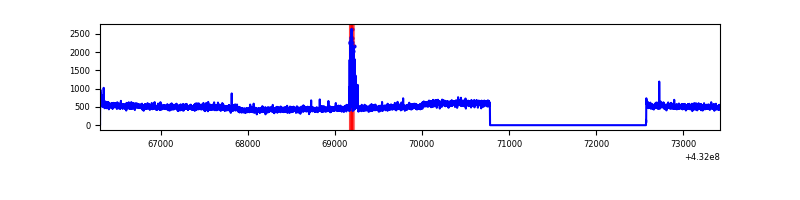 |
| D | 7118 | 5325 | 112 | 112 | 1.57% | 2.10% | 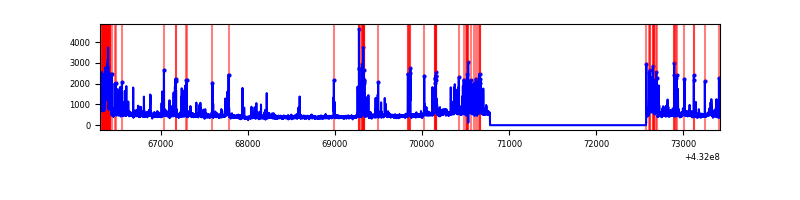 |
Top three noisy pixels from each quadrant. If the there are fewer than three noisy pixels in the level2.evt file, extra rows are filled as -1
| Pixel properties | Quadrant properties | ||||||
|---|---|---|---|---|---|---|---|
| Quadrant | DetID | PixID | Counts | Sigma | Mean | Median | Sigma |
| A | 10 | 83 | 580832 | 4139.13 | 633 | 622 | 140.2 |
| A | 15 | 237 | 152895 | 1086.29 | 633 | 622 | 140.2 |
| A | 7 | 3 | 39757 | 279.18 | 633 | 622 | 140.2 |
| B | 5 | 255 | 106928 | 807.92 | 633 | 620 | 131.6 |
| B | 4 | 171 | 100272 | 757.34 | 633 | 620 | 131.6 |
| B | 3 | 112 | 52519 | 394.42 | 633 | 620 | 131.6 |
| C | 15 | 214 | 217337 | 1391.97 | 617 | 623 | 155.7 |
| C | 5 | 250 | 62142 | 395.14 | 617 | 623 | 155.7 |
| C | 12 | 249 | 6368 | 36.9 | 617 | 623 | 155.7 |
| D | 1 | 47 | 374028 | 2323.95 | 605 | 587 | 160.7 |
| D | 10 | 118 | 152264 | 943.9 | 605 | 587 | 160.7 |
| D | 1 | 52 | 89105 | 550.85 | 605 | 587 | 160.7 |
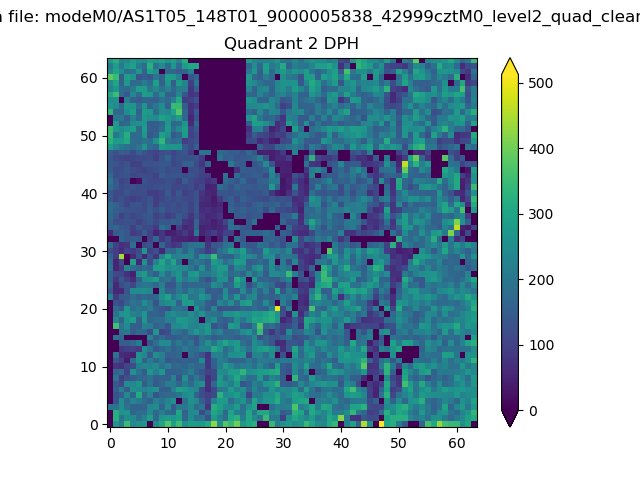
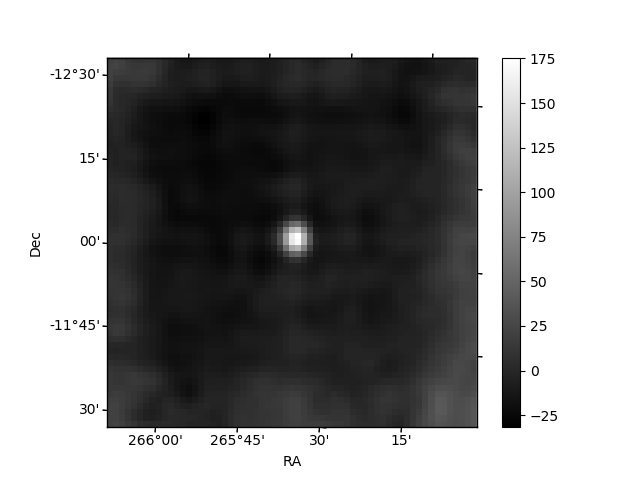
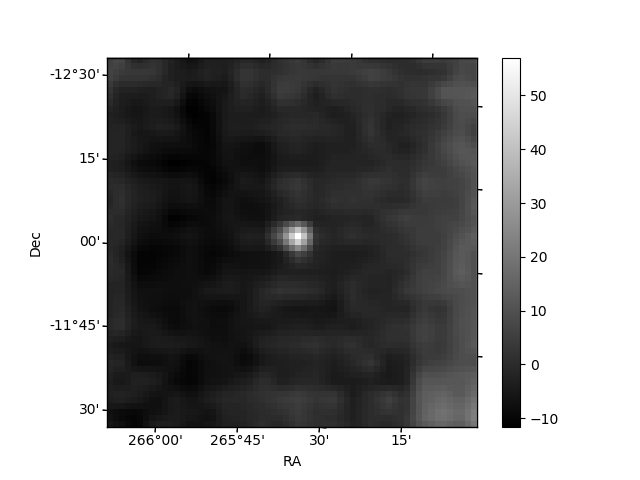
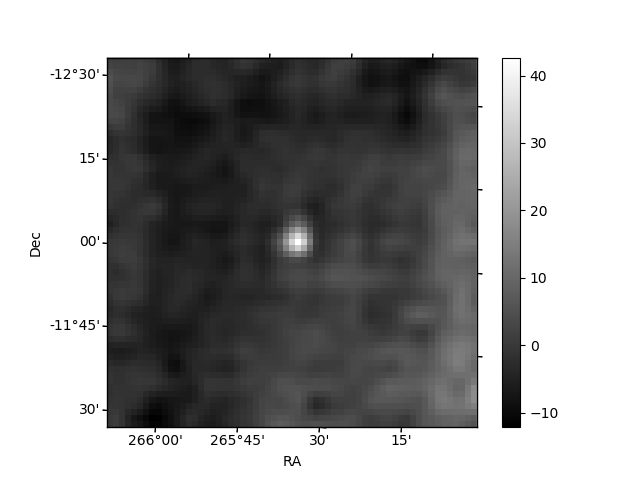
Histogram calculated using DETX and DETY for each event in the final _common_clean file
| Quadrant A | 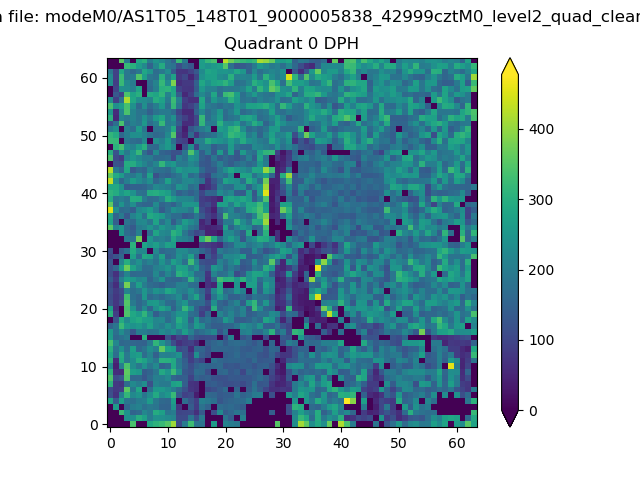 |
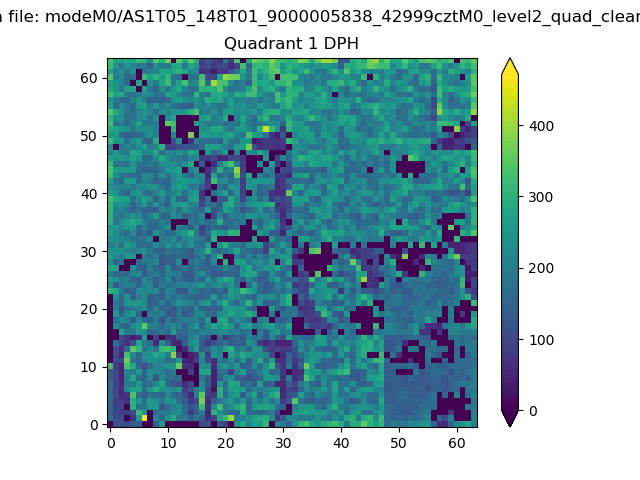 |
Quadrant B |
|---|---|---|---|
| Quadrant D | 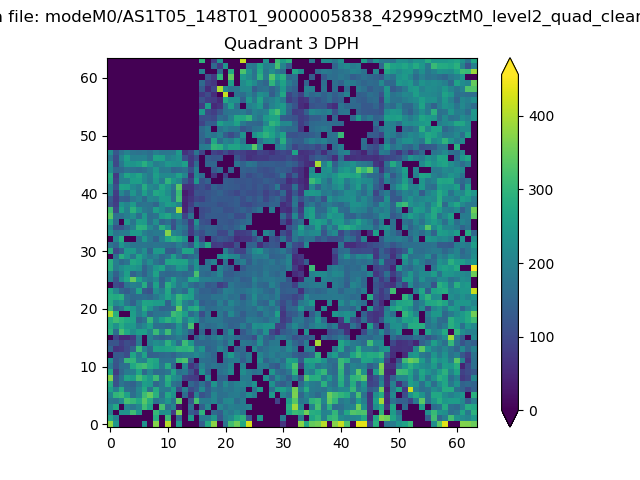 |
 |
Quadrant C |
| Plot type | Count rate plots | Images |
|---|---|---|
| Comparison with Poisson distribution Blue bars denote a histogram of data divided into 1 sec bins. Red curve is a Poisson curve with rate = median count rate of data. |
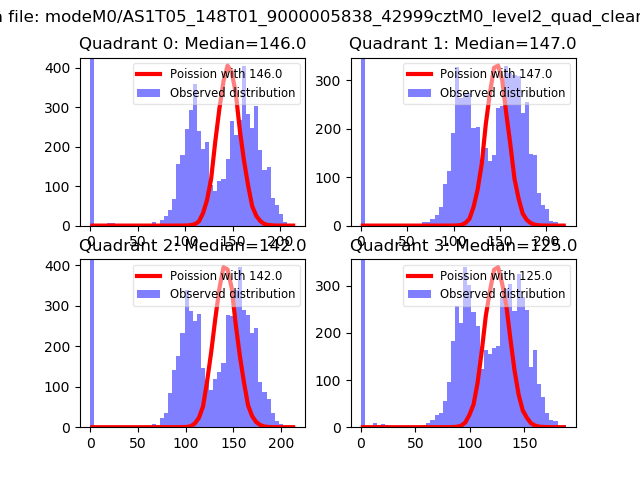 |
 |
| Quadrant-wise count rates Data is divided into 100 sec bins |
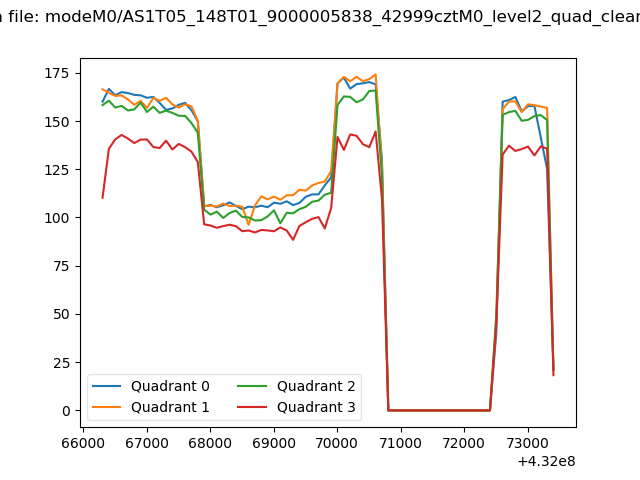 |
|
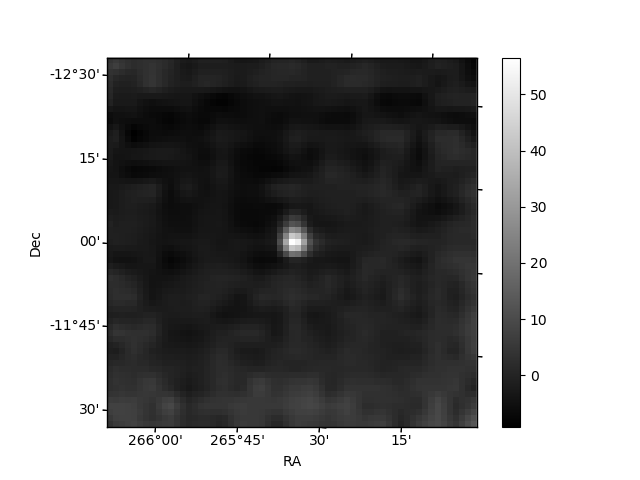
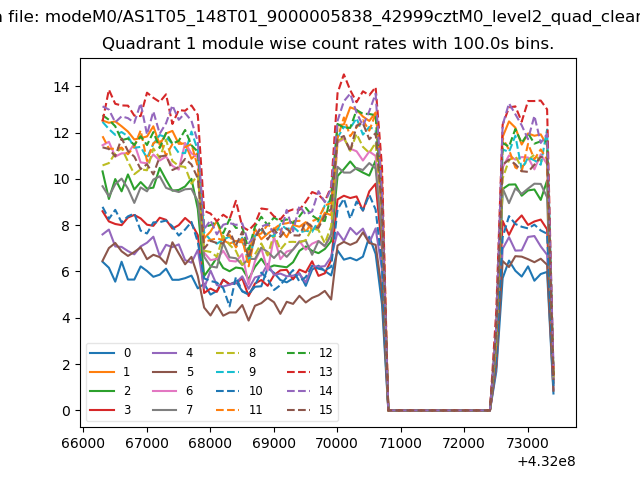
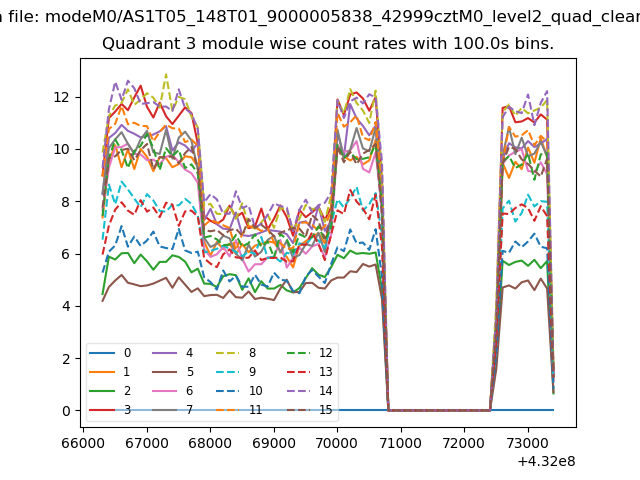
| Module-wise count rates for Quadrant A Data is divided into 100 sec bins |
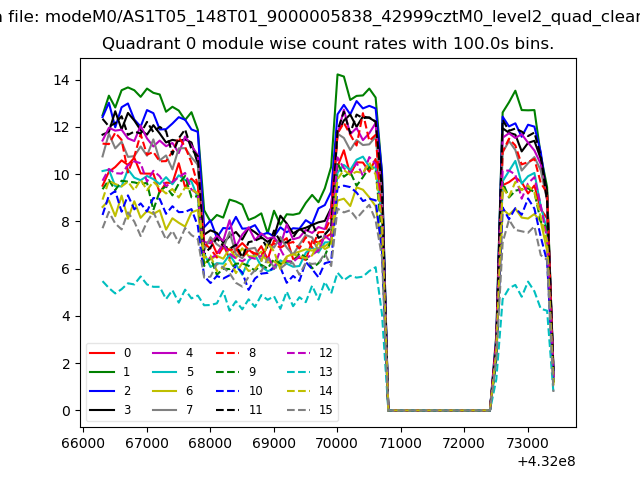 |
 |
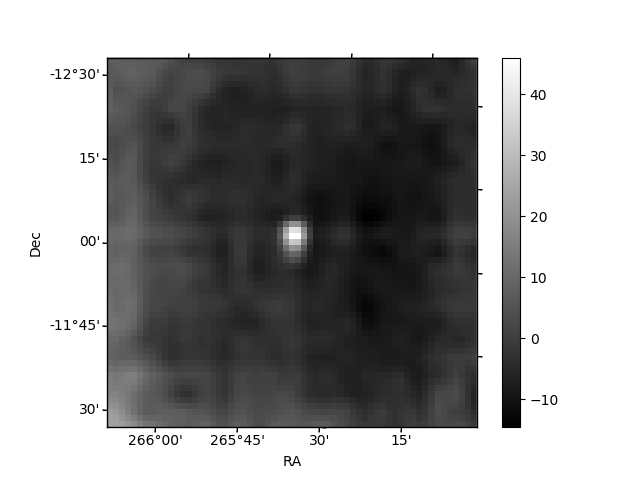
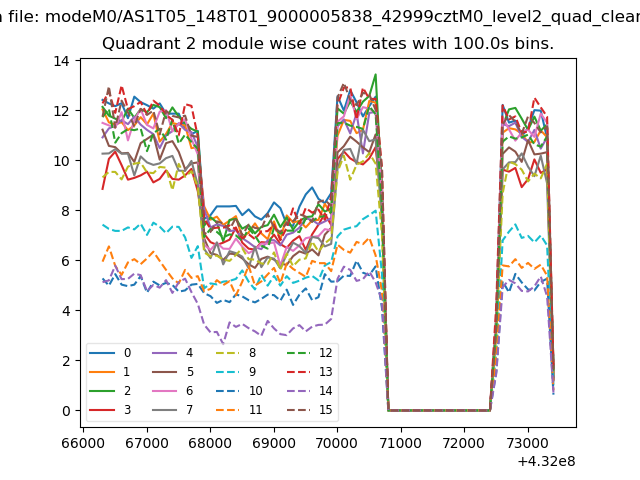
| Module-wise count rates for Quadrant B Data is divided into 100 sec bins |
 |
 |
| Module-wise count rates for Quadrant C Data is divided into 100 sec bins |
 |
 |
| Module-wise count rates for Quadrant D Data is divided into 100 sec bins |
 |
 |
| Parameter | Plot |
|---|---|
| CZT HV Monitor |  |
| D_VDD | 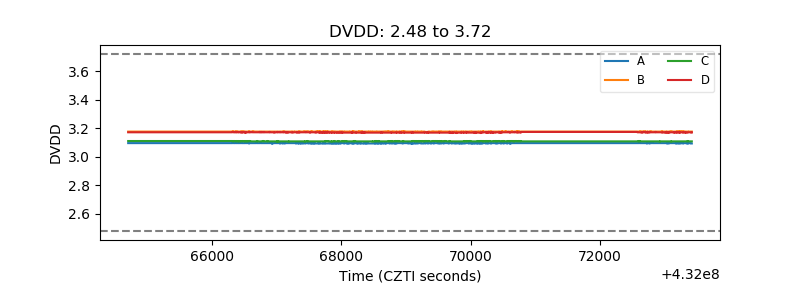 |
| Temperature 1 | 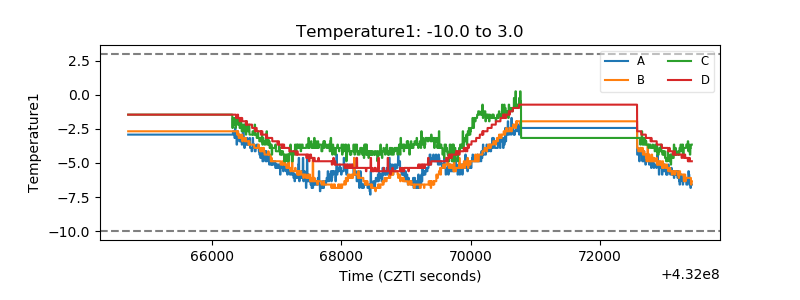 |
| Veto HV Monitor | 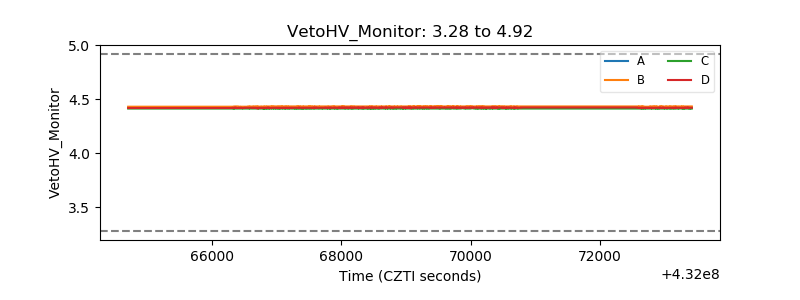 |
| Veto LLD | 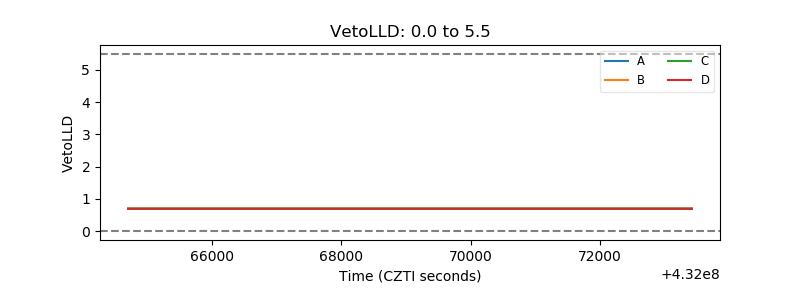 |
| Alpha Counter | 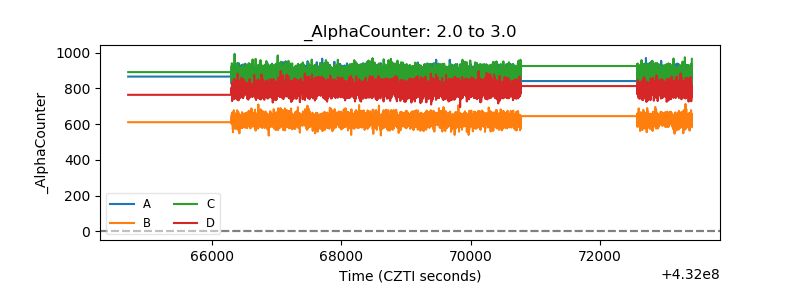 |
| _CPM_Rate | 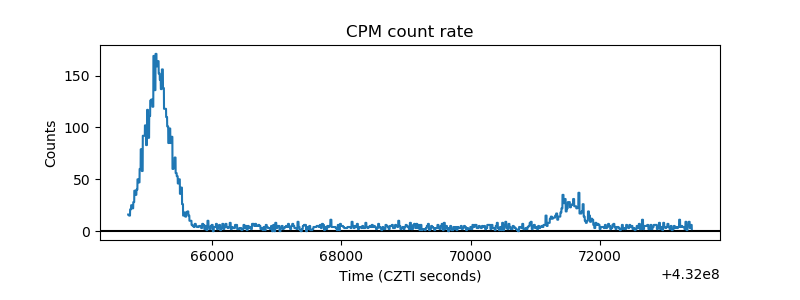 |
| CZT Counter | 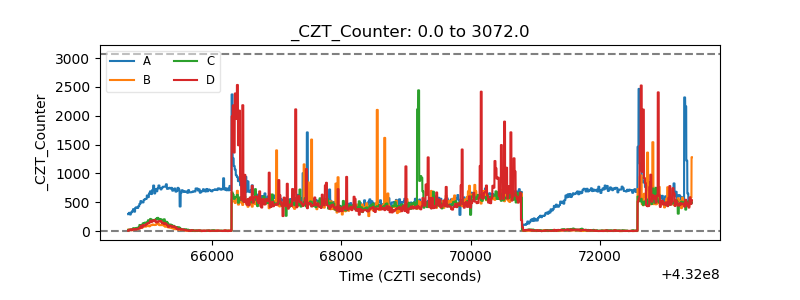 |
| +2.5 Volts monitor | 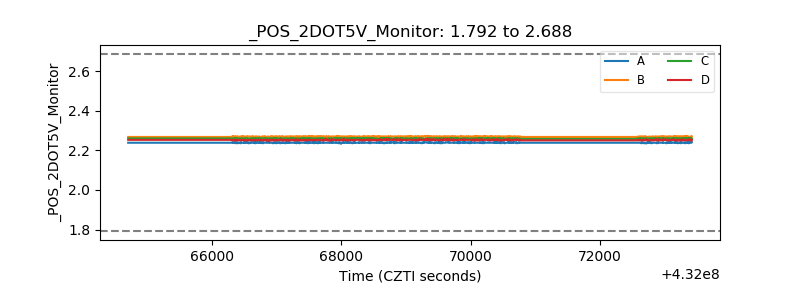 |
| +5 Volts monitor | 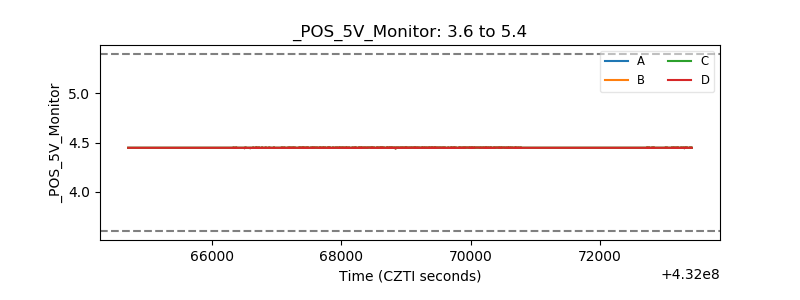 |
| _ROLL_ROT | 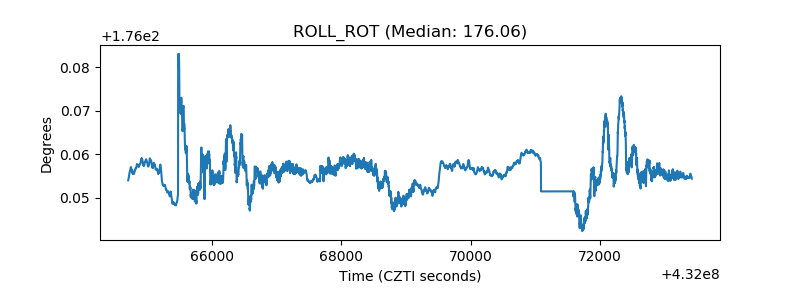 |
| _Roll_DEC | 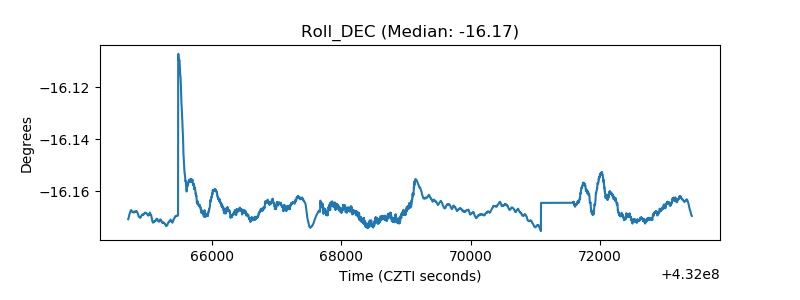 |
| _Roll_RA | 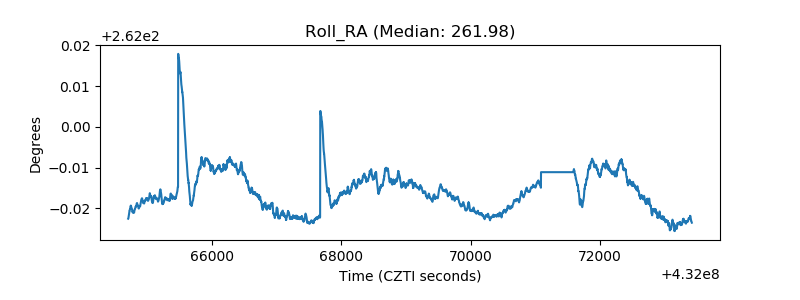 |
| Veto Counter | 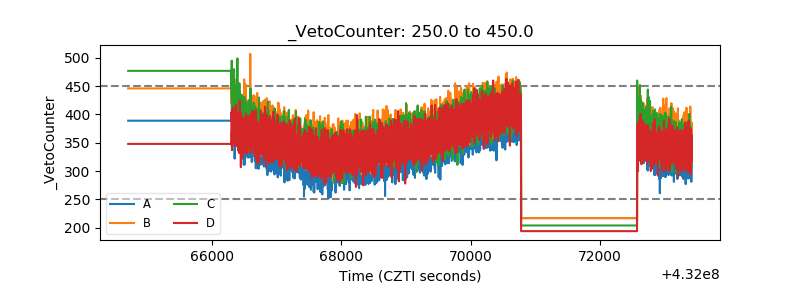 |