| Param | Original file | Final file |
|---|---|---|
| Filename | modeM0/AS1T05_148T01_9000005838_43000cztM0_level2.fits | modeM0/AS1T05_148T01_9000005838_43000cztM0_level2_quad_clean.evt |
| Size (bytes) | 349,992,000 | 111,386,880 |
| Size | 333.8 MB | 106.2 MB |
| Events in quadrant A | 3,481,422 | 770,047 |
| Events in quadrant B | 3,119,958 | 782,904 |
| Events in quadrant C | 2,802,342 | 751,512 |
| Events in quadrant D | 3,111,785 | 673,564 |
| Mode M9 | |||
|---|---|---|---|
| Quadrant | BADHDUFLAG | Total packets | Discarded packets |
| A | 0 | 24 | 0 |
| B | 0 | 25 | 0 |
| C | 0 | 25 | 0 |
| D | 0 | 25 | 0 |
| Mode SS | |||
|---|---|---|---|
| Quadrant | BADHDUFLAG | Total packets | Discarded packets |
| A | 0 | 114 | 0 |
| B | 0 | 114 | 0 |
| C | 0 | 114 | 0 |
| D | 0 | 114 | 0 |
| Mode M0 | |||
|---|---|---|---|
| Quadrant | BADHDUFLAG | Total packets | Discarded packets |
| A | 0 | 14319 | 2 |
| B | 0 | 13094 | 2 |
| C | 0 | 11723 | 2 |
| D | 0 | 13172 | 2 |
| Quadrant | Total seconds | Saturated seconds | Saturation percentage |
|---|---|---|---|
| A | 5655 | 90 | 1.591512% |
| B | 5655 | 45 | 0.795756% |
| C | 5655 | 3 | 0.053050% |
| D | 5655 | 81 | 1.432361% |
Noise dominated data is calculated using 1-second bins in cleaned event files. If a bin has >2000 counts, and if more than 50% of those come from <1% of pixels, then it is considered to be noise-dominated and hence unusable.
| Quadrant | # 1 sec bins | Bins with >0 counts | Bins with >2000 counts | High rate bins dominated by noise | Noise dominated (total time) | Noise dominated (detector-on time) | Marked lightcurve |
|---|---|---|---|---|---|---|---|
| A | 7118 | 5656 | 66 | 66 | 0.93% | 1.17% | 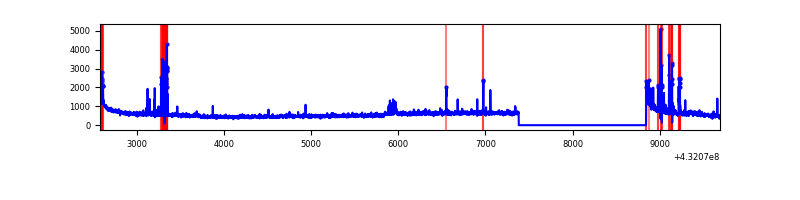 |
| B | 7118 | 5656 | 19 | 19 | 0.27% | 0.34% | 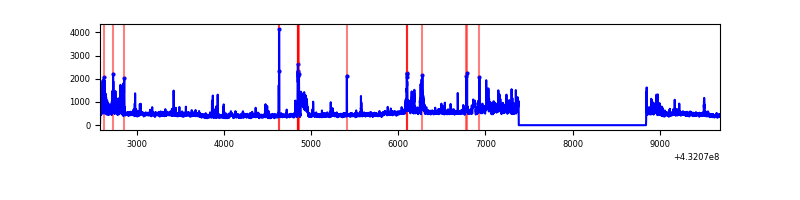 |
| C | 7118 | 5656 | 0 | 0 | 0.00% | 0.00% | 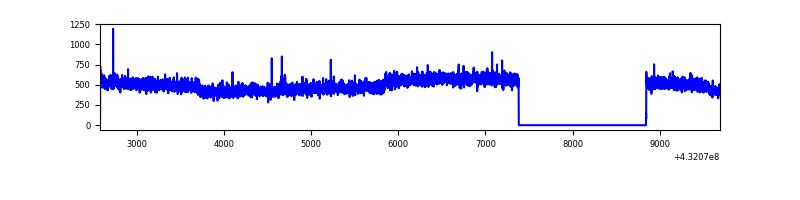 |
| D | 7118 | 5656 | 80 | 80 | 1.12% | 1.41% | 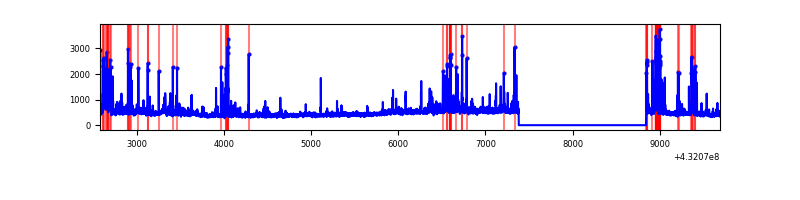 |
Top three noisy pixels from each quadrant. If the there are fewer than three noisy pixels in the level2.evt file, extra rows are filled as -1
| Pixel properties | Quadrant properties | ||||||
|---|---|---|---|---|---|---|---|
| Quadrant | DetID | PixID | Counts | Sigma | Mean | Median | Sigma |
| A | 10 | 83 | 588137 | 3989.96 | 671 | 661 | 147.2 |
| A | 15 | 237 | 199485 | 1350.35 | 671 | 661 | 147.2 |
| A | 15 | 222 | 72859 | 490.35 | 671 | 661 | 147.2 |
| B | 5 | 255 | 145626 | 1043.12 | 672 | 659 | 139.0 |
| B | 4 | 171 | 114856 | 821.71 | 672 | 659 | 139.0 |
| B | 3 | 112 | 110431 | 789.87 | 672 | 659 | 139.0 |
| C | 15 | 214 | 230157 | 1404.82 | 657 | 663 | 163.4 |
| C | 0 | 239 | 7138 | 39.64 | 657 | 663 | 163.4 |
| C | 13 | 61 | 4317 | 22.37 | 657 | 663 | 163.4 |
| D | 1 | 47 | 347208 | 2040.6 | 649 | 629 | 169.8 |
| D | 13 | 249 | 93003 | 543.88 | 649 | 629 | 169.8 |
| D | 13 | 171 | 52509 | 305.46 | 649 | 629 | 169.8 |
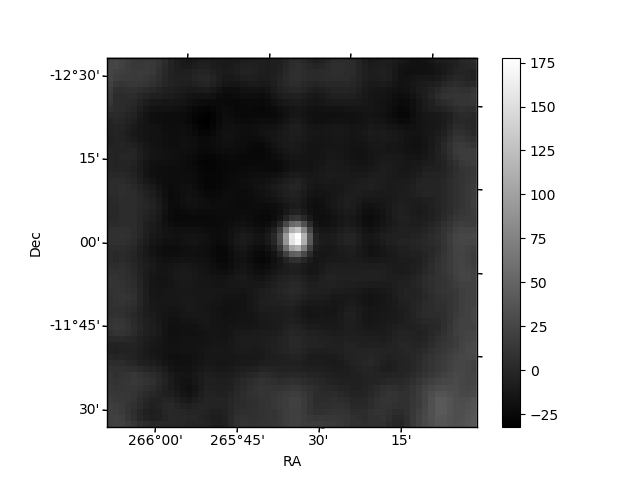
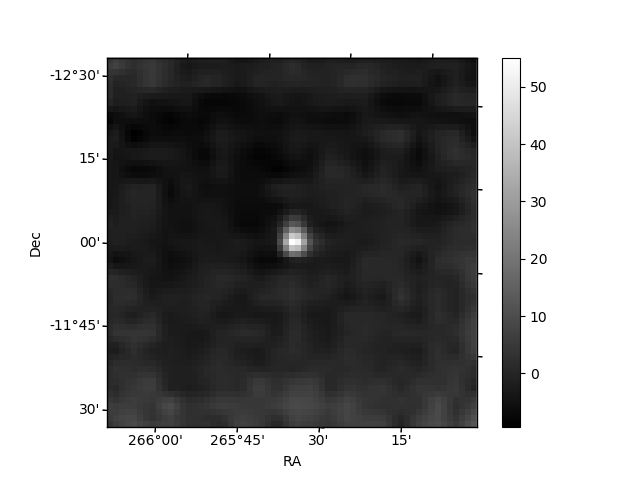
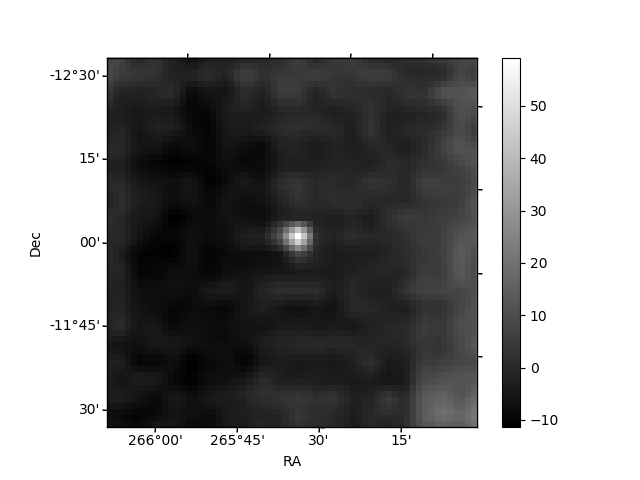
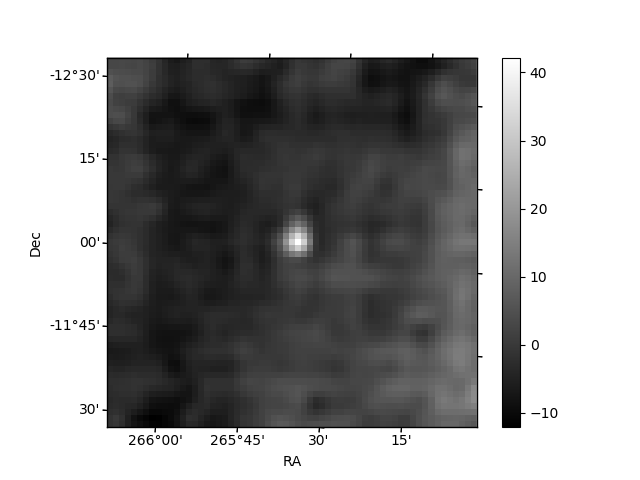
Histogram calculated using DETX and DETY for each event in the final _common_clean file
| Quadrant A | 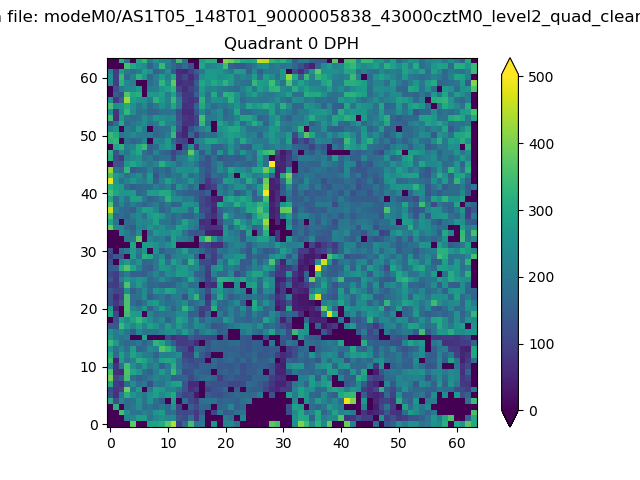 |
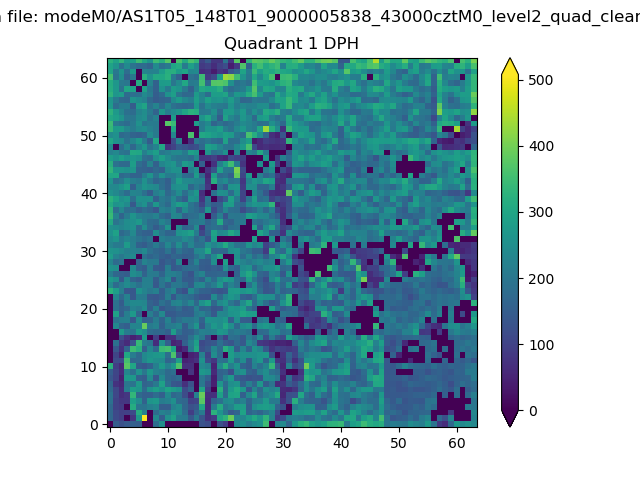 |
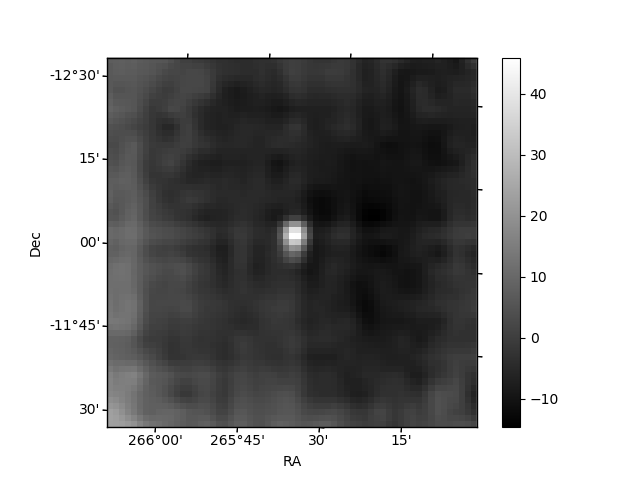
Quadrant B |
|---|---|---|---|
| Quadrant D | 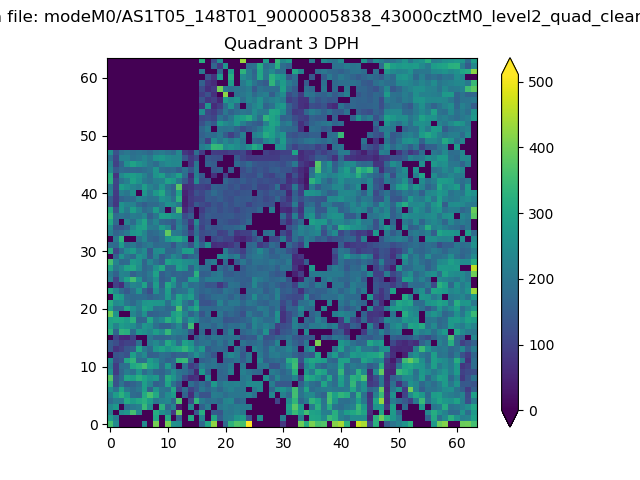 |
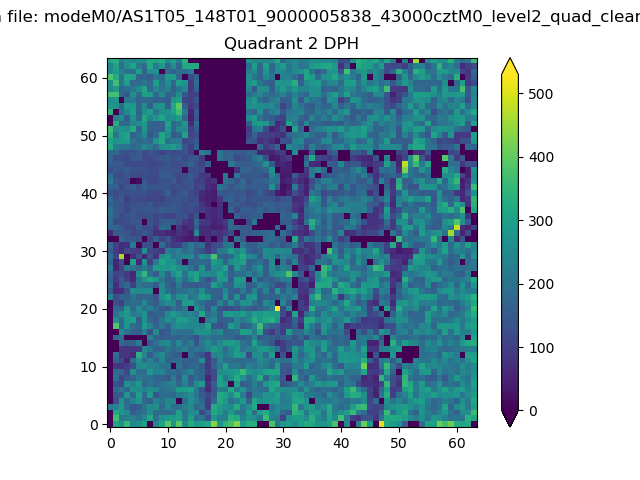 |
Quadrant C |
| Plot type | Count rate plots | Images |
|---|---|---|
| Comparison with Poisson distribution Blue bars denote a histogram of data divided into 1 sec bins. Red curve is a Poisson curve with rate = median count rate of data. |
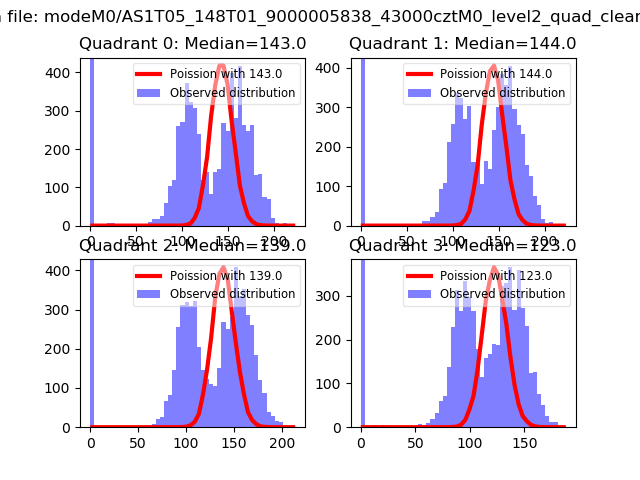 |
 |
| Quadrant-wise count rates Data is divided into 100 sec bins |
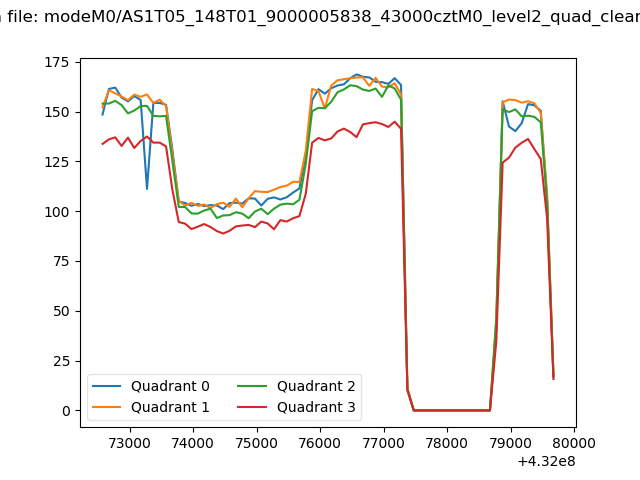 |
|
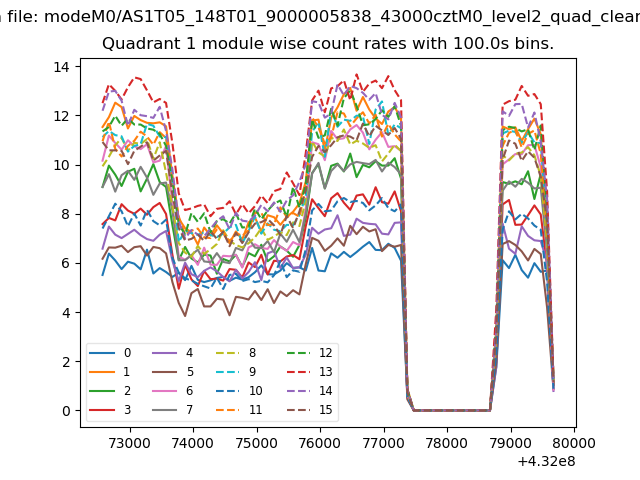
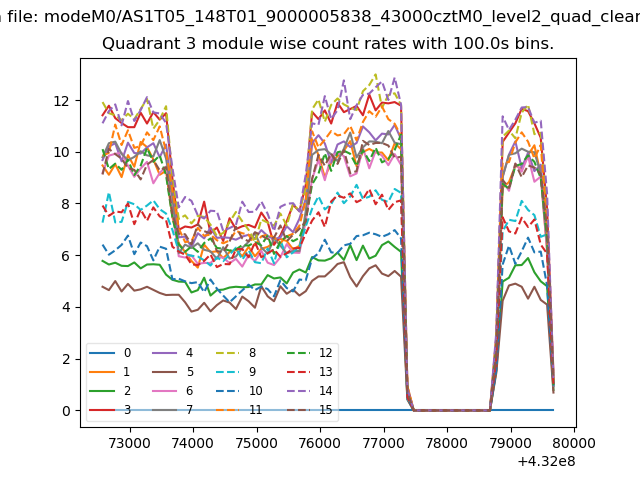
| Module-wise count rates for Quadrant A Data is divided into 100 sec bins |
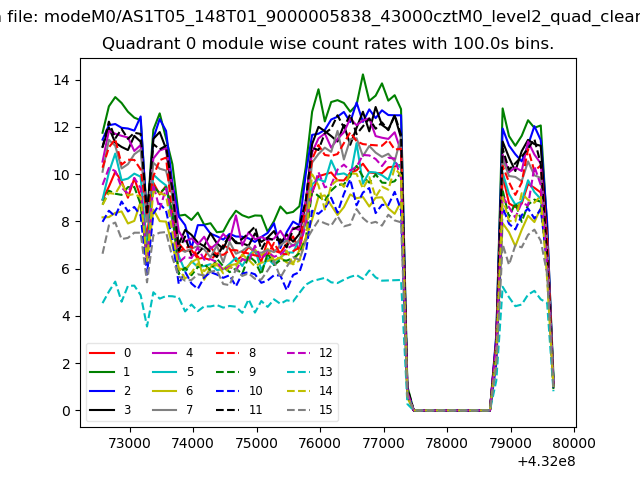 |
 |
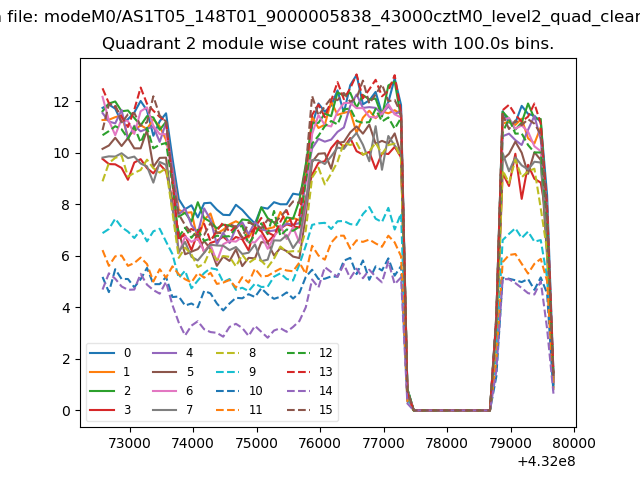
| Module-wise count rates for Quadrant B Data is divided into 100 sec bins |
 |
 |
| Module-wise count rates for Quadrant C Data is divided into 100 sec bins |
 |
 |
| Module-wise count rates for Quadrant D Data is divided into 100 sec bins |
 |
 |
| Parameter | Plot |
|---|---|
| CZT HV Monitor | 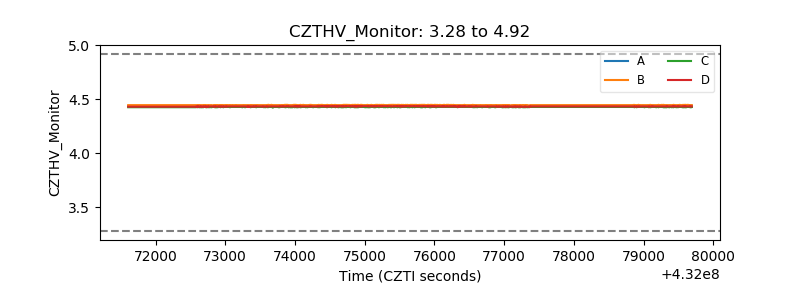 |
| D_VDD | 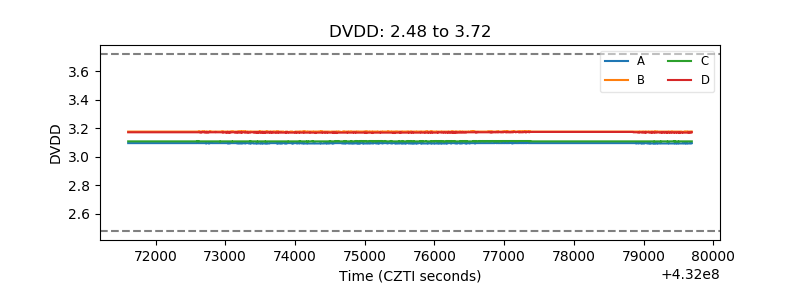 |
| Temperature 1 | 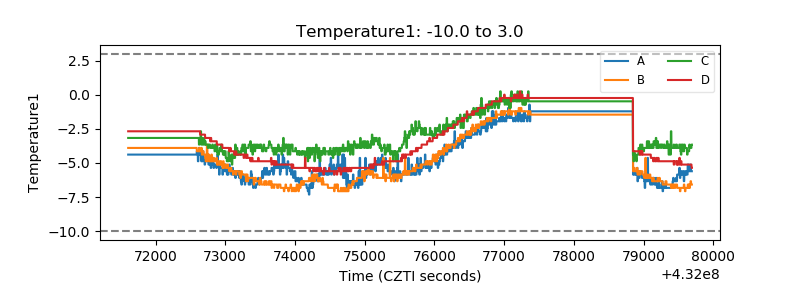 |
| Veto HV Monitor | 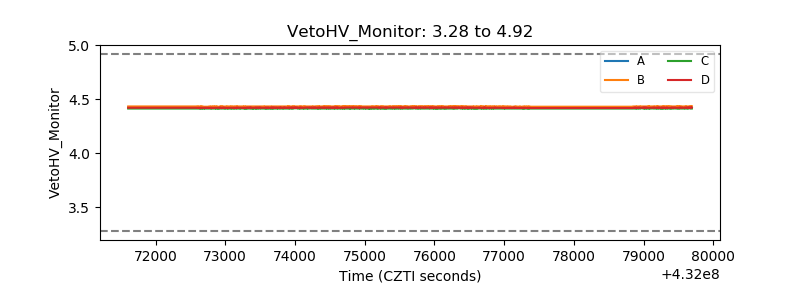 |
| Veto LLD | 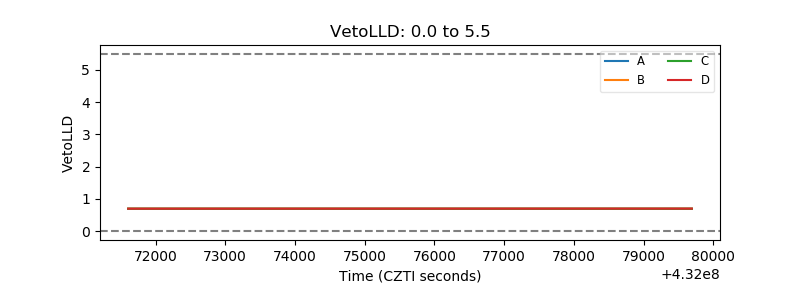 |
| Alpha Counter | 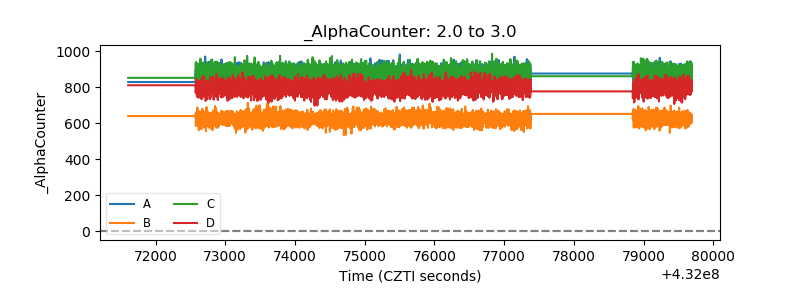 |
| _CPM_Rate |  |
| CZT Counter | 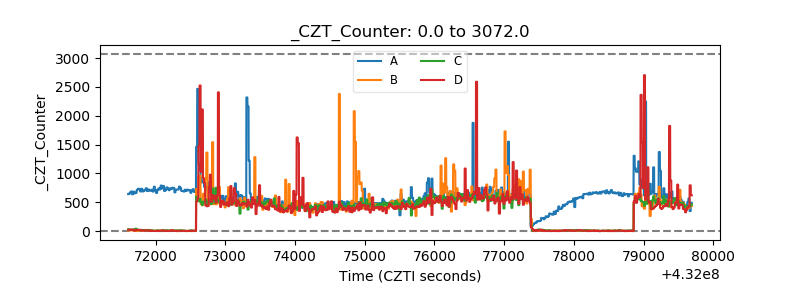 |
| +2.5 Volts monitor | 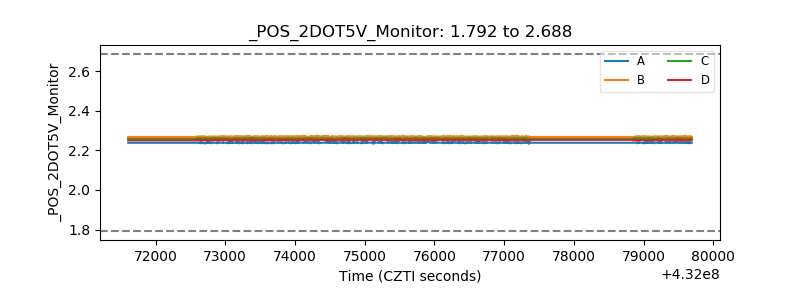 |
| +5 Volts monitor | 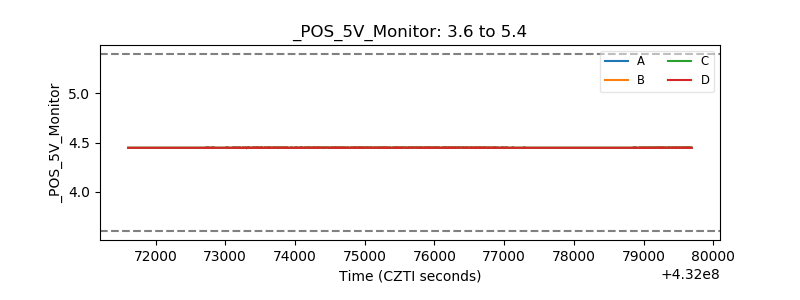 |
| _ROLL_ROT | 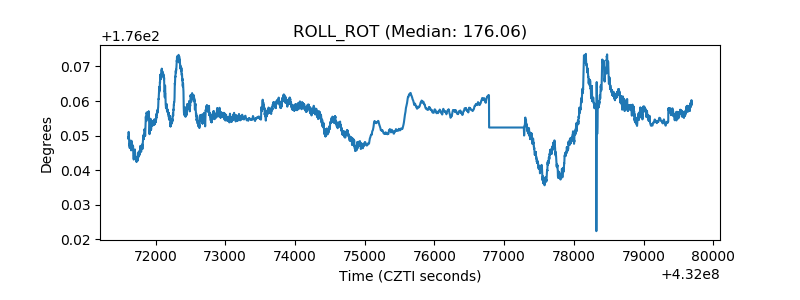 |
| _Roll_DEC | 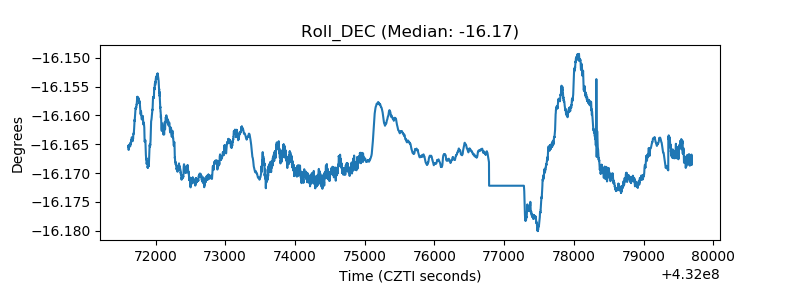 |
| _Roll_RA | 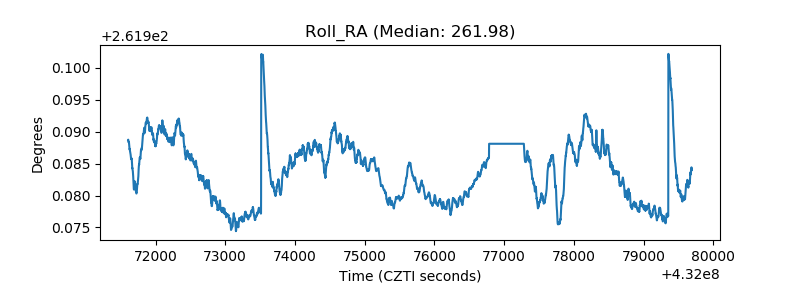 |
| Veto Counter | 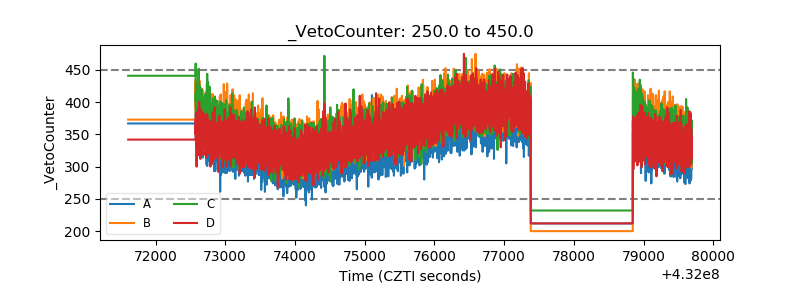 |