| Param | Original file | Final file |
|---|---|---|
| Filename | modeM0/AS1T05_148T01_9000005838_43001cztM0_level2.fits | modeM0/AS1T05_148T01_9000005838_43001cztM0_level2_quad_clean.evt |
| Size (bytes) | 374,431,680 | 114,949,440 |
| Size | 357.1 MB | 109.6 MB |
| Events in quadrant A | 3,557,449 | 793,907 |
| Events in quadrant B | 3,240,669 | 802,270 |
| Events in quadrant C | 2,954,116 | 771,992 |
| Events in quadrant D | 3,641,352 | 694,218 |
| Mode M9 | |||
|---|---|---|---|
| Quadrant | BADHDUFLAG | Total packets | Discarded packets |
| A | 0 | 29 | 0 |
| B | 0 | 29 | 0 |
| C | 0 | 29 | 0 |
| D | 0 | 29 | 0 |
| Mode SS | |||
|---|---|---|---|
| Quadrant | BADHDUFLAG | Total packets | Discarded packets |
| A | 0 | 122 | 0 |
| B | 0 | 122 | 0 |
| C | 0 | 122 | 0 |
| D | 0 | 122 | 0 |
| Mode M0 | |||
|---|---|---|---|
| Quadrant | BADHDUFLAG | Total packets | Discarded packets |
| A | 0 | 14669 | 2 |
| B | 0 | 13688 | 2 |
| C | 0 | 12385 | 2 |
| D | 0 | 15056 | 2 |
| Quadrant | Total seconds | Saturated seconds | Saturation percentage |
|---|---|---|---|
| A | 5998 | 48 | 0.800267% |
| B | 5999 | 77 | 1.283547% |
| C | 5999 | 3 | 0.050008% |
| D | 5999 | 112 | 1.866978% |
Noise dominated data is calculated using 1-second bins in cleaned event files. If a bin has >2000 counts, and if more than 50% of those come from <1% of pixels, then it is considered to be noise-dominated and hence unusable.
| Quadrant | # 1 sec bins | Bins with >0 counts | Bins with >2000 counts | High rate bins dominated by noise | Noise dominated (total time) | Noise dominated (detector-on time) | Marked lightcurve |
|---|---|---|---|---|---|---|---|
| A | 8773 | 6000 | 27 | 27 | 0.31% | 0.45% |  |
| B | 8774 | 6001 | 20 | 20 | 0.23% | 0.33% |  |
| C | 8774 | 6001 | 0 | 0 | 0.00% | 0.00% | 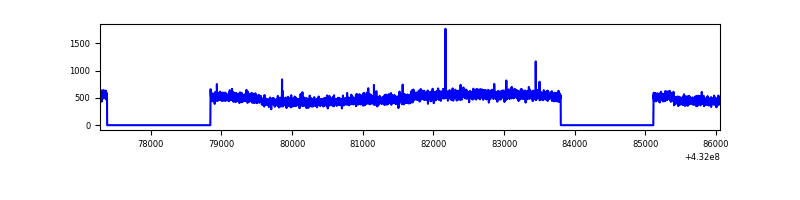 |
| D | 8774 | 6001 | 100 | 100 | 1.14% | 1.67% | 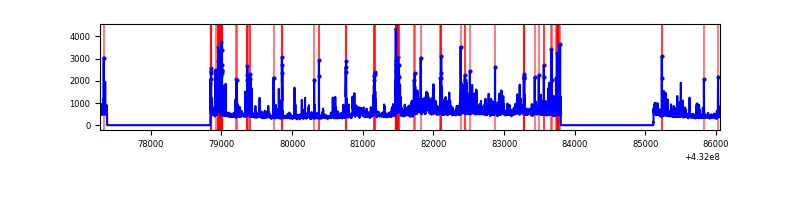 |
Top three noisy pixels from each quadrant. If the there are fewer than three noisy pixels in the level2.evt file, extra rows are filled as -1
| Pixel properties | Quadrant properties | ||||||
|---|---|---|---|---|---|---|---|
| Quadrant | DetID | PixID | Counts | Sigma | Mean | Median | Sigma |
| A | 10 | 83 | 609057 | 3980.73 | 708 | 696 | 152.8 |
| A | 15 | 222 | 109219 | 710.11 | 708 | 696 | 152.8 |
| A | 15 | 237 | 101879 | 662.08 | 708 | 696 | 152.8 |
| B | 4 | 171 | 182741 | 1265.11 | 704 | 689 | 143.9 |
| B | 4 | 81 | 167620 | 1160.04 | 704 | 689 | 143.9 |
| B | 5 | 255 | 59420 | 408.13 | 704 | 689 | 143.9 |
| C | 15 | 214 | 244541 | 1437.59 | 690 | 700 | 169.6 |
| C | 0 | 239 | 6328 | 33.18 | 690 | 700 | 169.6 |
| C | 5 | 250 | 6111 | 31.9 | 690 | 700 | 169.6 |
| D | 1 | 47 | 428075 | 2445.5 | 681 | 663 | 174.8 |
| D | 1 | 52 | 292921 | 1672.19 | 681 | 663 | 174.8 |
| D | 2 | 249 | 185683 | 1058.62 | 681 | 663 | 174.8 |
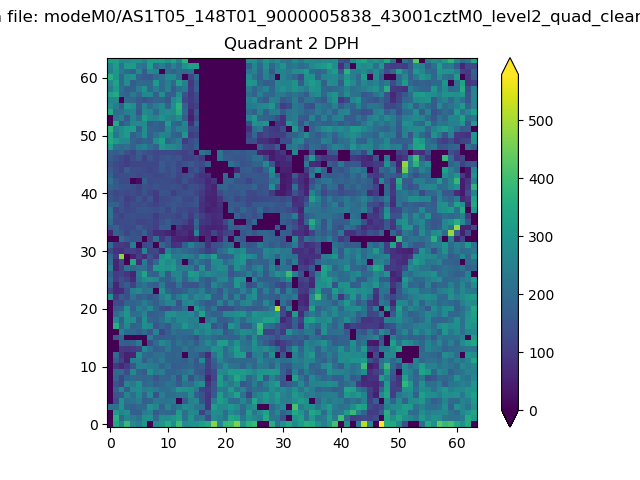
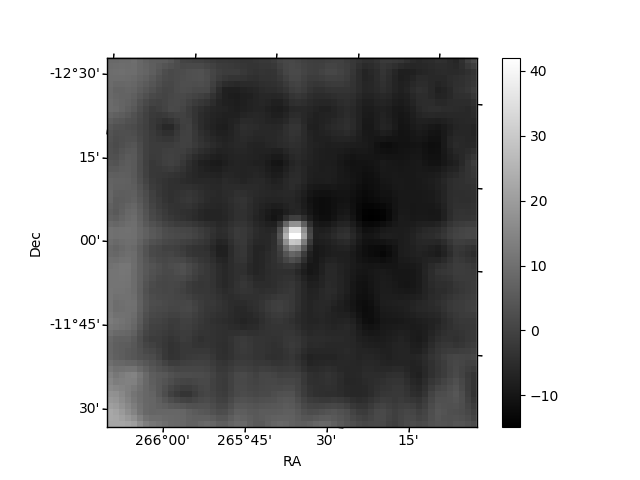
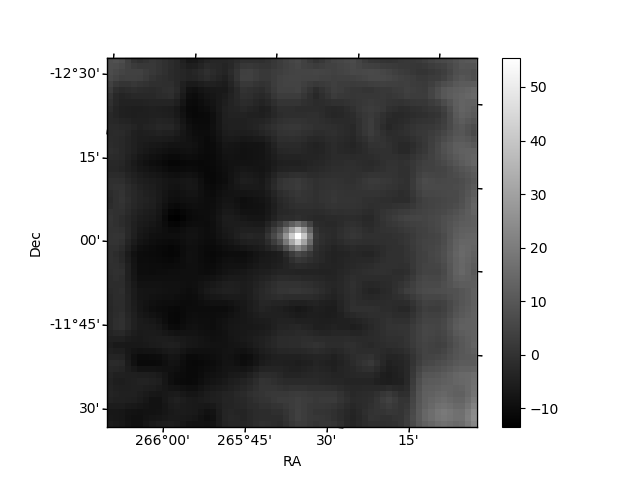
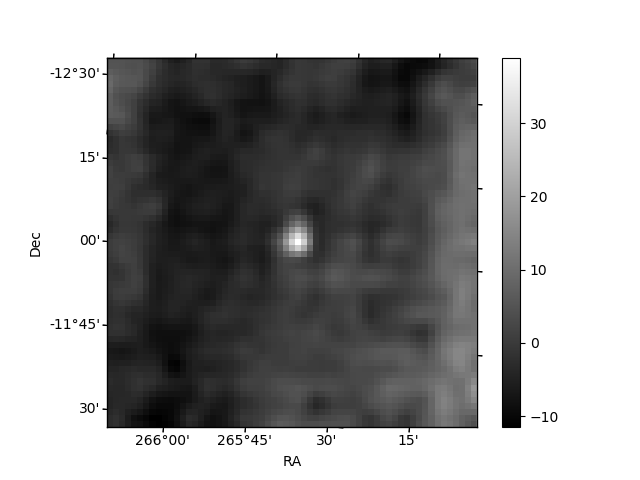
Histogram calculated using DETX and DETY for each event in the final _common_clean file
| Quadrant A | 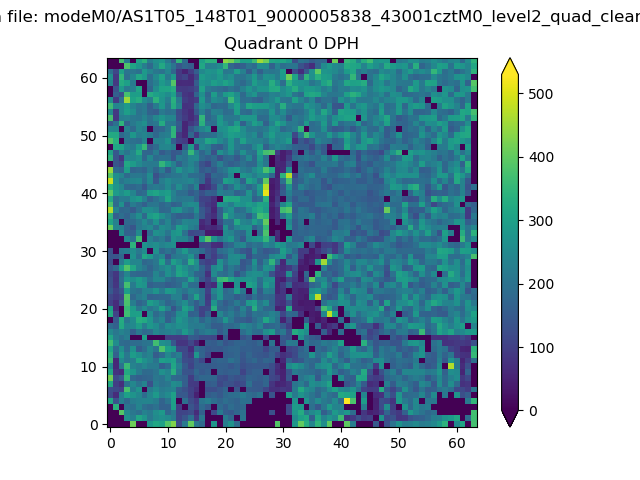 |
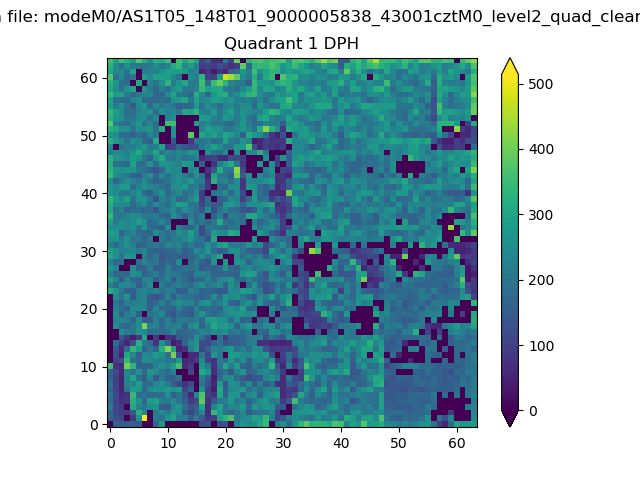 |
Quadrant B |
|---|---|---|---|
| Quadrant D | 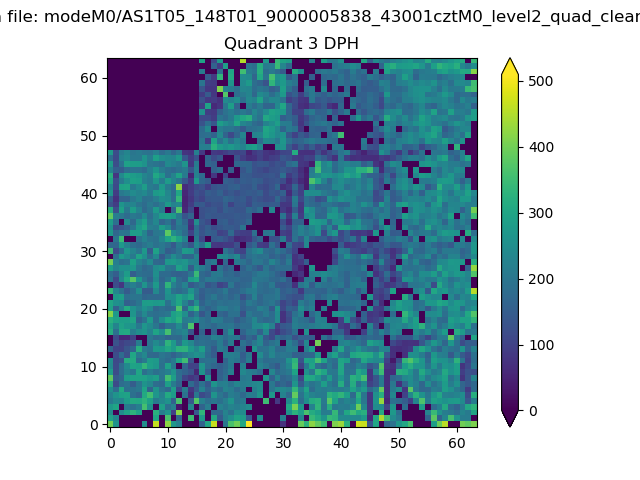 |
 |
Quadrant C |
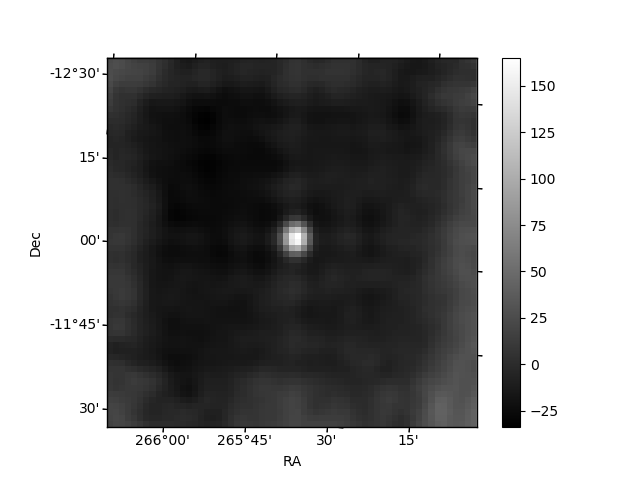
| Plot type | Count rate plots | Images |
|---|---|---|
| Comparison with Poisson distribution Blue bars denote a histogram of data divided into 1 sec bins. Red curve is a Poisson curve with rate = median count rate of data. |
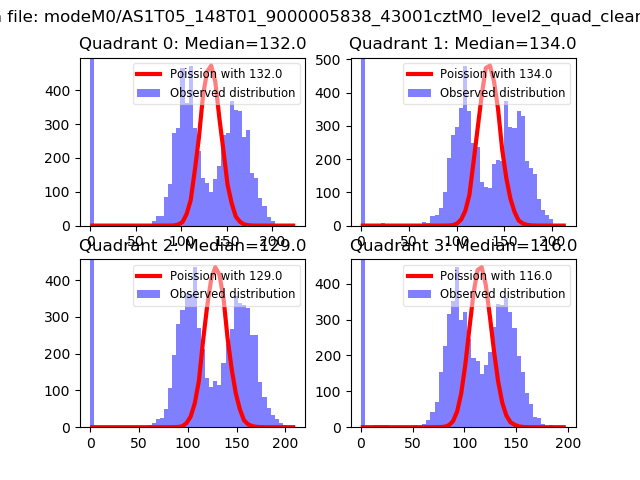 |
 |
| Quadrant-wise count rates Data is divided into 100 sec bins |
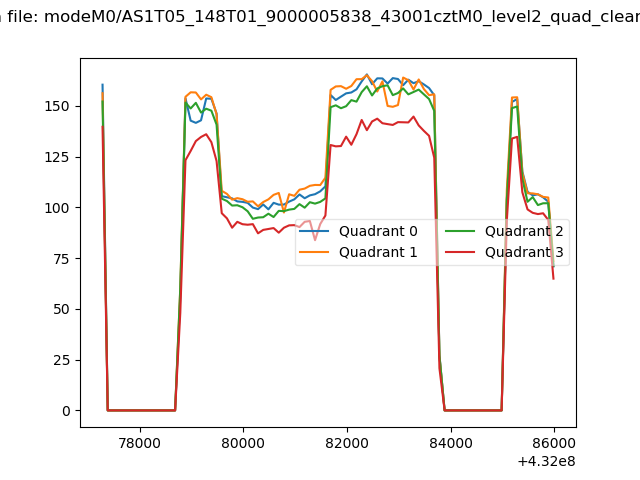 |
|
| Module-wise count rates for Quadrant A Data is divided into 100 sec bins |
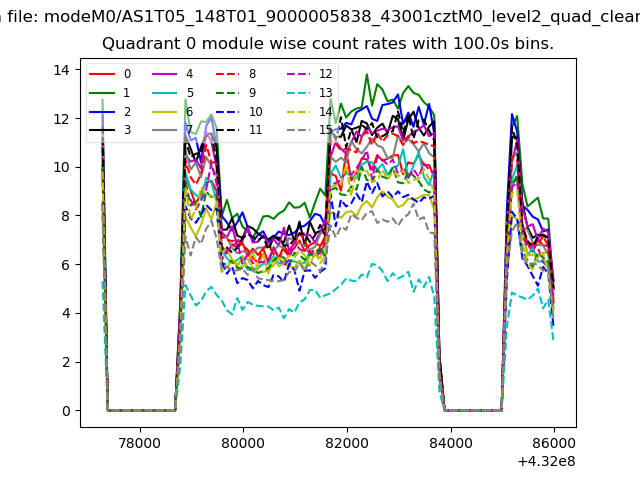 |
 |
| Module-wise count rates for Quadrant B Data is divided into 100 sec bins |
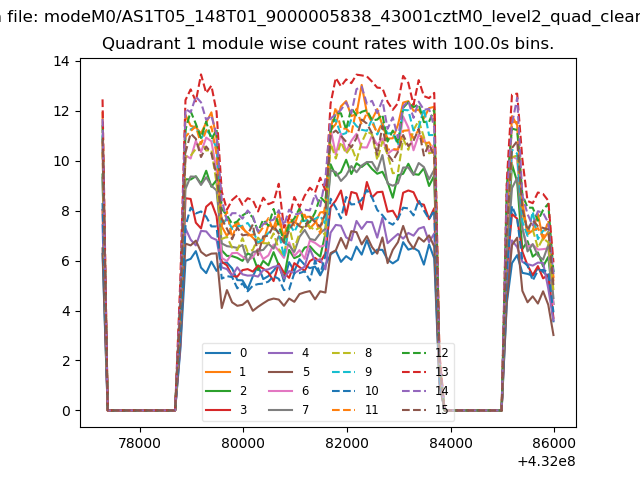 |
 |
| Module-wise count rates for Quadrant C Data is divided into 100 sec bins |
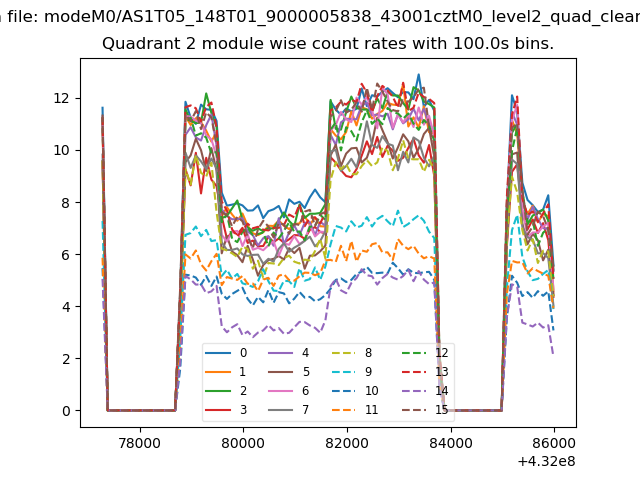 |
 |
| Module-wise count rates for Quadrant D Data is divided into 100 sec bins |
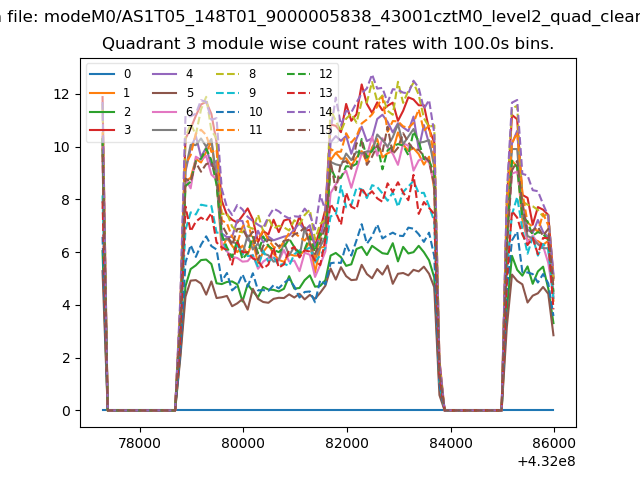 |
 |
| Parameter | Plot |
|---|---|
| CZT HV Monitor | 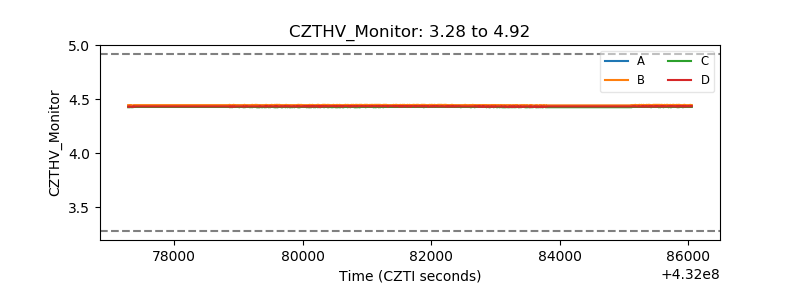 |
| D_VDD | 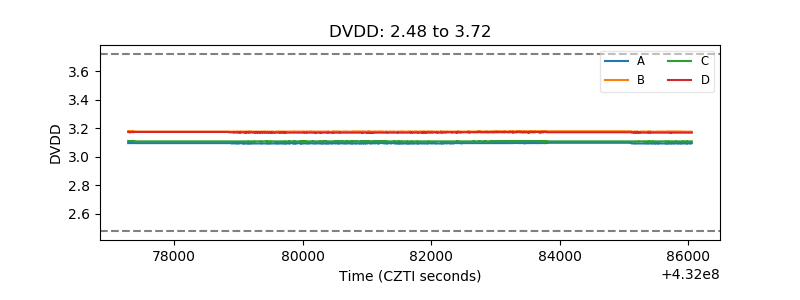 |
| Temperature 1 | 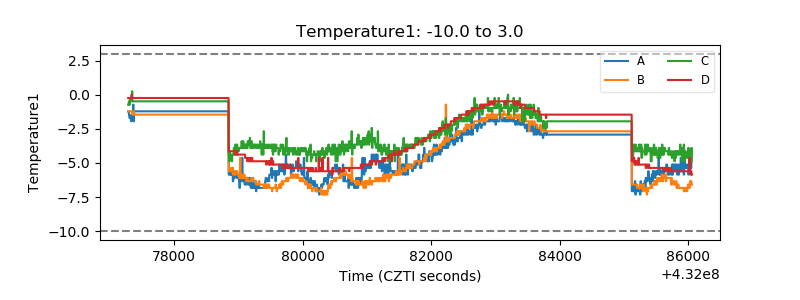 |
| Veto HV Monitor | 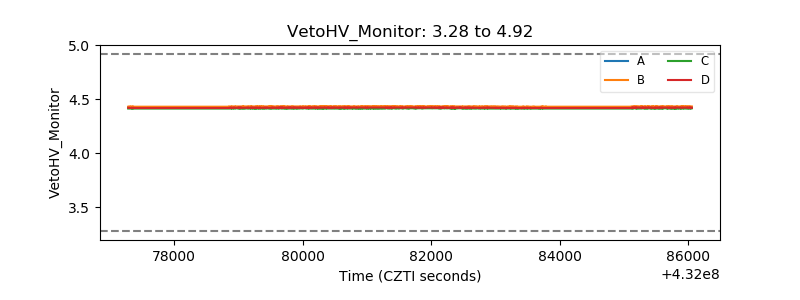 |
| Veto LLD | 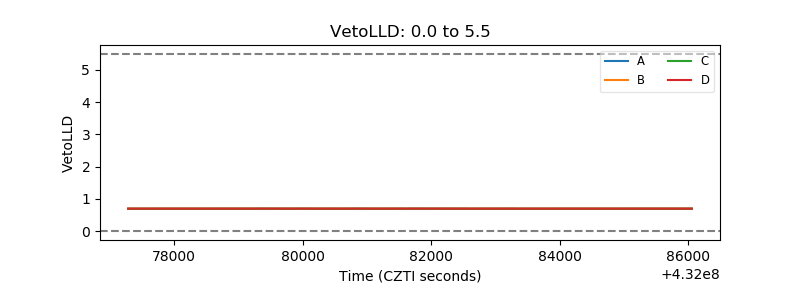 |
| Alpha Counter | 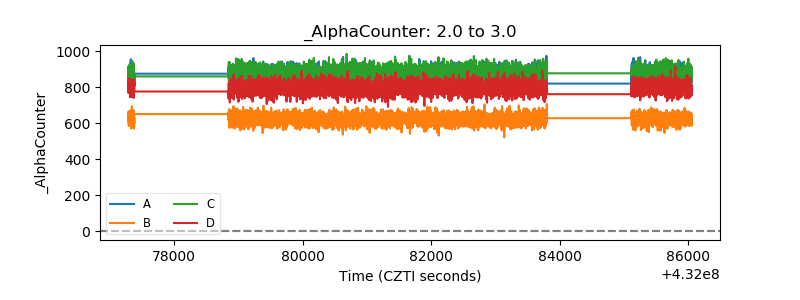 |
| _CPM_Rate |  |
| CZT Counter | 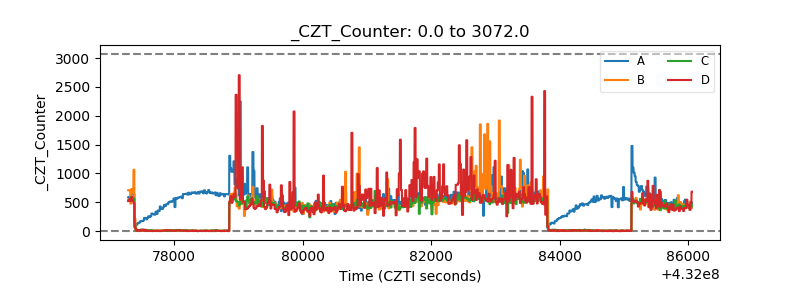 |
| +2.5 Volts monitor | 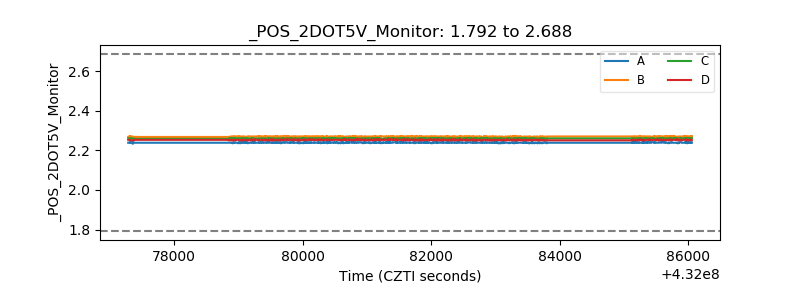 |
| +5 Volts monitor | 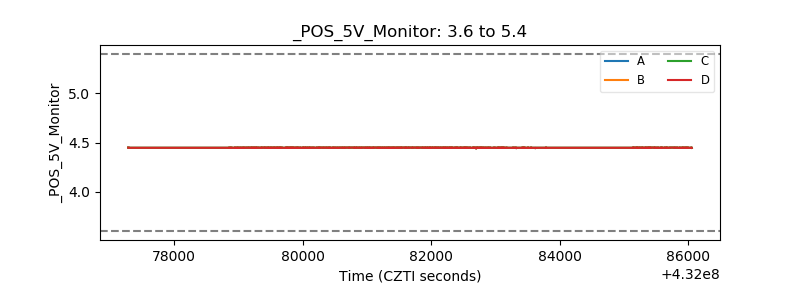 |
| _ROLL_ROT | 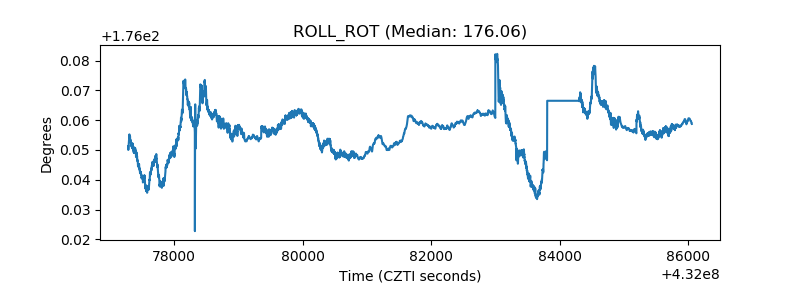 |
| _Roll_DEC | 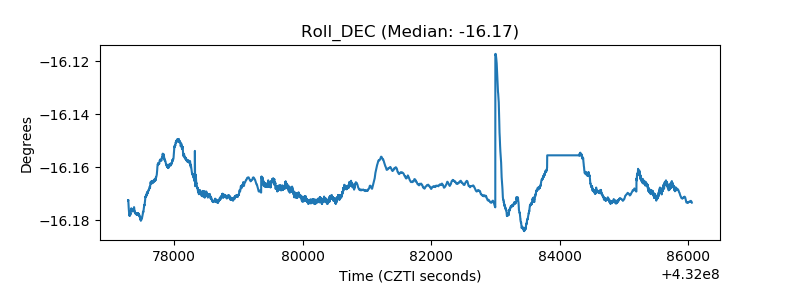 |
| _Roll_RA | 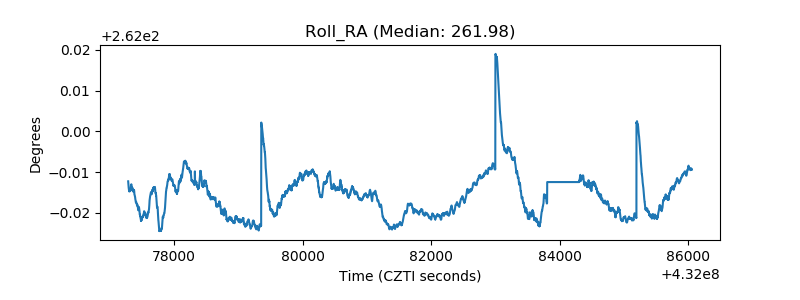 |
| Veto Counter | 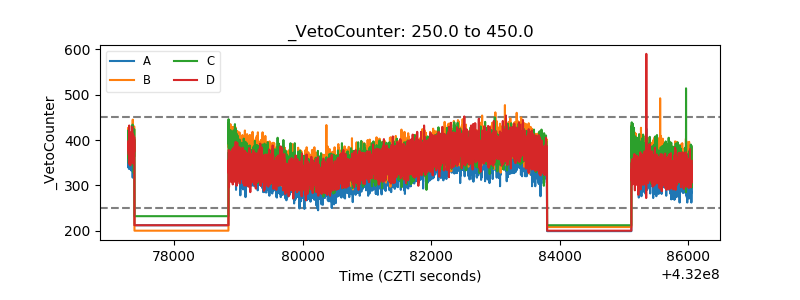 |