| Param | Original file | Final file |
|---|---|---|
| Filename | modeM0/AS1T05_148T01_9000005838_43002cztM0_level2.fits | modeM0/AS1T05_148T01_9000005838_43002cztM0_level2_quad_clean.evt |
| Size (bytes) | 362,652,480 | 113,287,680 |
| Size | 345.9 MB | 108.0 MB |
| Events in quadrant A | 3,393,220 | 782,552 |
| Events in quadrant B | 3,359,683 | 784,298 |
| Events in quadrant C | 2,960,743 | 757,194 |
| Events in quadrant D | 3,239,356 | 684,128 |
| Mode M9 | |||
|---|---|---|---|
| Quadrant | BADHDUFLAG | Total packets | Discarded packets |
| A | 0 | 21 | 0 |
| B | 0 | 22 | 0 |
| C | 0 | 22 | 0 |
| D | 0 | 22 | 0 |
| Mode SS | |||
|---|---|---|---|
| Quadrant | BADHDUFLAG | Total packets | Discarded packets |
| A | 0 | 122 | 0 |
| B | 0 | 122 | 0 |
| C | 0 | 122 | 0 |
| D | 0 | 122 | 0 |
| Mode M0 | |||
|---|---|---|---|
| Quadrant | BADHDUFLAG | Total packets | Discarded packets |
| A | 0 | 14020 | 2 |
| B | 0 | 13988 | 2 |
| C | 0 | 12366 | 2 |
| D | 0 | 13856 | 2 |
| Quadrant | Total seconds | Saturated seconds | Saturation percentage |
|---|---|---|---|
| A | 6054 | 12 | 0.198216% |
| B | 6053 | 131 | 2.164216% |
| C | 6053 | 2 | 0.033041% |
| D | 6053 | 65 | 1.073848% |
Noise dominated data is calculated using 1-second bins in cleaned event files. If a bin has >2000 counts, and if more than 50% of those come from <1% of pixels, then it is considered to be noise-dominated and hence unusable.
| Quadrant | # 1 sec bins | Bins with >0 counts | Bins with >2000 counts | High rate bins dominated by noise | Noise dominated (total time) | Noise dominated (detector-on time) | Marked lightcurve |
|---|---|---|---|---|---|---|---|
| A | 7338 | 6055 | 6 | 6 | 0.08% | 0.10% | 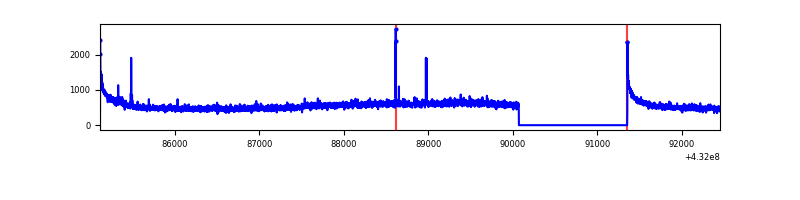 |
| B | 7337 | 6054 | 53 | 53 | 0.72% | 0.88% | 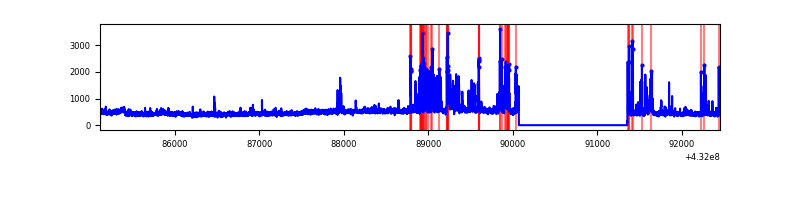 |
| C | 7337 | 6054 | 0 | 0 | 0.00% | 0.00% | 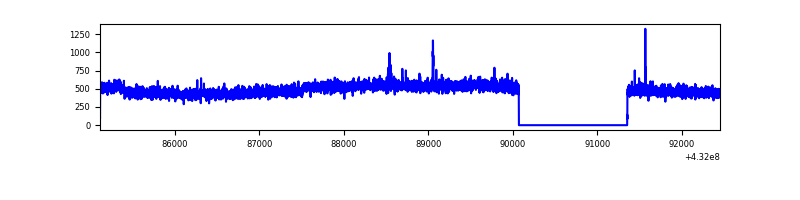 |
| D | 7337 | 6054 | 71 | 71 | 0.97% | 1.17% | 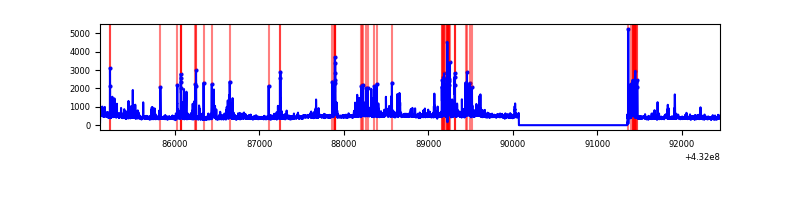 |
Top three noisy pixels from each quadrant. If the there are fewer than three noisy pixels in the level2.evt file, extra rows are filled as -1
| Pixel properties | Quadrant properties | ||||||
|---|---|---|---|---|---|---|---|
| Quadrant | DetID | PixID | Counts | Sigma | Mean | Median | Sigma |
| A | 10 | 83 | 616127 | 4063.26 | 708 | 696 | 151.5 |
| A | 15 | 237 | 22419 | 143.42 | 708 | 696 | 151.5 |
| A | 15 | 222 | 15710 | 99.13 | 708 | 696 | 151.5 |
| B | 4 | 171 | 450782 | 3150.11 | 700 | 683 | 142.9 |
| B | 4 | 81 | 56004 | 387.17 | 700 | 683 | 142.9 |
| B | 15 | 85 | 51775 | 357.58 | 700 | 683 | 142.9 |
| C | 15 | 214 | 248098 | 1471.95 | 689 | 697 | 168.1 |
| C | 15 | 208 | 12716 | 71.51 | 689 | 697 | 168.1 |
| C | 7 | 220 | 6365 | 33.72 | 689 | 697 | 168.1 |
| D | 1 | 52 | 289111 | 1658.99 | 682 | 662 | 173.9 |
| D | 1 | 47 | 236943 | 1358.95 | 682 | 662 | 173.9 |
| D | 13 | 249 | 31973 | 180.08 | 682 | 662 | 173.9 |
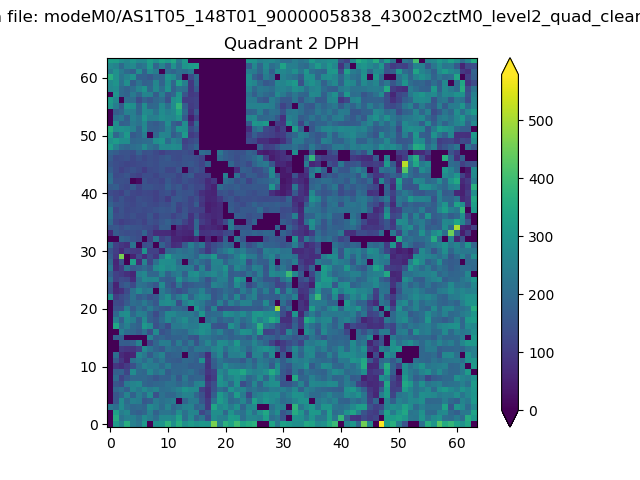
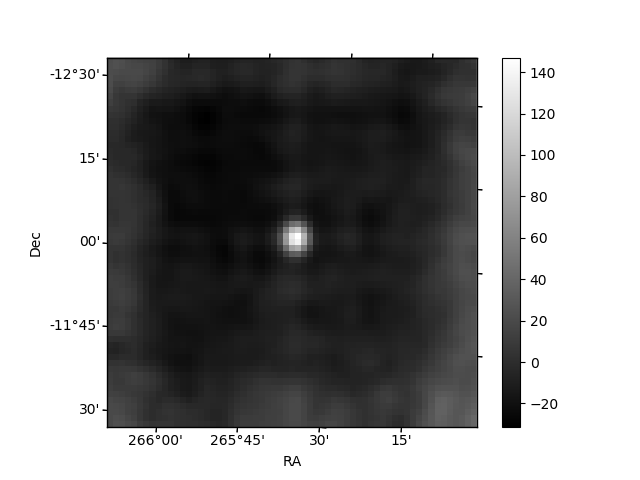
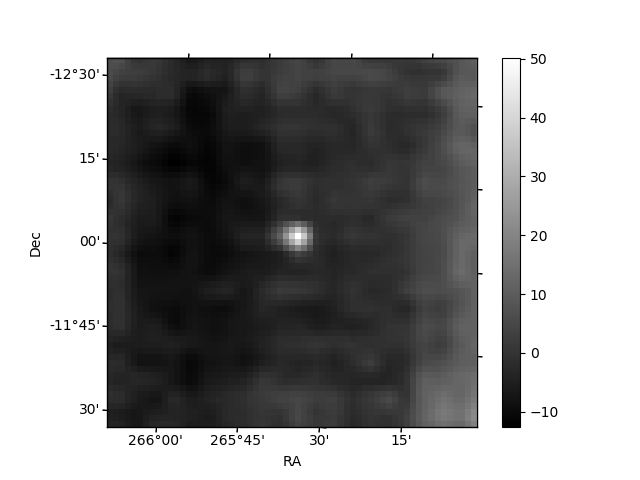
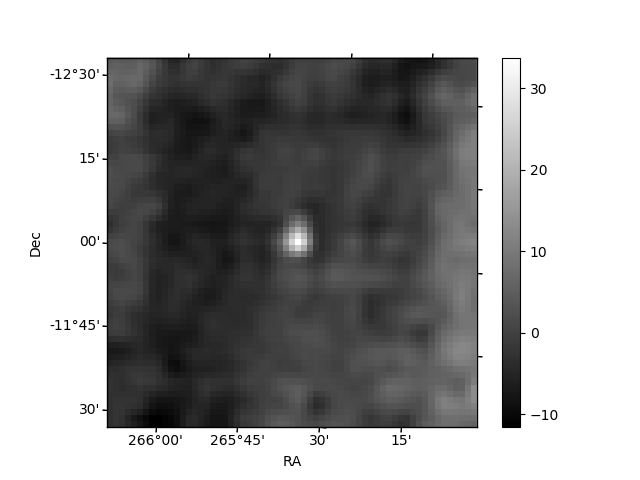
Histogram calculated using DETX and DETY for each event in the final _common_clean file
| Quadrant A | 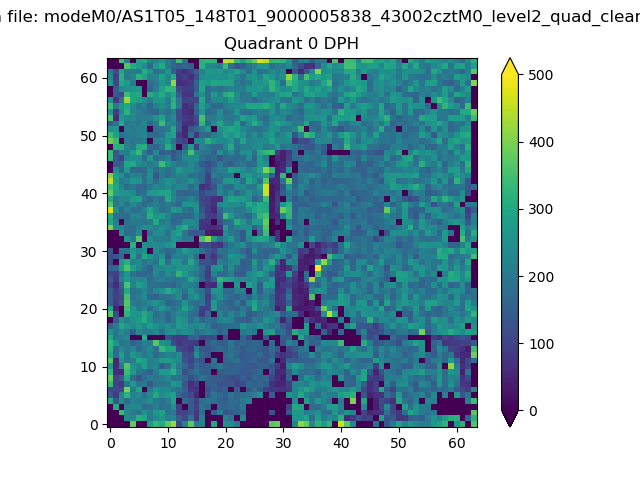 |
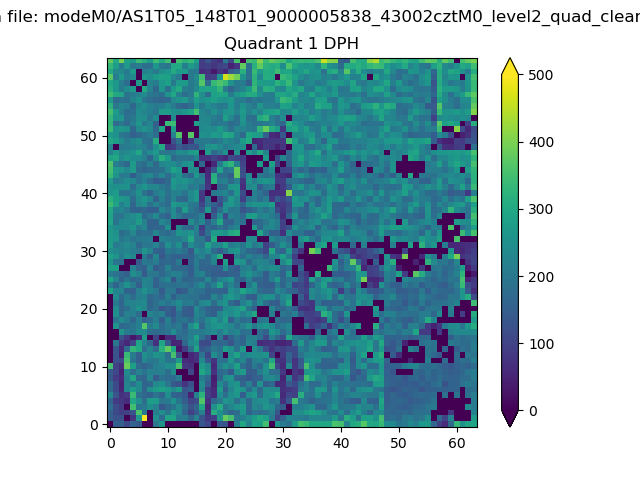 |
Quadrant B |
|---|---|---|---|
| Quadrant D | 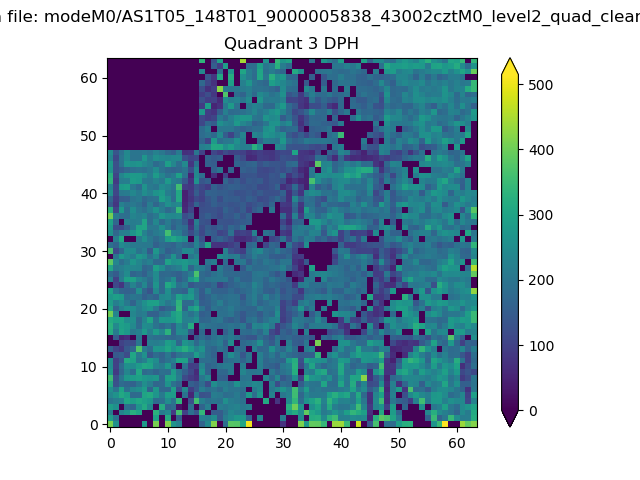 |
 |
Quadrant C |
| Plot type | Count rate plots | Images |
|---|---|---|
| Comparison with Poisson distribution Blue bars denote a histogram of data divided into 1 sec bins. Red curve is a Poisson curve with rate = median count rate of data. |
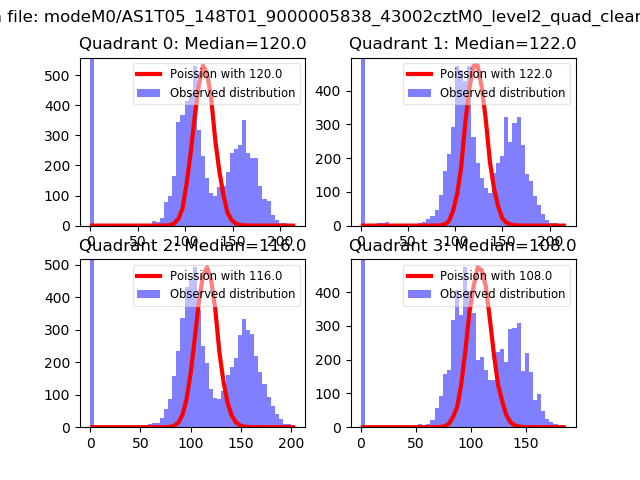 |
 |
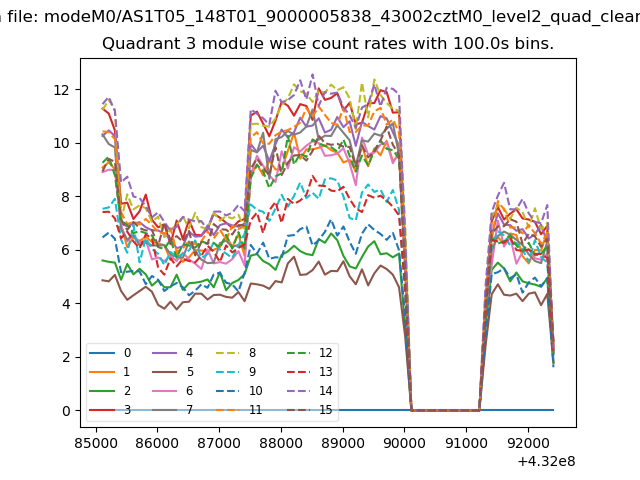
| Quadrant-wise count rates Data is divided into 100 sec bins |
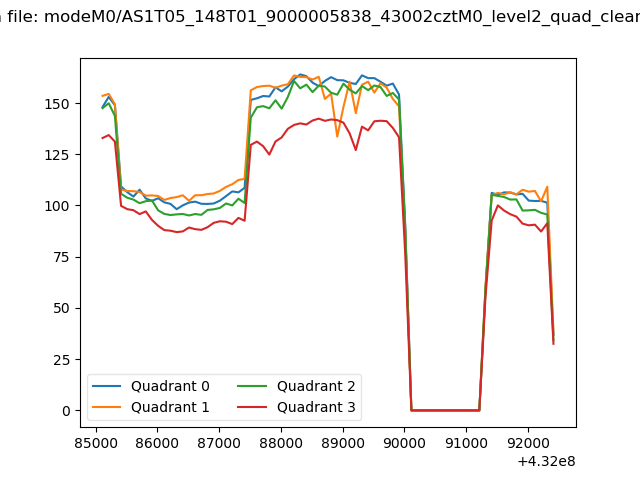 |
|
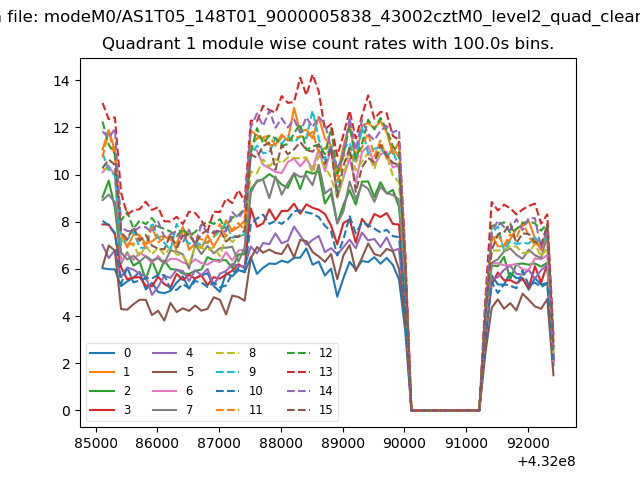
| Module-wise count rates for Quadrant A Data is divided into 100 sec bins |
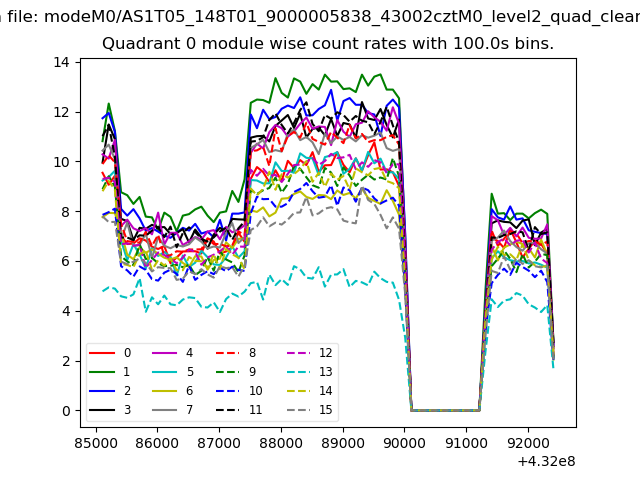 |
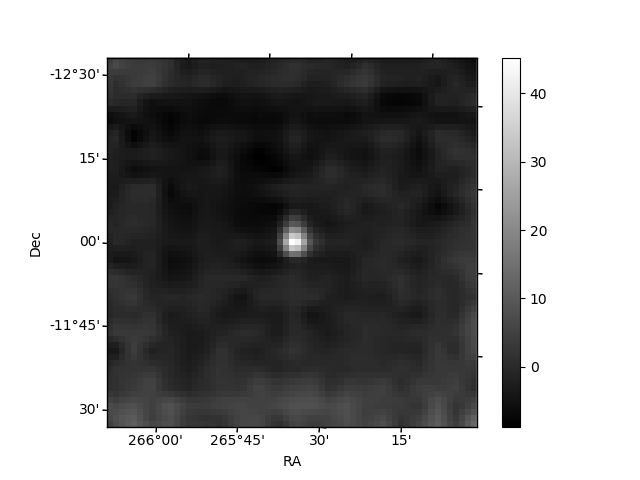 |
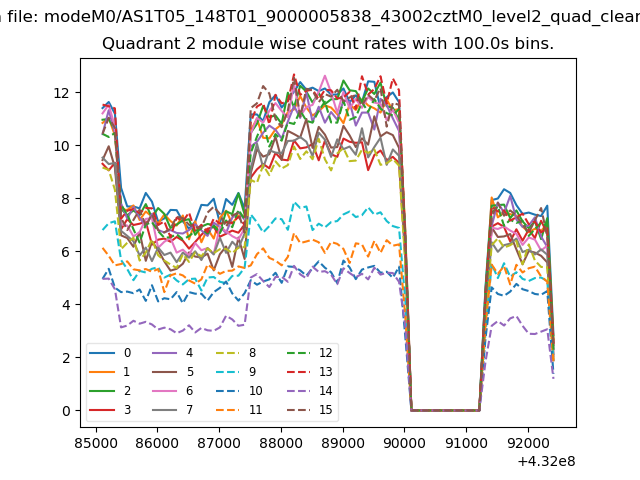
| Module-wise count rates for Quadrant B Data is divided into 100 sec bins |
 |
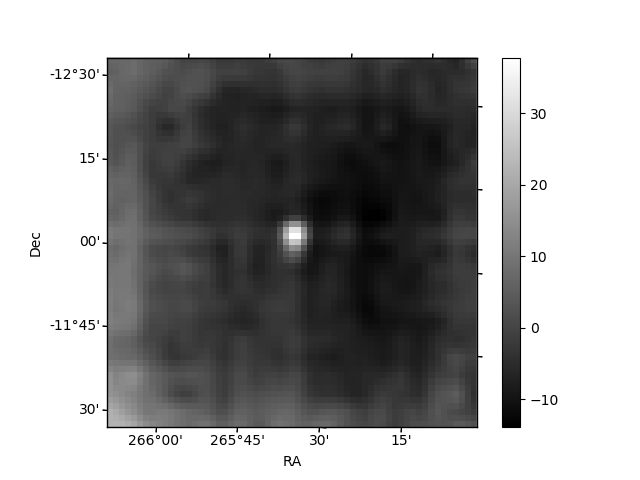 |
| Module-wise count rates for Quadrant C Data is divided into 100 sec bins |
 |
 |
| Module-wise count rates for Quadrant D Data is divided into 100 sec bins |
 |
 |
| Parameter | Plot |
|---|---|
| CZT HV Monitor | 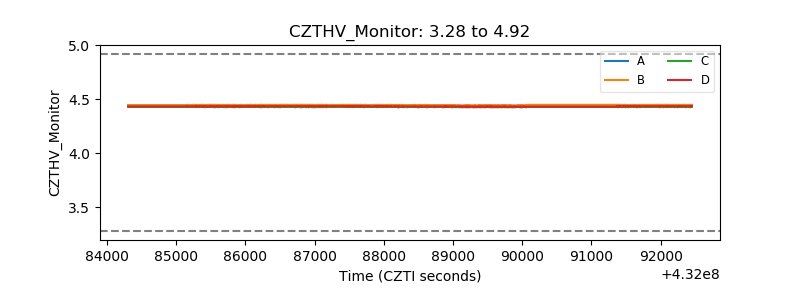 |
| D_VDD | 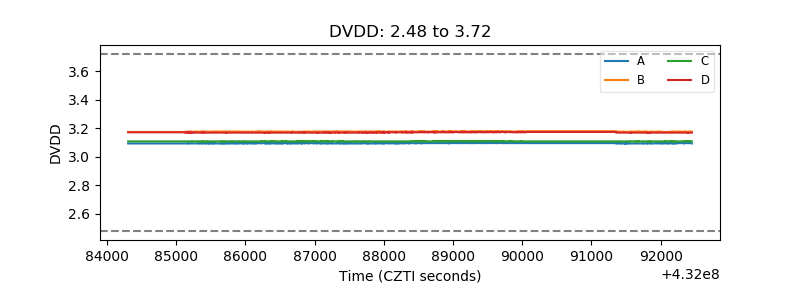 |
| Temperature 1 | 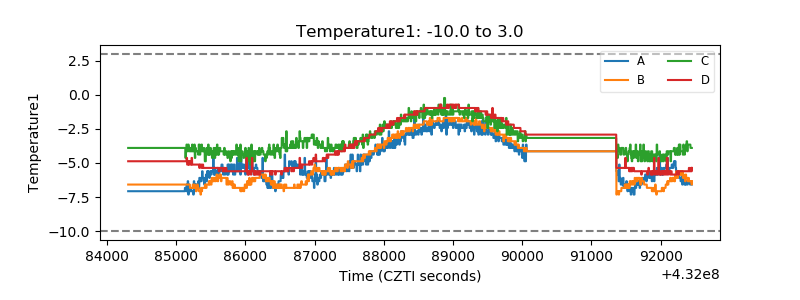 |
| Veto HV Monitor | 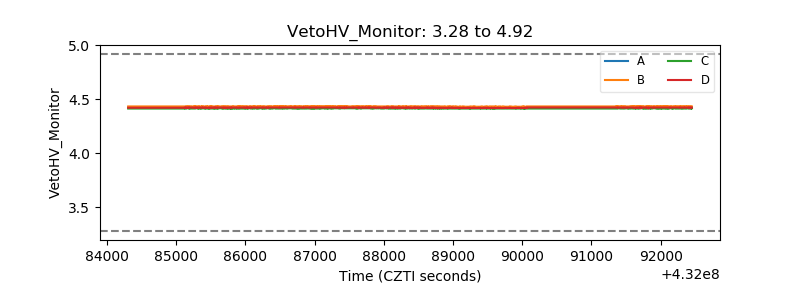 |
| Veto LLD | 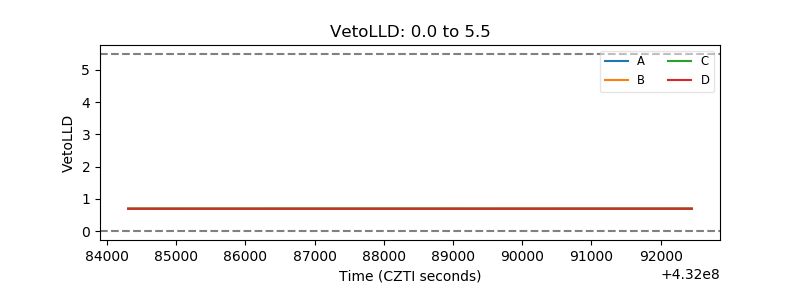 |
| Alpha Counter |  |
| _CPM_Rate | 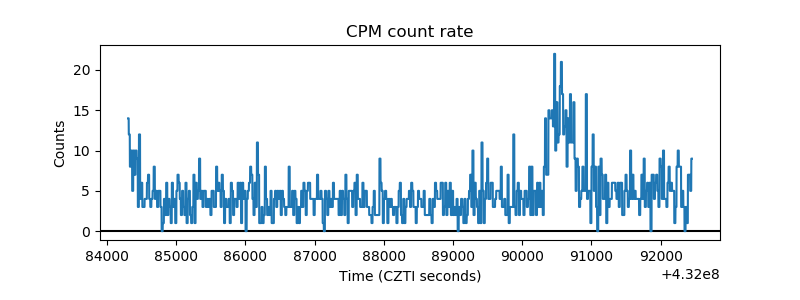 |
| CZT Counter | 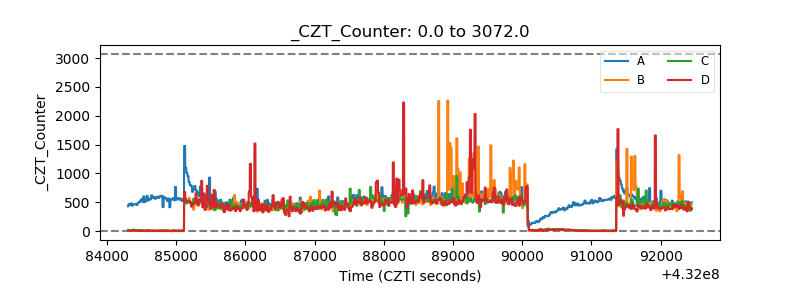 |
| +2.5 Volts monitor |  |
| +5 Volts monitor | 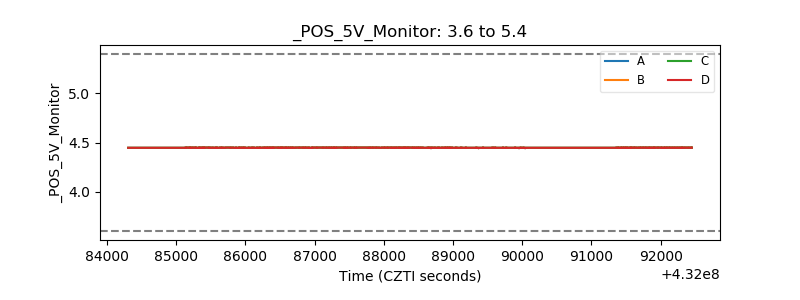 |
| _ROLL_ROT | 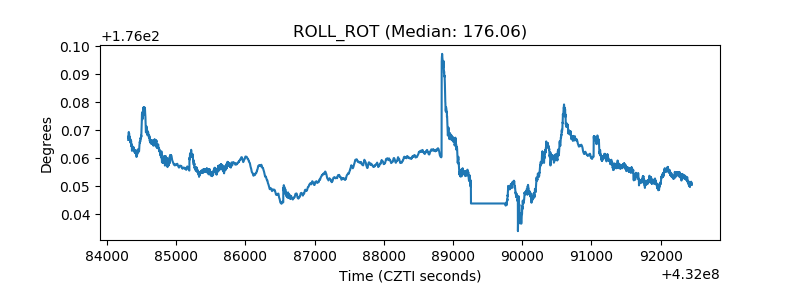 |
| _Roll_DEC | 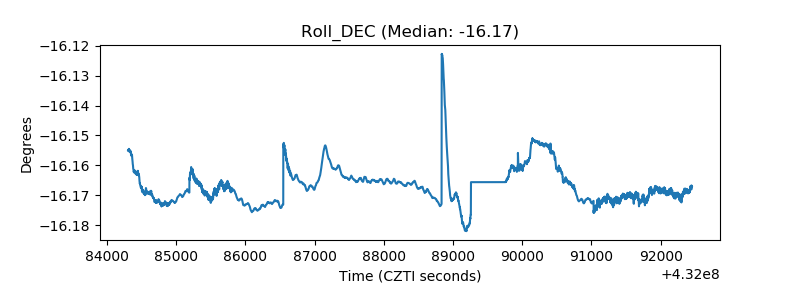 |
| _Roll_RA | 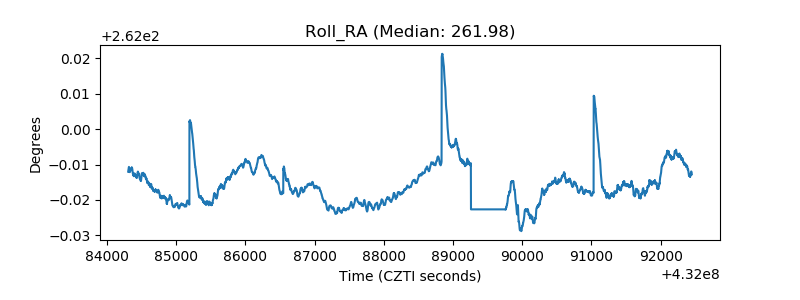 |
| Veto Counter | 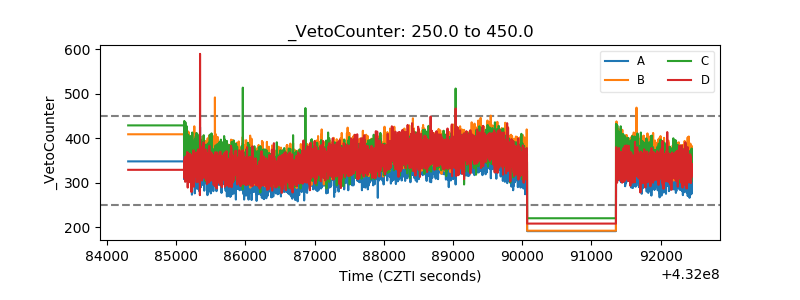 |