| Param | Original file | Final file |
|---|---|---|
| Filename | modeM0/AS1T05_148T01_9000005838_43005cztM0_level2.fits | modeM0/AS1T05_148T01_9000005838_43005cztM0_level2_quad_clean.evt |
| Size (bytes) | 362,687,040 | 115,064,640 |
| Size | 345.9 MB | 109.7 MB |
| Events in quadrant A | 3,497,273 | 806,302 |
| Events in quadrant B | 2,989,720 | 810,573 |
| Events in quadrant C | 2,986,259 | 778,786 |
| Events in quadrant D | 3,507,841 | 689,269 |
| Mode M9 | |||
|---|---|---|---|
| Quadrant | BADHDUFLAG | Total packets | Discarded packets |
| A | 0 | 30 | 0 |
| B | 0 | 30 | 0 |
| C | 0 | 30 | 0 |
| D | 0 | 30 | 0 |
| Mode SS | |||
|---|---|---|---|
| Quadrant | BADHDUFLAG | Total packets | Discarded packets |
| A | 0 | 120 | 0 |
| B | 0 | 120 | 0 |
| C | 0 | 120 | 0 |
| D | 0 | 120 | 0 |
| Mode M0 | |||
|---|---|---|---|
| Quadrant | BADHDUFLAG | Total packets | Discarded packets |
| A | 0 | 13778 | 2 |
| B | 0 | 12290 | 2 |
| C | 0 | 11888 | 2 |
| D | 0 | 14122 | 2 |
| Quadrant | Total seconds | Saturated seconds | Saturation percentage |
|---|---|---|---|
| A | 5709 | 37 | 0.648099% |
| B | 5710 | 62 | 1.085814% |
| C | 5710 | 11 | 0.192644% |
| D | 5710 | 171 | 2.994746% |
Noise dominated data is calculated using 1-second bins in cleaned event files. If a bin has >2000 counts, and if more than 50% of those come from <1% of pixels, then it is considered to be noise-dominated and hence unusable.
| Quadrant | # 1 sec bins | Bins with >0 counts | Bins with >2000 counts | High rate bins dominated by noise | Noise dominated (total time) | Noise dominated (detector-on time) | Marked lightcurve |
|---|---|---|---|---|---|---|---|
| A | 8754 | 5711 | 16 | 16 | 0.18% | 0.28% | 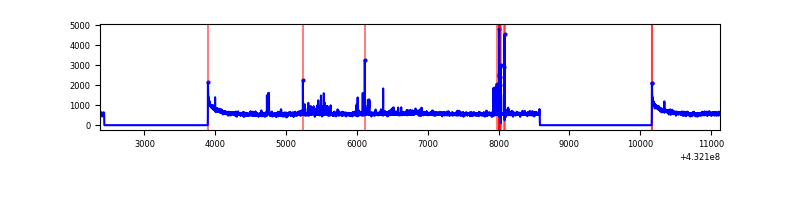 |
| B | 8755 | 5712 | 33 | 33 | 0.38% | 0.58% | 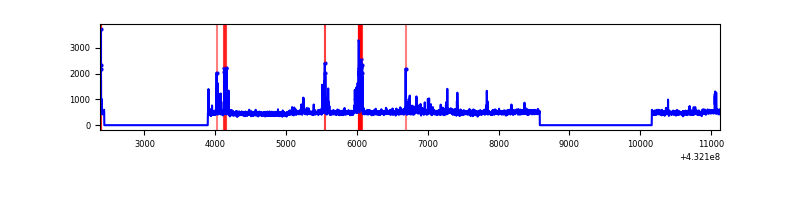 |
| C | 8755 | 5712 | 11 | 11 | 0.13% | 0.19% |  |
| D | 8755 | 5712 | 118 | 118 | 1.35% | 2.07% | 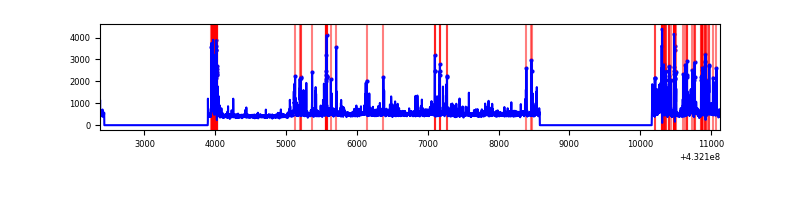 |
Top three noisy pixels from each quadrant. If the there are fewer than three noisy pixels in the level2.evt file, extra rows are filled as -1
| Pixel properties | Quadrant properties | ||||||
|---|---|---|---|---|---|---|---|
| Quadrant | DetID | PixID | Counts | Sigma | Mean | Median | Sigma |
| A | 10 | 83 | 608977 | 3970.89 | 698 | 688 | 153.2 |
| A | 15 | 237 | 98524 | 638.67 | 698 | 688 | 153.2 |
| A | 13 | 248 | 86082 | 557.45 | 698 | 688 | 153.2 |
| B | 4 | 171 | 255143 | 1754.59 | 692 | 676 | 145.0 |
| B | 12 | 111 | 15615 | 103.01 | 692 | 676 | 145.0 |
| B | 11 | 111 | 14507 | 95.37 | 692 | 676 | 145.0 |
| C | 15 | 214 | 234543 | 1370.25 | 678 | 684 | 170.7 |
| C | 0 | 239 | 67513 | 391.57 | 678 | 684 | 170.7 |
| C | 5 | 250 | 16402 | 92.1 | 678 | 684 | 170.7 |
| D | 1 | 47 | 497675 | 2848.42 | 667 | 645 | 174.5 |
| D | 13 | 249 | 214815 | 1227.38 | 667 | 645 | 174.5 |
| D | 1 | 52 | 106528 | 606.8 | 667 | 645 | 174.5 |
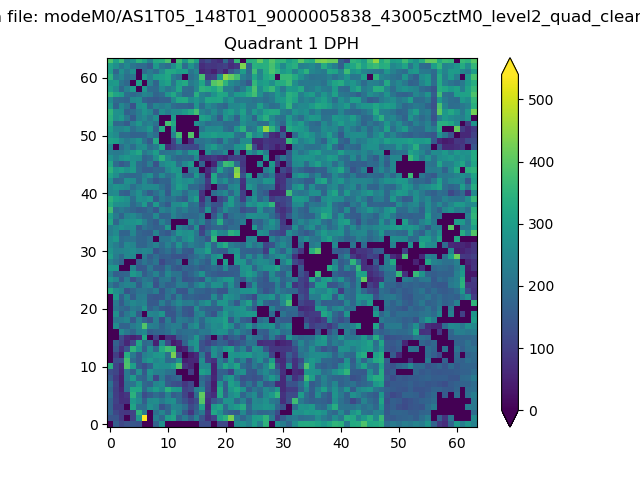
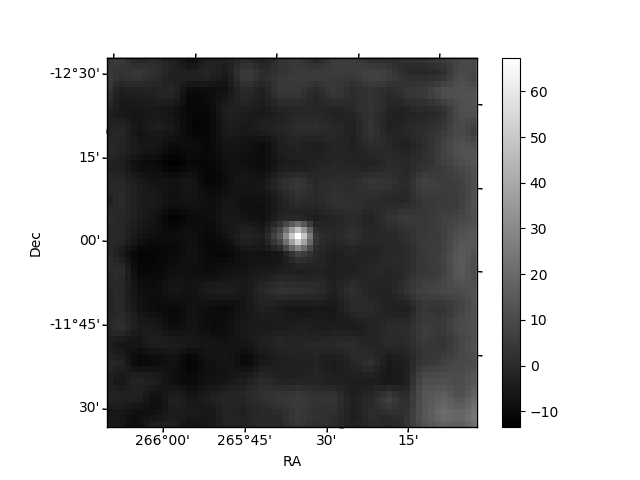
Histogram calculated using DETX and DETY for each event in the final _common_clean file
| Quadrant A | 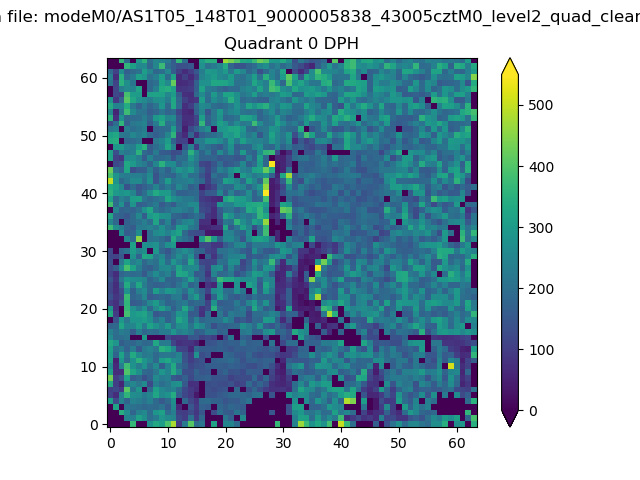 |
 |
Quadrant B |
|---|---|---|---|
| Quadrant D | 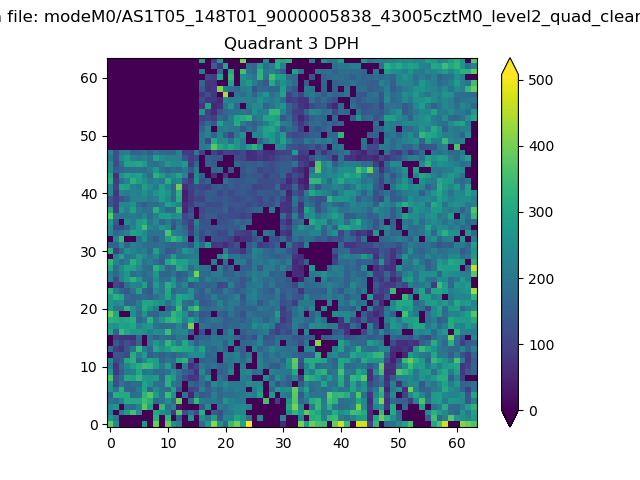 |
 |
Quadrant C |
| Plot type | Count rate plots | Images |
|---|---|---|
| Comparison with Poisson distribution Blue bars denote a histogram of data divided into 1 sec bins. Red curve is a Poisson curve with rate = median count rate of data. |
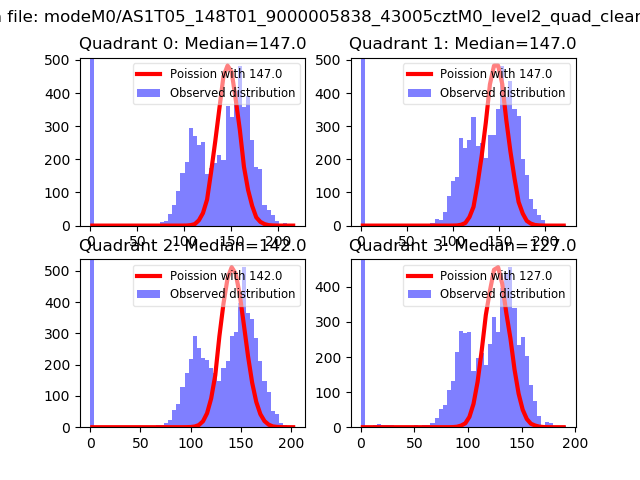 |
 |
| Quadrant-wise count rates Data is divided into 100 sec bins |
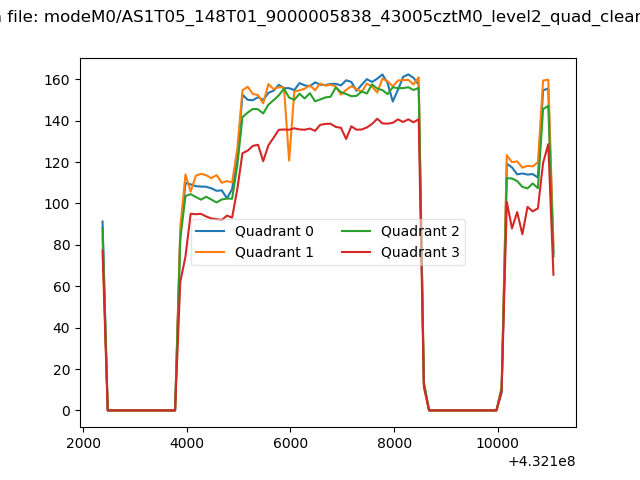 |
|
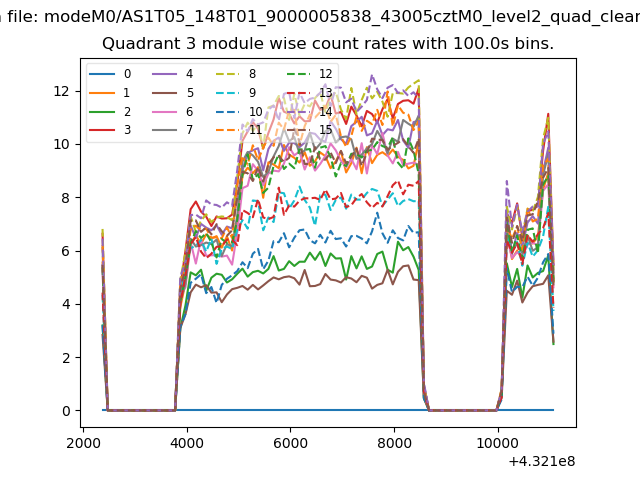
| Module-wise count rates for Quadrant A Data is divided into 100 sec bins |
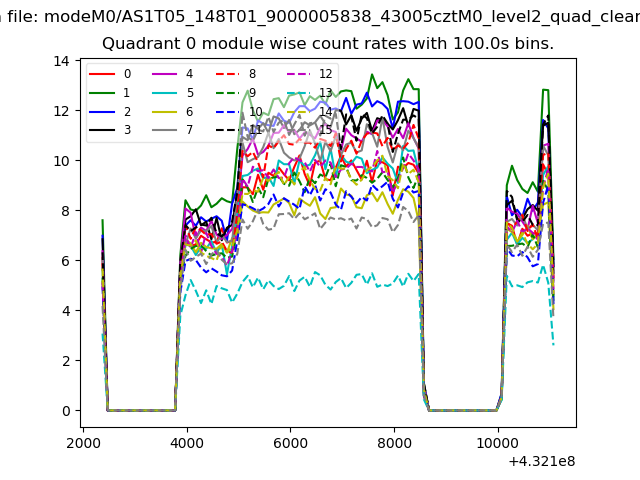 |
 |
| Module-wise count rates for Quadrant B Data is divided into 100 sec bins |
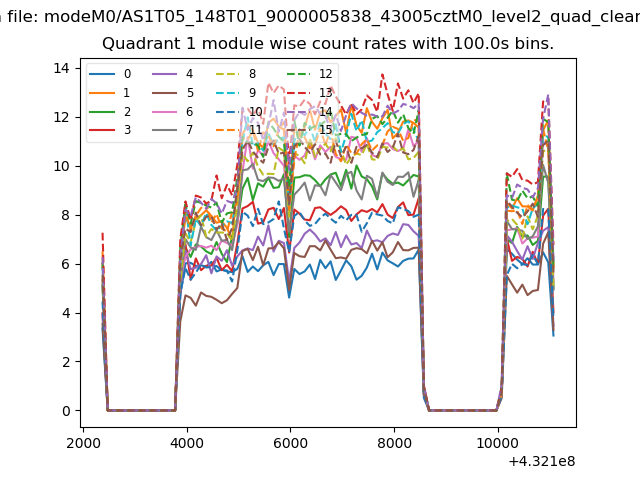 |
 |
| Module-wise count rates for Quadrant C Data is divided into 100 sec bins |
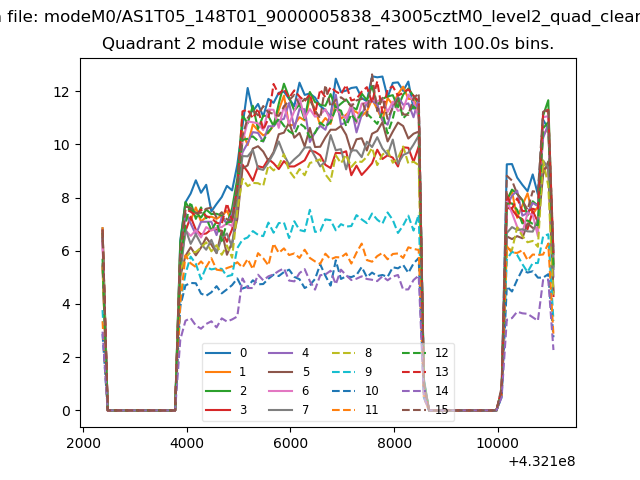 |
 |
| Module-wise count rates for Quadrant D Data is divided into 100 sec bins |
 |
 |
| Parameter | Plot |
|---|---|
| CZT HV Monitor | 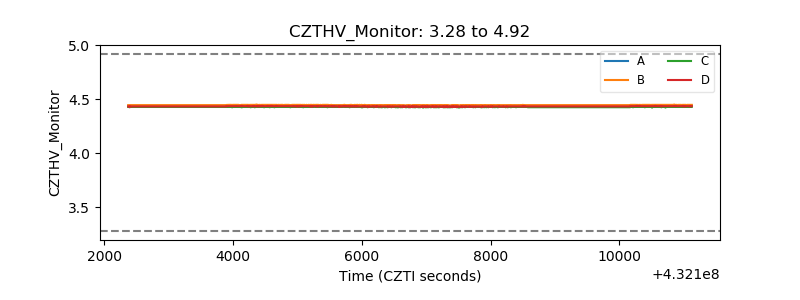 |
| D_VDD | 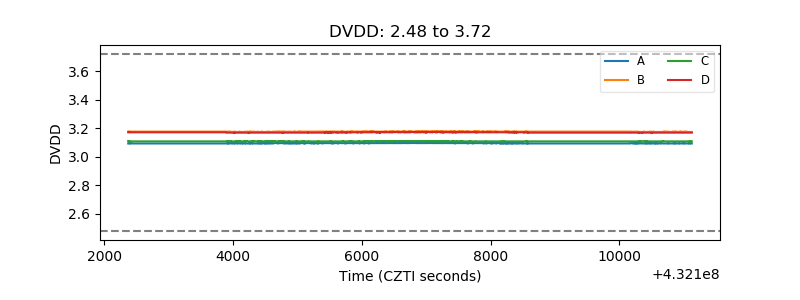 |
| Temperature 1 | 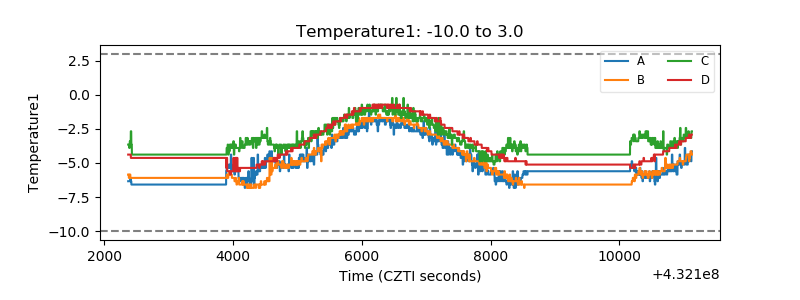 |
| Veto HV Monitor | 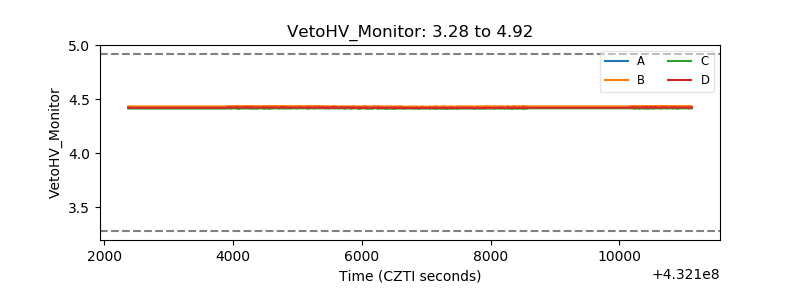 |
| Veto LLD | 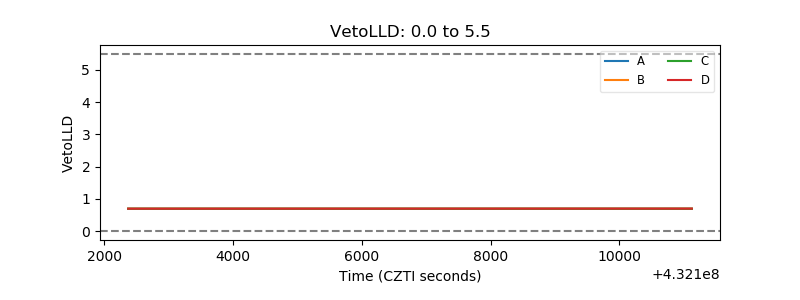 |
| Alpha Counter | 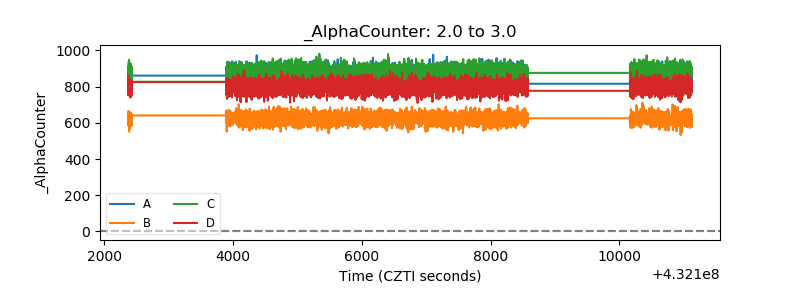 |
| _CPM_Rate | 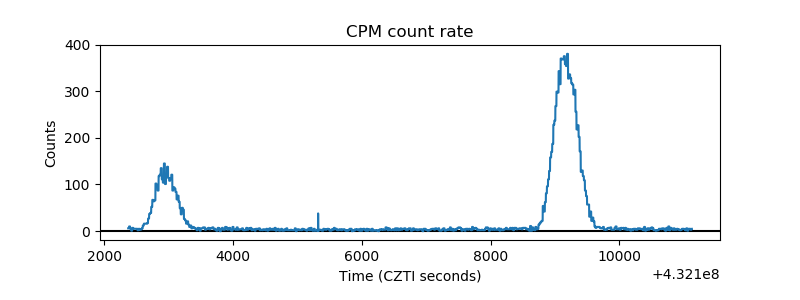 |
| CZT Counter |  |
| +2.5 Volts monitor | 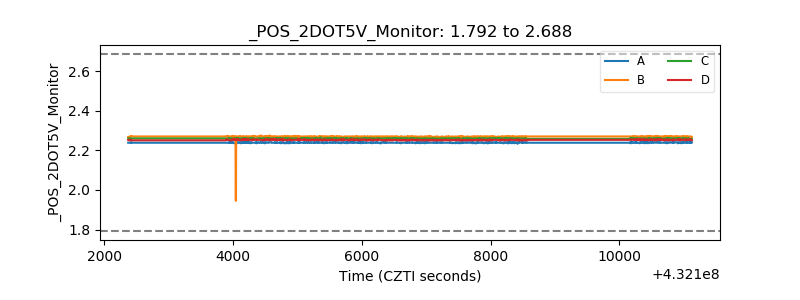 |
| +5 Volts monitor | 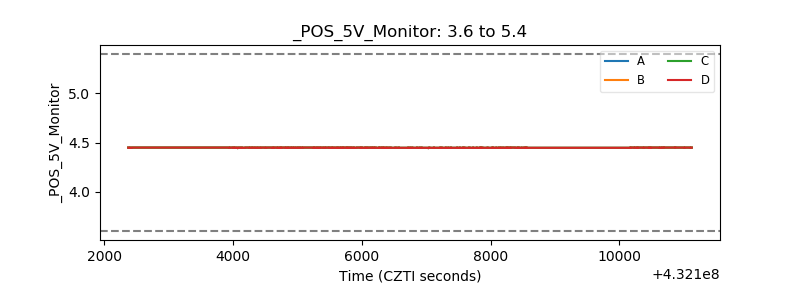 |
| _ROLL_ROT | 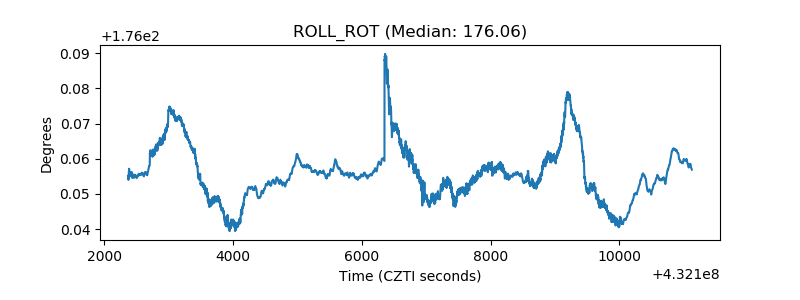 |
| _Roll_DEC | 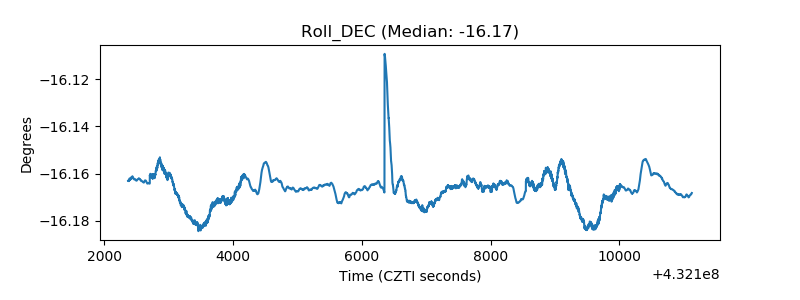 |
| _Roll_RA | 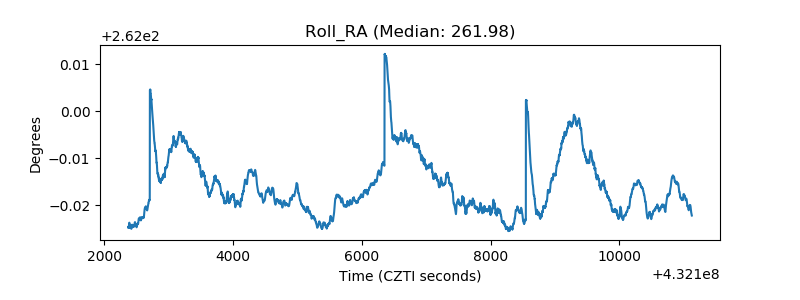 |
| Veto Counter | 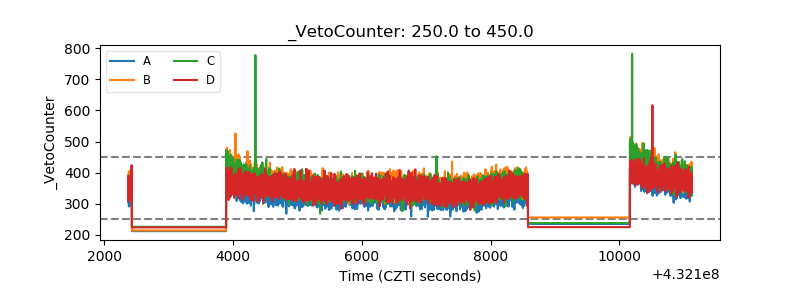 |