| Param | Original file | Final file |
|---|---|---|
| Filename | modeM0/AS1T05_148T01_9000005838_43008cztM0_level2.fits | modeM0/AS1T05_148T01_9000005838_43008cztM0_level2_quad_clean.evt |
| Size (bytes) | 368,176,320 | 116,979,840 |
| Size | 351.1 MB | 111.6 MB |
| Events in quadrant A | 3,408,418 | 827,075 |
| Events in quadrant B | 3,395,900 | 837,478 |
| Events in quadrant C | 2,935,738 | 796,973 |
| Events in quadrant D | 3,481,596 | 714,216 |
| Mode M9 | |||
|---|---|---|---|
| Quadrant | BADHDUFLAG | Total packets | Discarded packets |
| A | 0 | 31 | 0 |
| B | 0 | 32 | 0 |
| C | 0 | 32 | 0 |
| D | 0 | 32 | 0 |
| Mode SS | |||
|---|---|---|---|
| Quadrant | BADHDUFLAG | Total packets | Discarded packets |
| A | 0 | 108 | 0 |
| B | 0 | 108 | 0 |
| C | 0 | 108 | 0 |
| D | 0 | 108 | 0 |
| Mode M0 | |||
|---|---|---|---|
| Quadrant | BADHDUFLAG | Total packets | Discarded packets |
| A | 0 | 13554 | 2 |
| B | 0 | 13290 | 2 |
| C | 0 | 11803 | 2 |
| D | 0 | 13700 | 2 |
| Quadrant | Total seconds | Saturated seconds | Saturation percentage |
|---|---|---|---|
| A | 5238 | 61 | 1.164567% |
| B | 5238 | 21 | 0.400916% |
| C | 5238 | 28 | 0.534555% |
| D | 5238 | 91 | 1.737304% |
Noise dominated data is calculated using 1-second bins in cleaned event files. If a bin has >2000 counts, and if more than 50% of those come from <1% of pixels, then it is considered to be noise-dominated and hence unusable.
| Quadrant | # 1 sec bins | Bins with >0 counts | Bins with >2000 counts | High rate bins dominated by noise | Noise dominated (total time) | Noise dominated (detector-on time) | Marked lightcurve |
|---|---|---|---|---|---|---|---|
| A | 7092 | 5240 | 42 | 42 | 0.59% | 0.80% | 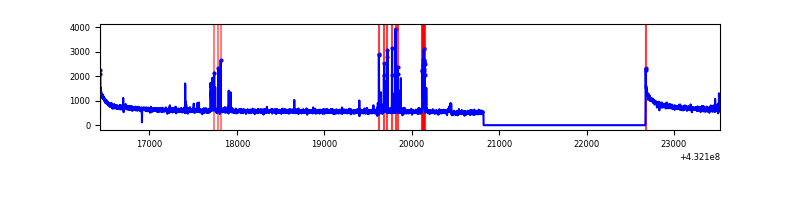 |
| B | 7092 | 5240 | 6 | 6 | 0.08% | 0.11% | 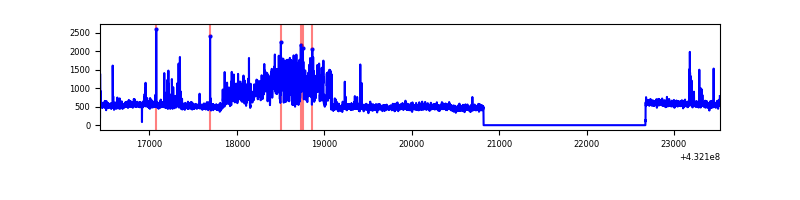 |
| C | 7092 | 5240 | 20 | 20 | 0.28% | 0.38% | 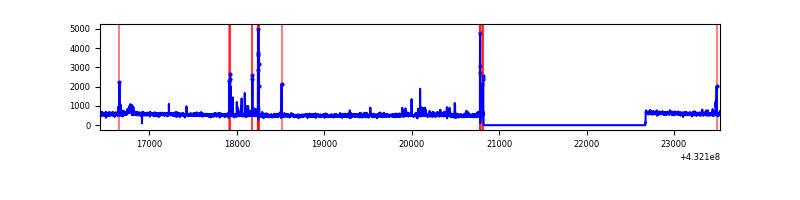 |
| D | 7092 | 5240 | 82 | 82 | 1.16% | 1.56% | 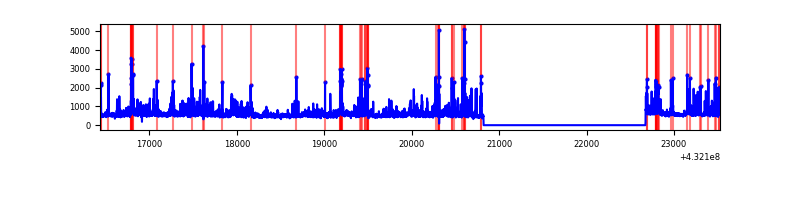 |
Top three noisy pixels from each quadrant. If the there are fewer than three noisy pixels in the level2.evt file, extra rows are filled as -1
| Pixel properties | Quadrant properties | ||||||
|---|---|---|---|---|---|---|---|
| Quadrant | DetID | PixID | Counts | Sigma | Mean | Median | Sigma |
| A | 10 | 83 | 583306 | 3859.91 | 682 | 671 | 150.9 |
| A | 15 | 237 | 148094 | 976.66 | 682 | 671 | 150.9 |
| A | 13 | 248 | 37986 | 247.21 | 682 | 671 | 150.9 |
| B | 0 | 186 | 627844 | 4378.55 | 673 | 658 | 143.2 |
| B | 4 | 171 | 99354 | 689.02 | 673 | 658 | 143.2 |
| B | 12 | 111 | 14703 | 98.05 | 673 | 658 | 143.2 |
| C | 15 | 214 | 217124 | 1288.67 | 657 | 663 | 168.0 |
| C | 0 | 239 | 97976 | 579.34 | 657 | 663 | 168.0 |
| C | 12 | 249 | 45528 | 267.1 | 657 | 663 | 168.0 |
| D | 1 | 52 | 518804 | 2994.58 | 654 | 634 | 173.0 |
| D | 1 | 47 | 158813 | 914.14 | 654 | 634 | 173.0 |
| D | 13 | 249 | 125171 | 719.72 | 654 | 634 | 173.0 |
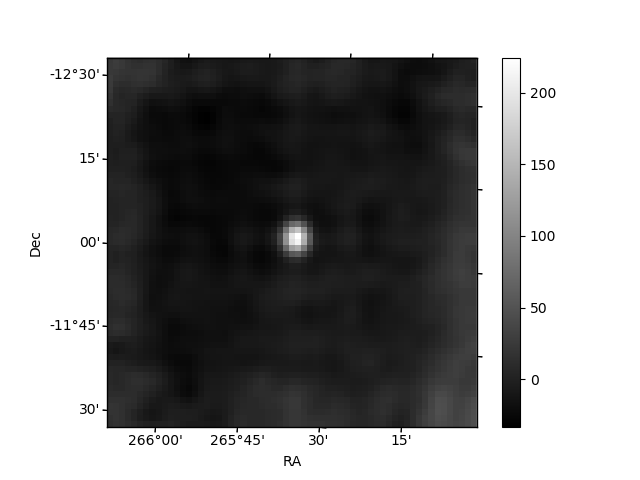
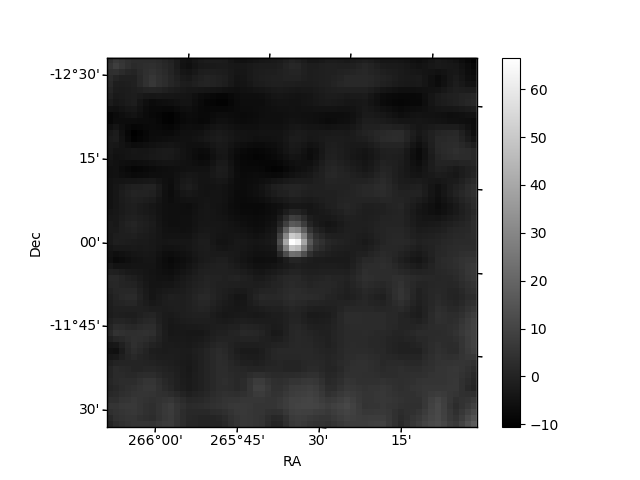
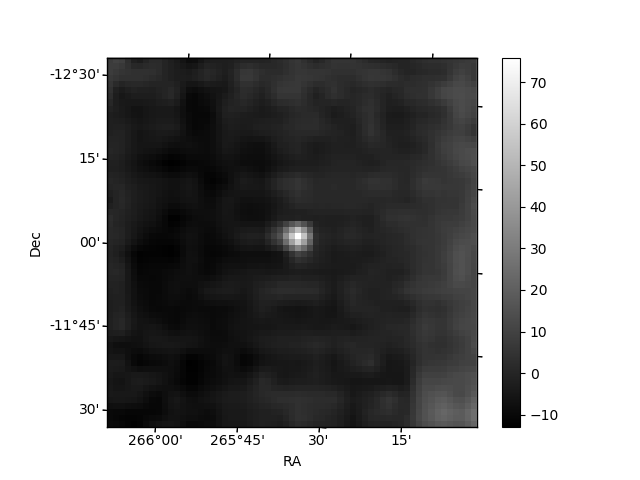
Histogram calculated using DETX and DETY for each event in the final _common_clean file
| Quadrant A | 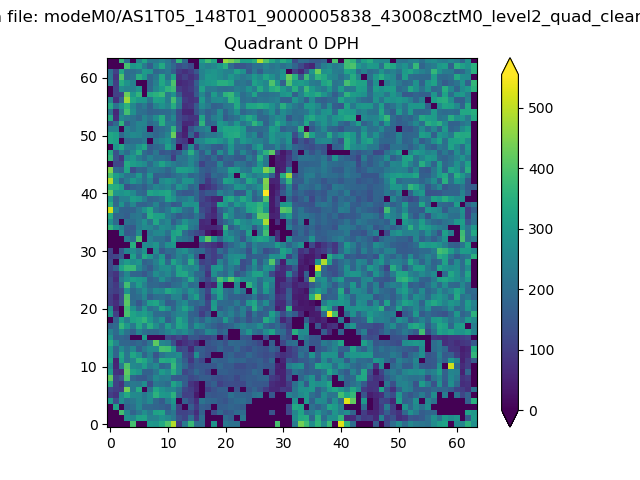 |
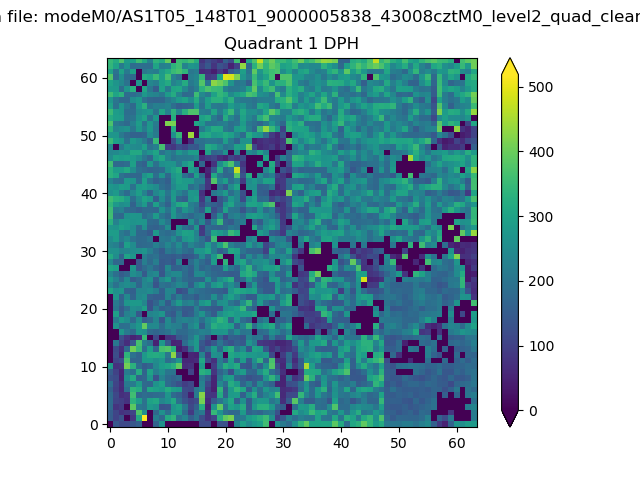 |
Quadrant B |
|---|---|---|---|
| Quadrant D | 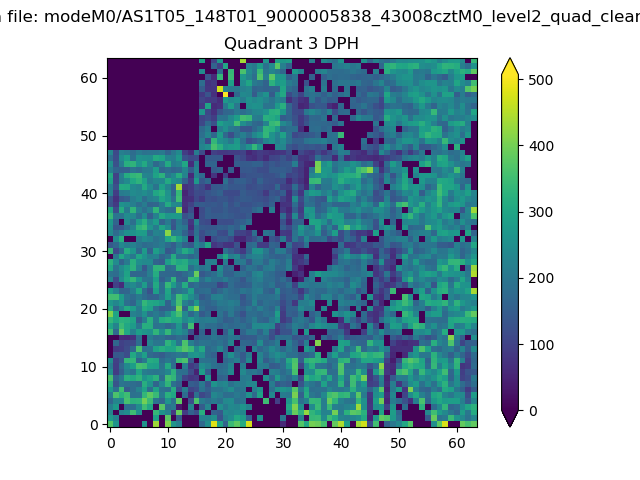 |
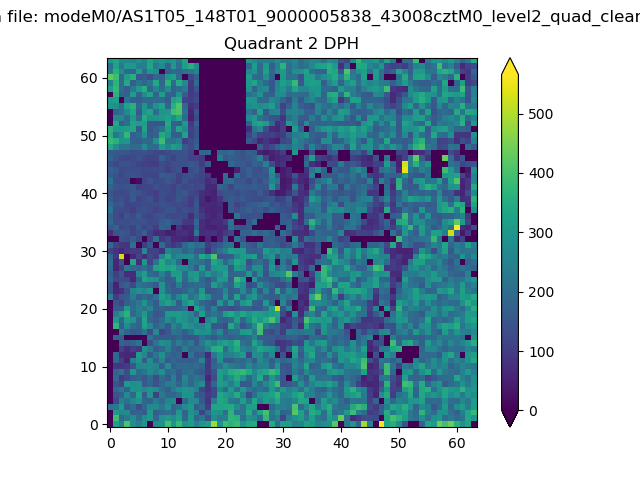 |
Quadrant C |
| Plot type | Count rate plots | Images |
|---|---|---|
| Comparison with Poisson distribution Blue bars denote a histogram of data divided into 1 sec bins. Red curve is a Poisson curve with rate = median count rate of data. |
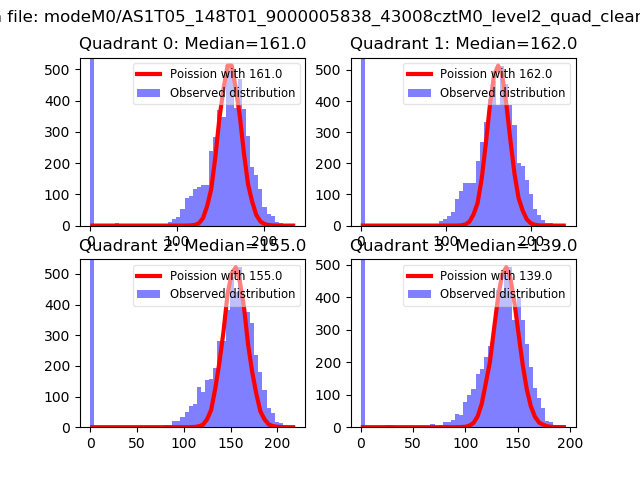 |
 |
| Quadrant-wise count rates Data is divided into 100 sec bins |
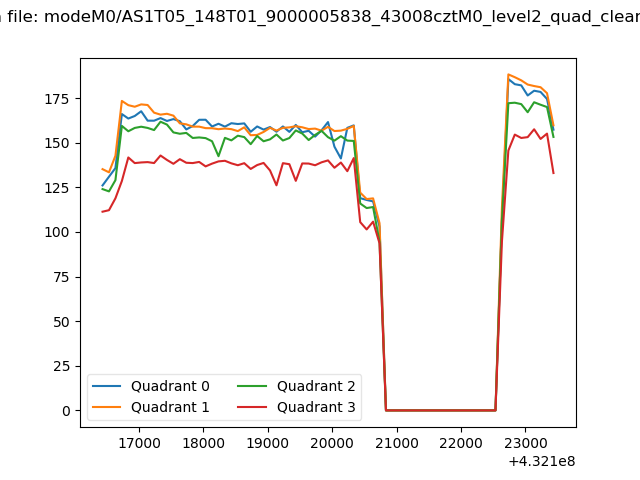 |
|
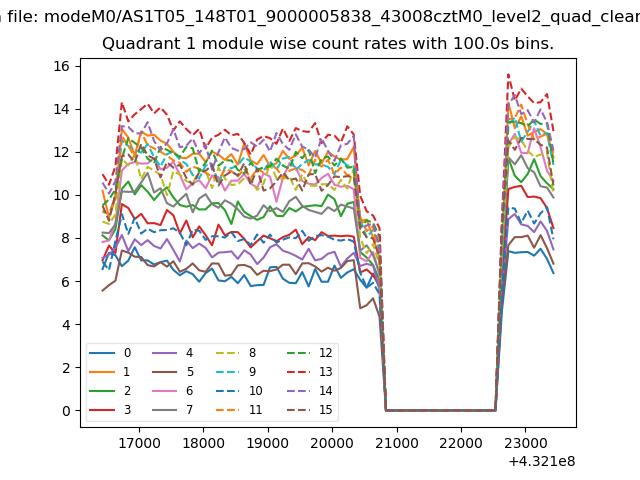
| Module-wise count rates for Quadrant A Data is divided into 100 sec bins |
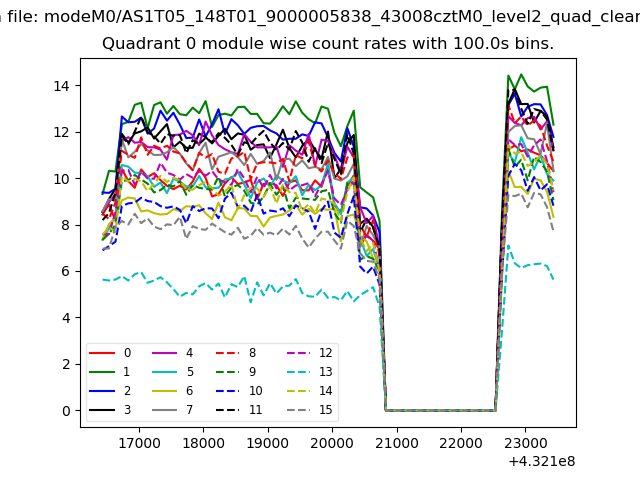 |
 |
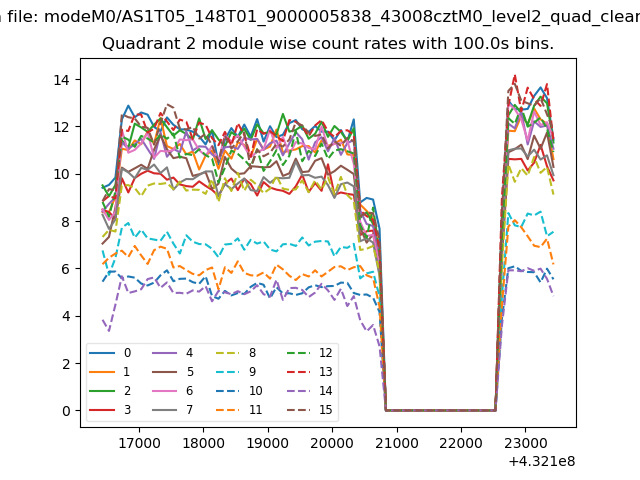
| Module-wise count rates for Quadrant B Data is divided into 100 sec bins |
 |
 |
| Module-wise count rates for Quadrant C Data is divided into 100 sec bins |
 |
 |
| Module-wise count rates for Quadrant D Data is divided into 100 sec bins |
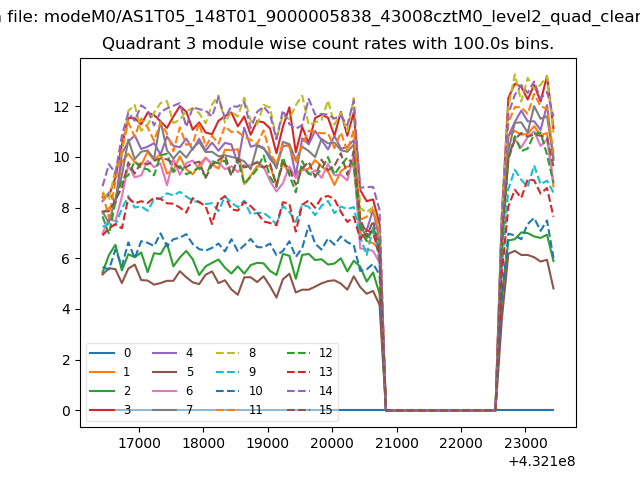 |
 |
| Parameter | Plot |
|---|---|
| CZT HV Monitor | 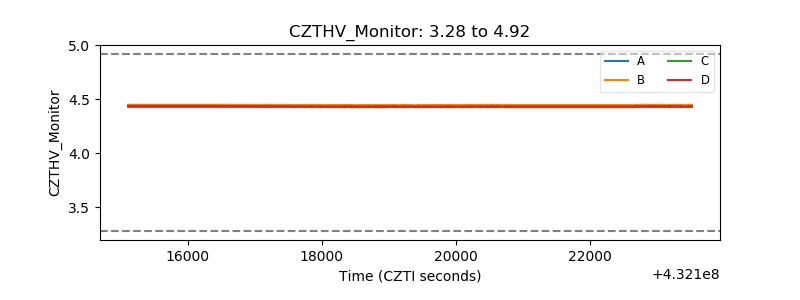 |
| D_VDD | 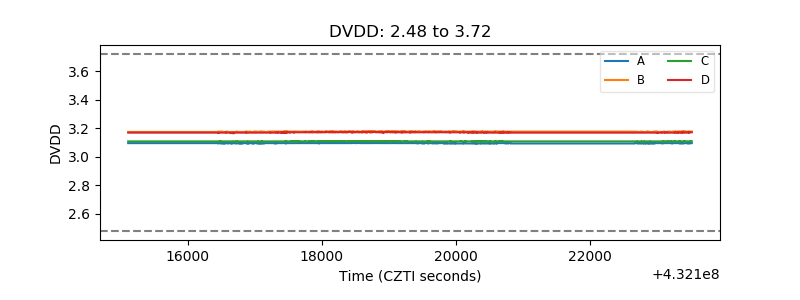 |
| Temperature 1 | 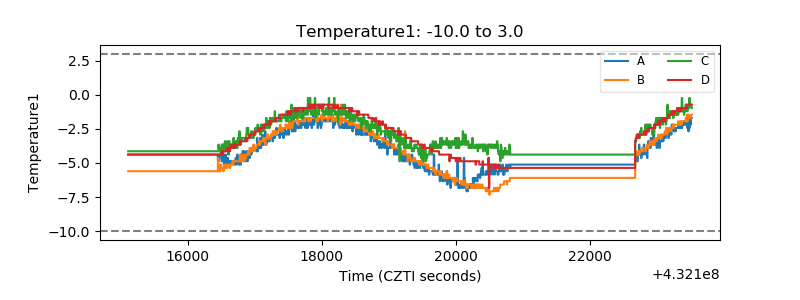 |
| Veto HV Monitor | 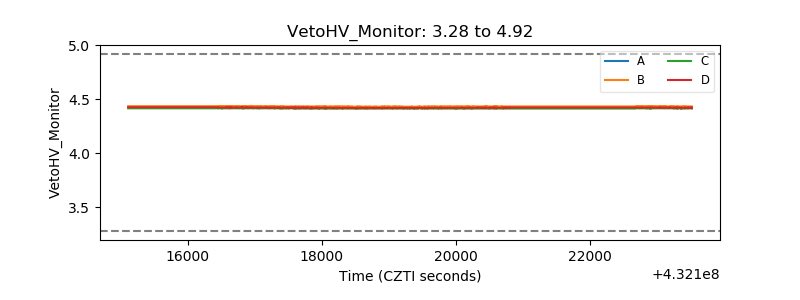 |
| Veto LLD | 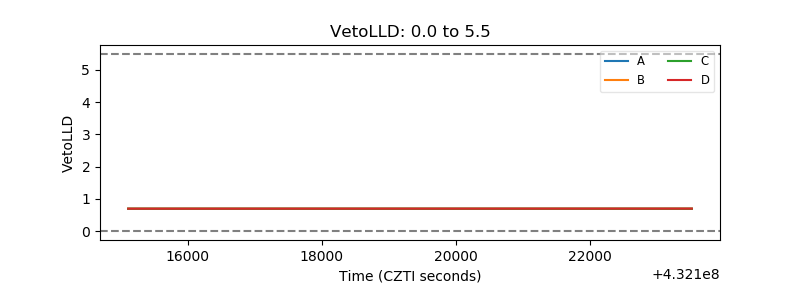 |
| Alpha Counter | 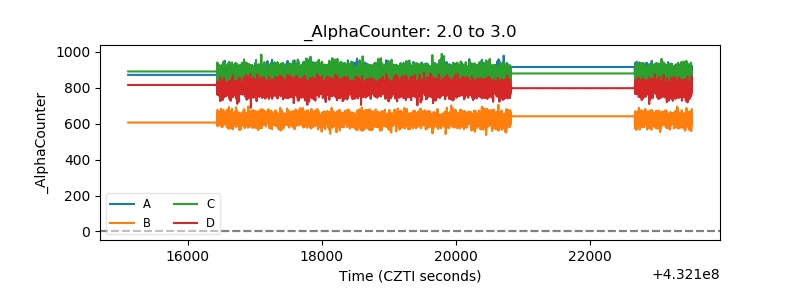 |
| _CPM_Rate | 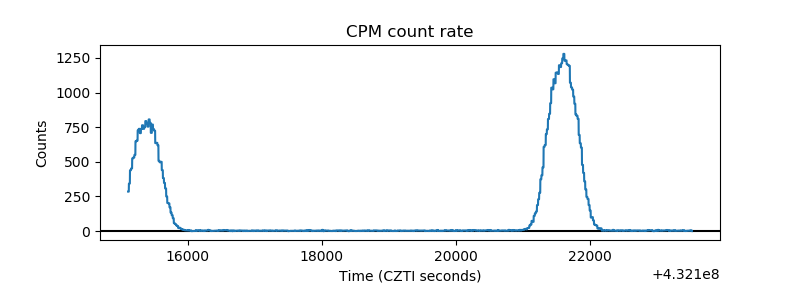 |
| CZT Counter | 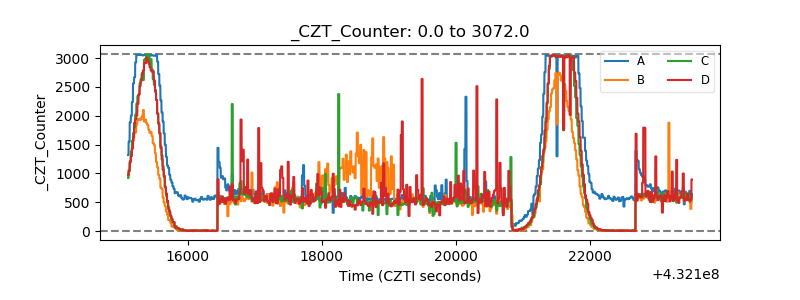 |
| +2.5 Volts monitor |  |
| +5 Volts monitor | 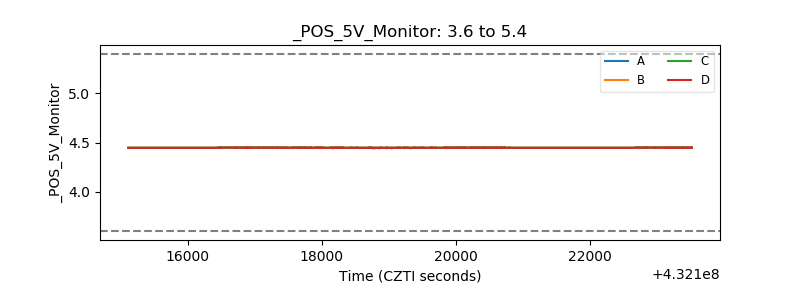 |
| _ROLL_ROT | 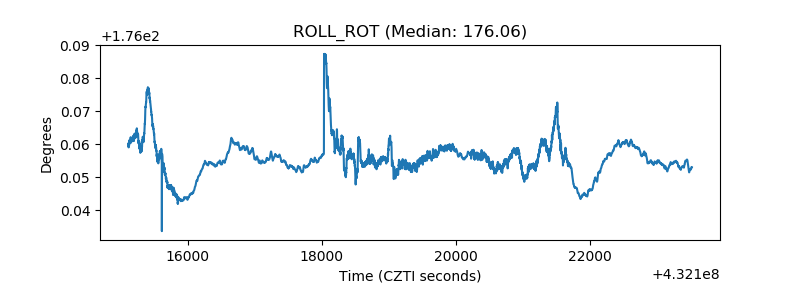 |
| _Roll_DEC | 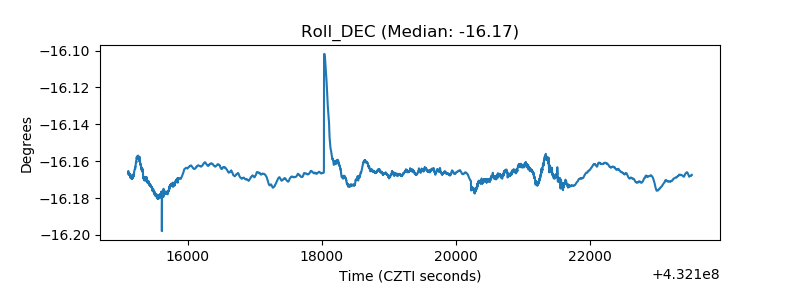 |
| _Roll_RA | 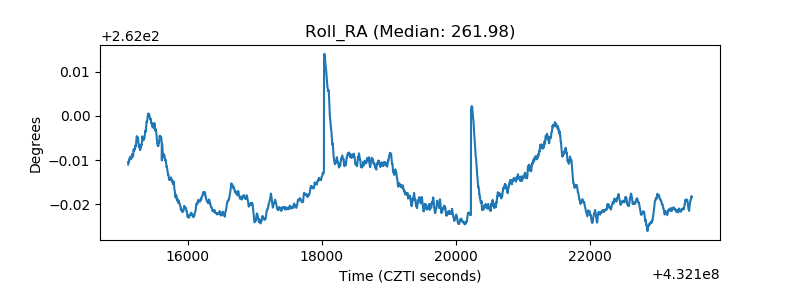 |
| Veto Counter | 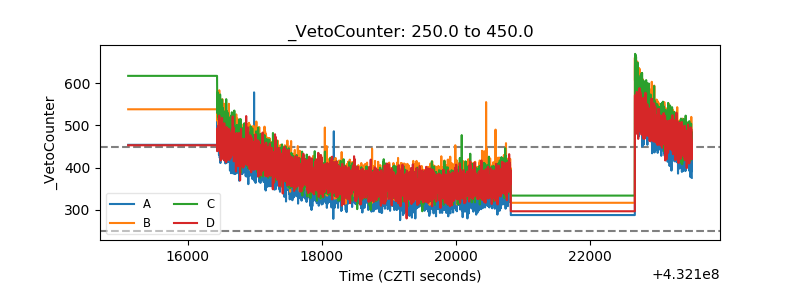 |