| Param | Original file | Final file |
|---|---|---|
| Filename | modeM0/AS1T05_148T01_9000005838_43009cztM0_level2.fits | modeM0/AS1T05_148T01_9000005838_43009cztM0_level2_quad_clean.evt |
| Size (bytes) | 392,466,240 | 117,048,960 |
| Size | 374.3 MB | 111.6 MB |
| Events in quadrant A | 3,324,464 | 839,611 |
| Events in quadrant B | 4,018,110 | 836,880 |
| Events in quadrant C | 2,776,849 | 804,392 |
| Events in quadrant D | 4,012,351 | 706,574 |
| Mode M9 | |||
|---|---|---|---|
| Quadrant | BADHDUFLAG | Total packets | Discarded packets |
| A | 0 | 22 | 0 |
| B | 0 | 23 | 0 |
| C | 0 | 23 | 0 |
| D | 0 | 23 | 0 |
| Mode SS | |||
|---|---|---|---|
| Quadrant | BADHDUFLAG | Total packets | Discarded packets |
| A | 0 | 104 | 0 |
| B | 0 | 104 | 0 |
| C | 0 | 104 | 0 |
| D | 0 | 104 | 0 |
| Mode M0 | |||
|---|---|---|---|
| Quadrant | BADHDUFLAG | Total packets | Discarded packets |
| A | 0 | 13208 | 2 |
| B | 0 | 15356 | 2 |
| C | 0 | 11369 | 2 |
| D | 0 | 15343 | 3 |
| Quadrant | Total seconds | Saturated seconds | Saturation percentage |
|---|---|---|---|
| A | 5102 | 57 | 1.117209% |
| B | 5102 | 83 | 1.626813% |
| C | 5102 | 5 | 0.098001% |
| D | 5101 | 232 | 4.548128% |
Noise dominated data is calculated using 1-second bins in cleaned event files. If a bin has >2000 counts, and if more than 50% of those come from <1% of pixels, then it is considered to be noise-dominated and hence unusable.
| Quadrant | # 1 sec bins | Bins with >0 counts | Bins with >2000 counts | High rate bins dominated by noise | Noise dominated (total time) | Noise dominated (detector-on time) | Marked lightcurve |
|---|---|---|---|---|---|---|---|
| A | 7075 | 5103 | 25 | 25 | 0.35% | 0.49% | 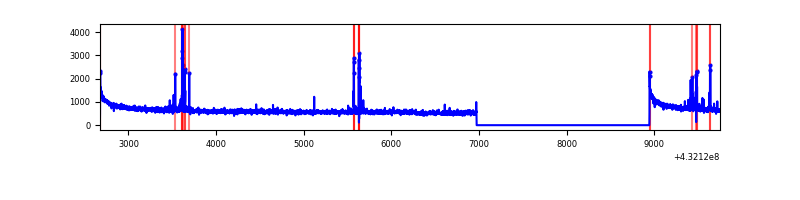 |
| B | 7075 | 5103 | 53 | 53 | 0.75% | 1.04% | 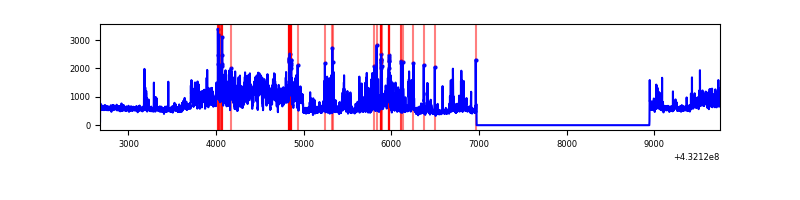 |
| C | 7075 | 5103 | 2 | 2 | 0.03% | 0.04% | 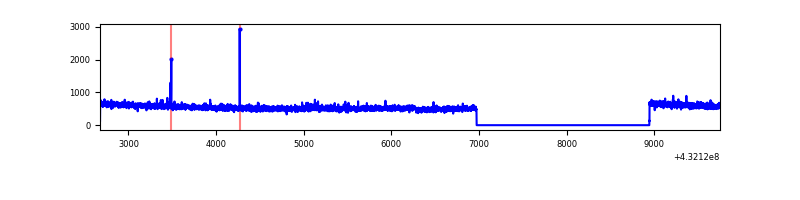 |
| D | 7074 | 5102 | 237 | 237 | 3.35% | 4.65% | 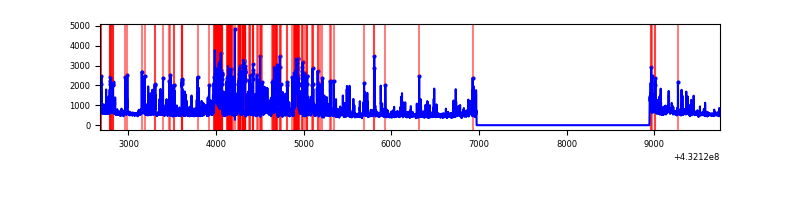 |
Top three noisy pixels from each quadrant. If the there are fewer than three noisy pixels in the level2.evt file, extra rows are filled as -1
| Pixel properties | Quadrant properties | ||||||
|---|---|---|---|---|---|---|---|
| Quadrant | DetID | PixID | Counts | Sigma | Mean | Median | Sigma |
| A | 10 | 83 | 579580 | 3833.36 | 681 | 670 | 151.0 |
| A | 15 | 237 | 104214 | 685.64 | 681 | 670 | 151.0 |
| A | 13 | 254 | 8268 | 50.31 | 681 | 670 | 151.0 |
| B | 0 | 186 | 770490 | 5480.79 | 666 | 655 | 140.5 |
| B | 4 | 171 | 478611 | 3402.77 | 666 | 655 | 140.5 |
| B | 4 | 81 | 68443 | 482.61 | 666 | 655 | 140.5 |
| C | 15 | 214 | 210752 | 1269.16 | 651 | 658 | 165.5 |
| C | 0 | 239 | 13022 | 74.69 | 651 | 658 | 165.5 |
| C | 12 | 249 | 8957 | 50.13 | 651 | 658 | 165.5 |
| D | 1 | 52 | 1059654 | 6169.89 | 647 | 627 | 171.6 |
| D | 1 | 47 | 142170 | 824.63 | 647 | 627 | 171.6 |
| D | 13 | 249 | 125664 | 728.46 | 647 | 627 | 171.6 |
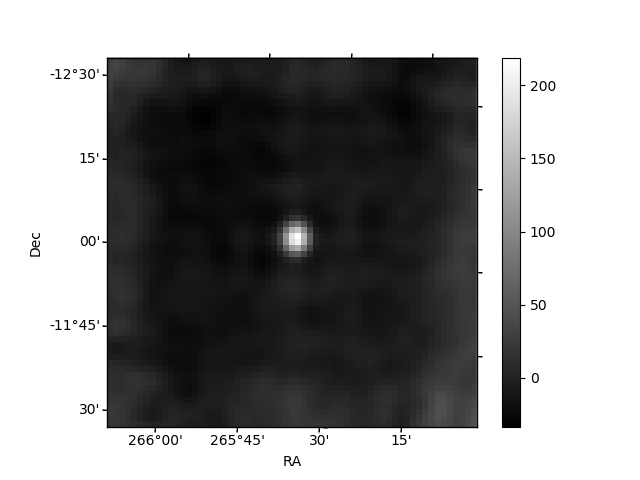
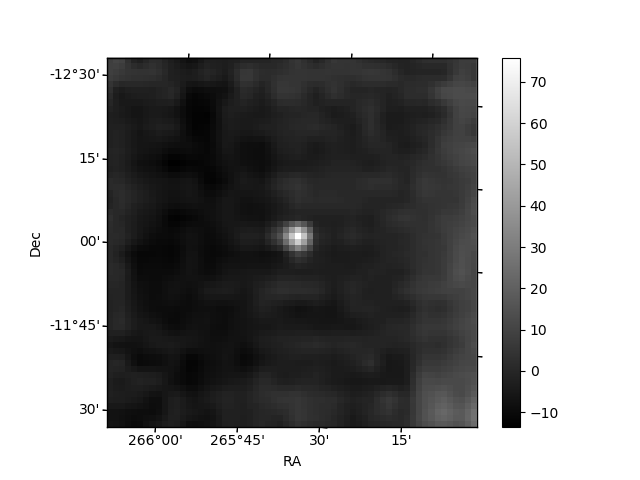
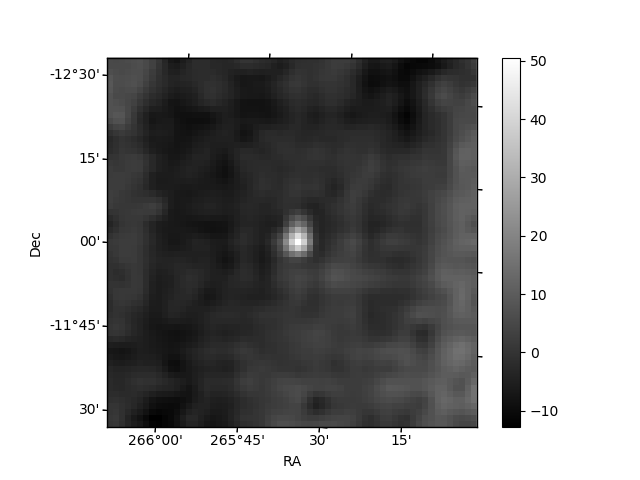
Histogram calculated using DETX and DETY for each event in the final _common_clean file
| Quadrant A | 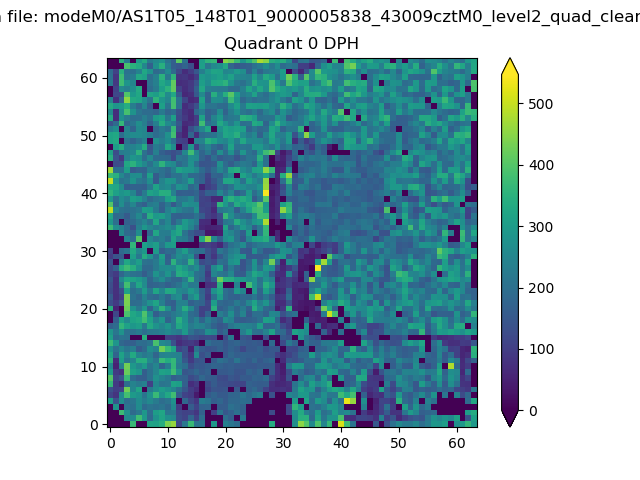 |
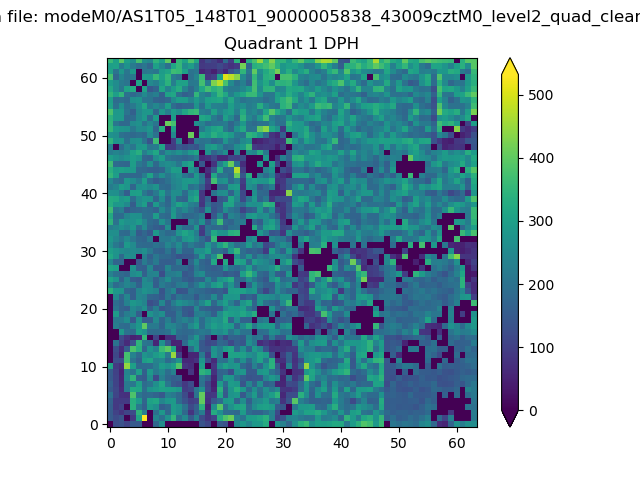 |
Quadrant B |
|---|---|---|---|
| Quadrant D | 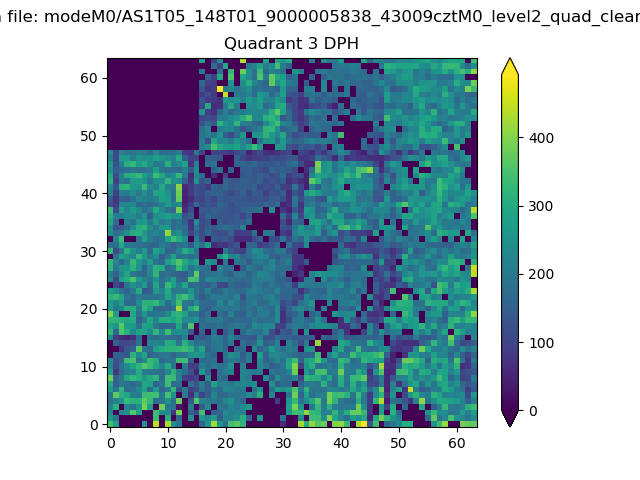 |
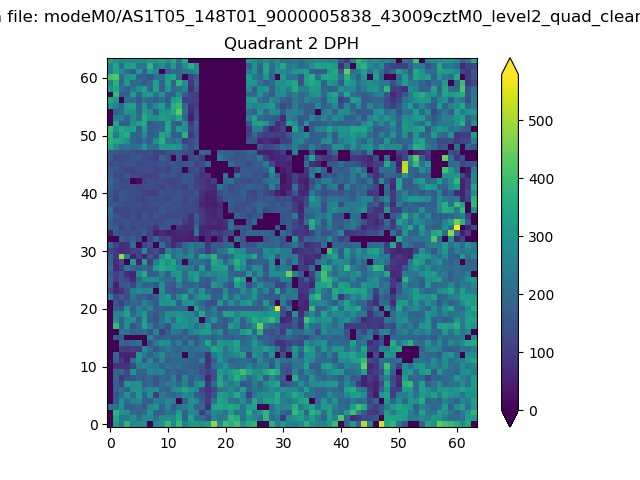 |
Quadrant C |
| Plot type | Count rate plots | Images |
|---|---|---|
| Comparison with Poisson distribution Blue bars denote a histogram of data divided into 1 sec bins. Red curve is a Poisson curve with rate = median count rate of data. |
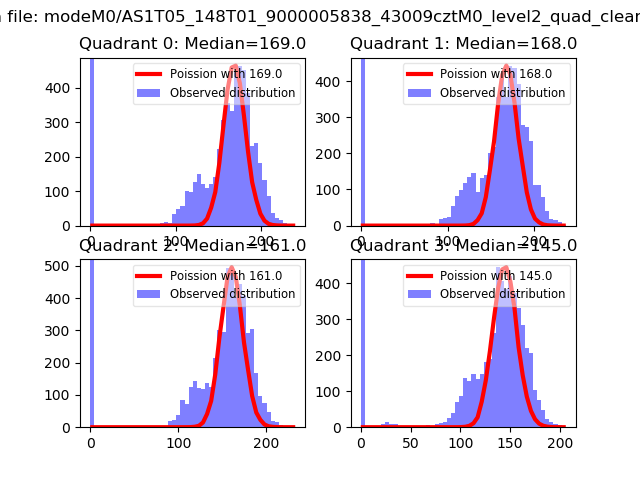 |
 |
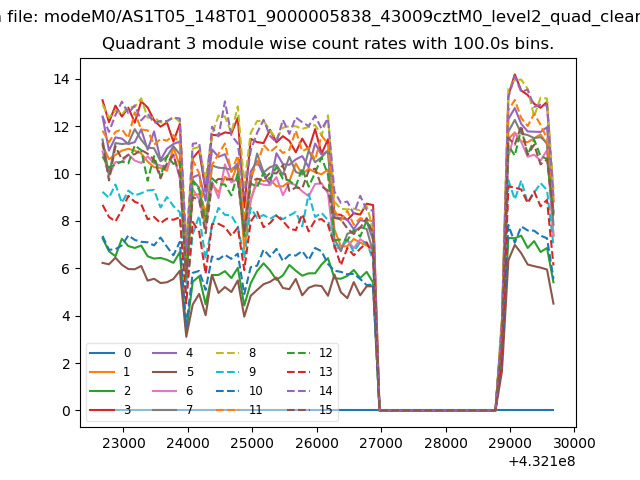
| Quadrant-wise count rates Data is divided into 100 sec bins |
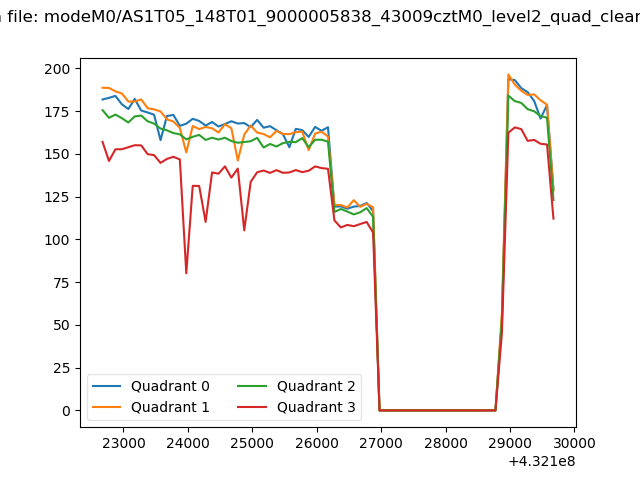 |
|
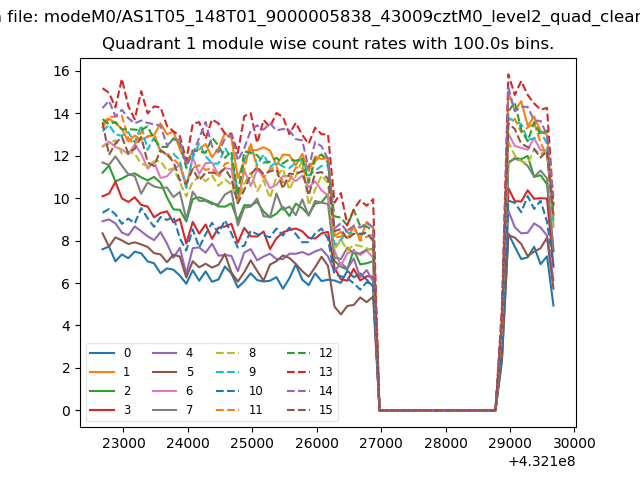
| Module-wise count rates for Quadrant A Data is divided into 100 sec bins |
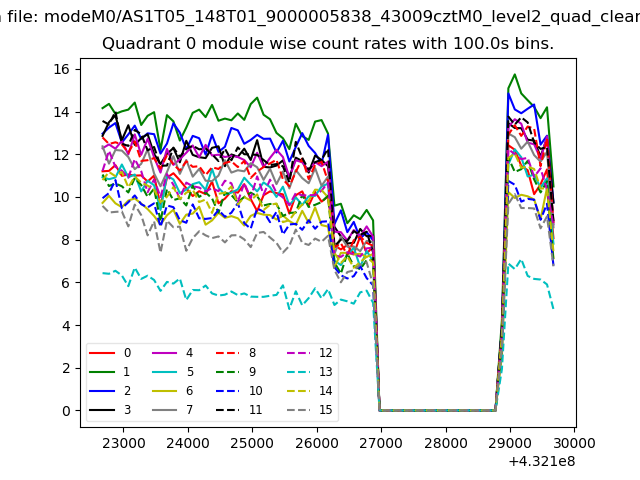 |
 |
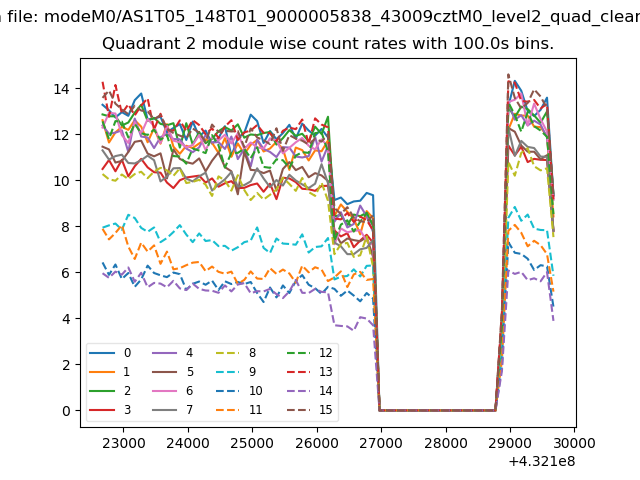
| Module-wise count rates for Quadrant B Data is divided into 100 sec bins |
 |
 |
| Module-wise count rates for Quadrant C Data is divided into 100 sec bins |
 |
 |
| Module-wise count rates for Quadrant D Data is divided into 100 sec bins |
 |
 |
| Parameter | Plot |
|---|---|
| CZT HV Monitor | 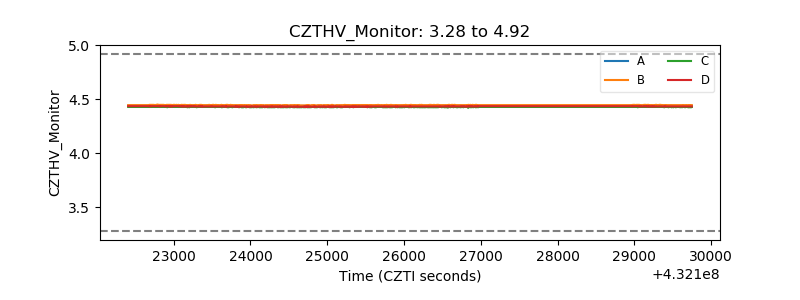 |
| D_VDD | 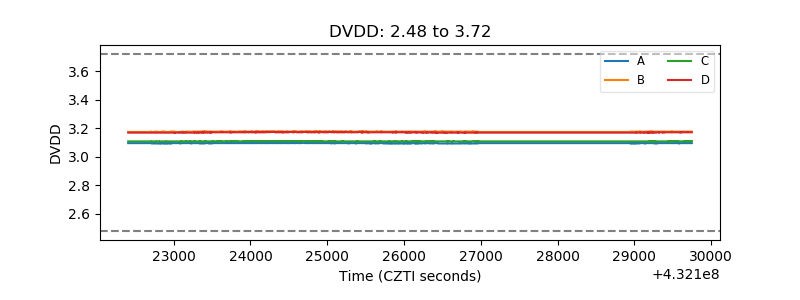 |
| Temperature 1 | 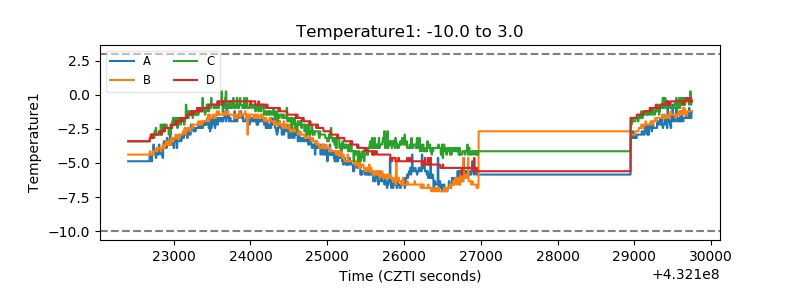 |
| Veto HV Monitor | 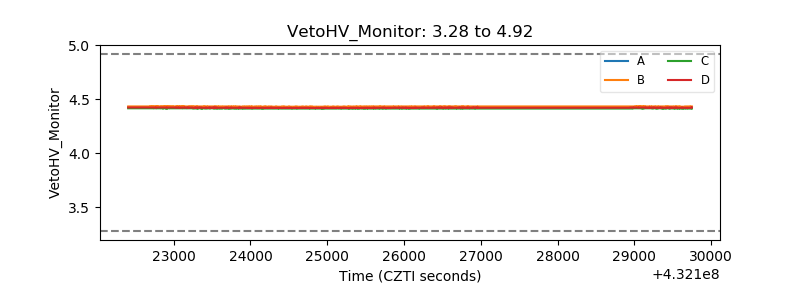 |
| Veto LLD | 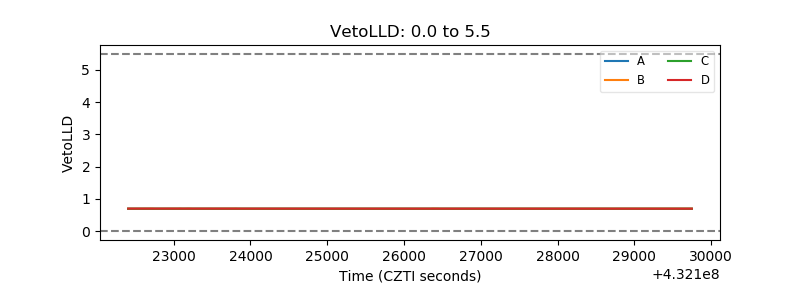 |
| Alpha Counter | 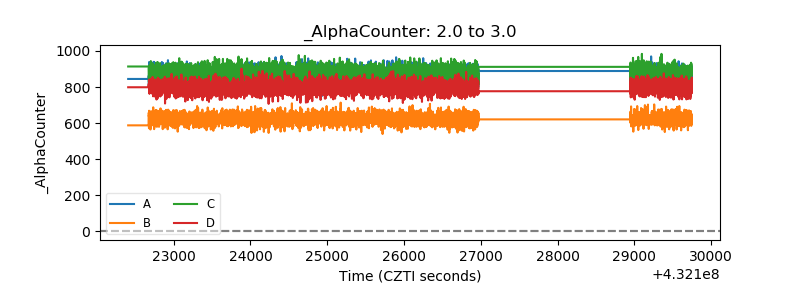 |
| _CPM_Rate | 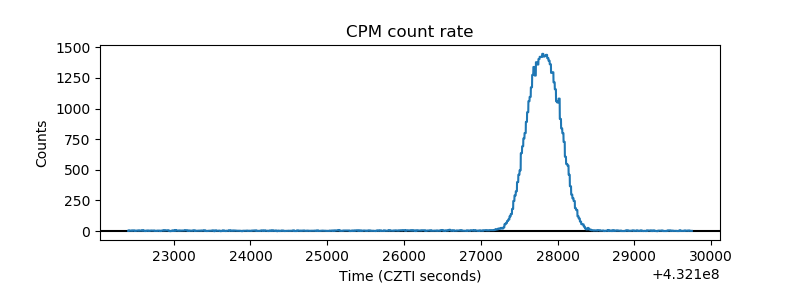 |
| CZT Counter |  |
| +2.5 Volts monitor | 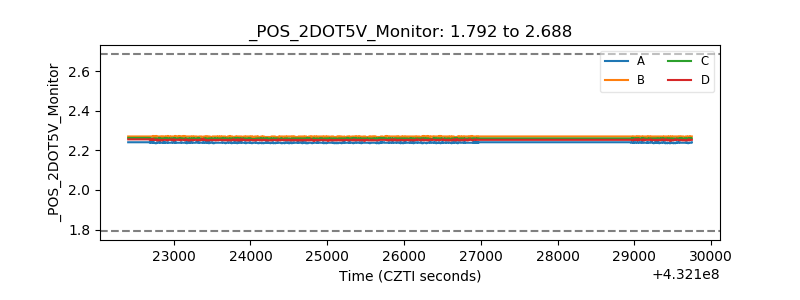 |
| +5 Volts monitor | 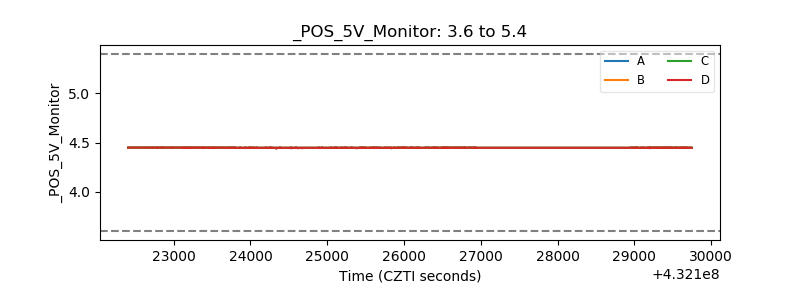 |
| _ROLL_ROT | 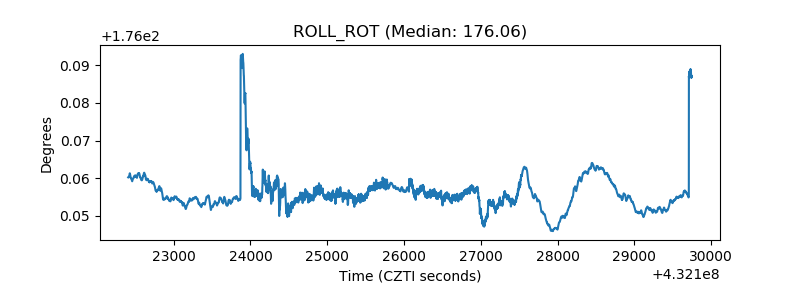 |
| _Roll_DEC | 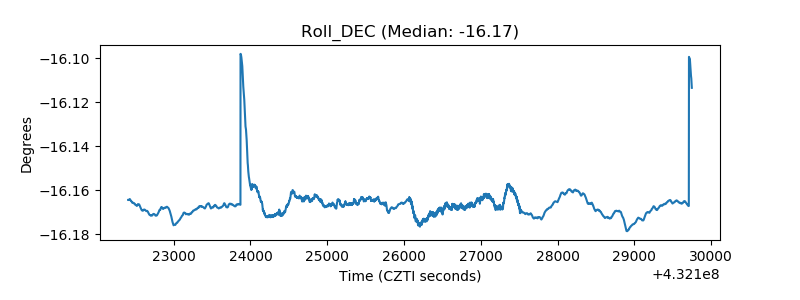 |
| _Roll_RA | 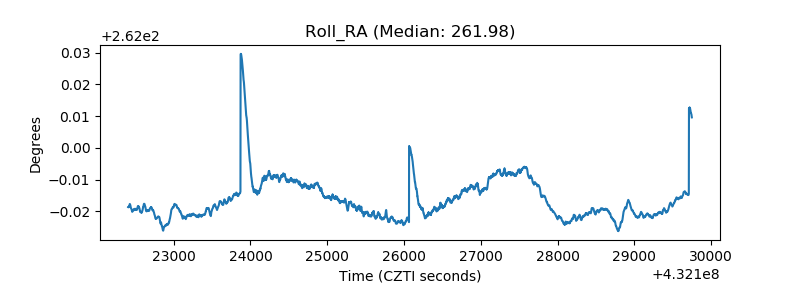 |
| Veto Counter | 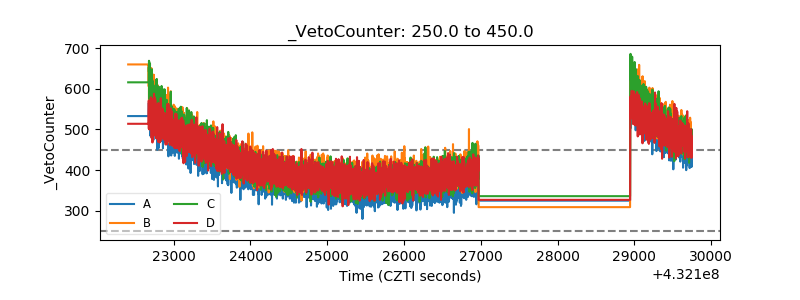 |