| Param | Original file | Final file |
|---|---|---|
| Filename | modeM0/AS1T05_148T01_9000005838_43010cztM0_level2.fits | modeM0/AS1T05_148T01_9000005838_43010cztM0_level2_quad_clean.evt |
| Size (bytes) | 384,531,840 | 115,202,880 |
| Size | 366.7 MB | 109.9 MB |
| Events in quadrant A | 3,299,034 | 829,708 |
| Events in quadrant B | 4,366,731 | 796,325 |
| Events in quadrant C | 2,741,817 | 794,109 |
| Events in quadrant D | 3,430,546 | 712,217 |
| Mode M9 | |||
|---|---|---|---|
| Quadrant | BADHDUFLAG | Total packets | Discarded packets |
| A | 0 | 21 | 0 |
| B | 0 | 21 | 0 |
| C | 0 | 21 | 0 |
| D | 0 | 21 | 0 |
| Mode SS | |||
|---|---|---|---|
| Quadrant | BADHDUFLAG | Total packets | Discarded packets |
| A | 0 | 102 | 0 |
| B | 0 | 102 | 0 |
| C | 0 | 102 | 0 |
| D | 0 | 102 | 0 |
| Mode M0 | |||
|---|---|---|---|
| Quadrant | BADHDUFLAG | Total packets | Discarded packets |
| A | 0 | 13136 | 1 |
| B | 0 | 16318 | 1 |
| C | 0 | 11082 | 1 |
| D | 0 | 13522 | 1 |
| Quadrant | Total seconds | Saturated seconds | Saturation percentage |
|---|---|---|---|
| A | 5095 | 55 | 1.079490% |
| B | 5096 | 322 | 6.318681% |
| C | 5096 | 5 | 0.098116% |
| D | 5096 | 117 | 2.295918% |
Noise dominated data is calculated using 1-second bins in cleaned event files. If a bin has >2000 counts, and if more than 50% of those come from <1% of pixels, then it is considered to be noise-dominated and hence unusable.
| Quadrant | # 1 sec bins | Bins with >0 counts | Bins with >2000 counts | High rate bins dominated by noise | Noise dominated (total time) | Noise dominated (detector-on time) | Marked lightcurve |
|---|---|---|---|---|---|---|---|
| A | 7158 | 5096 | 29 | 29 | 0.41% | 0.57% | 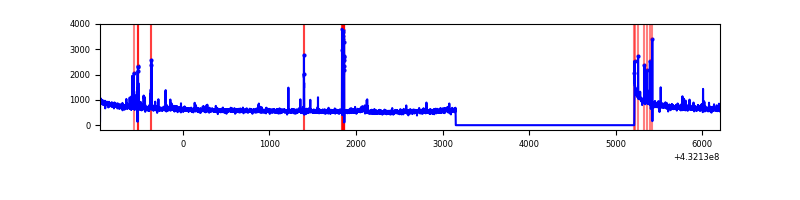 |
| B | 7159 | 5097 | 160 | 160 | 2.23% | 3.14% | 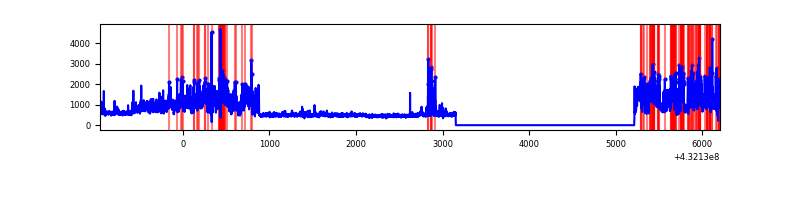 |
| C | 7159 | 5097 | 3 | 3 | 0.04% | 0.06% |  |
| D | 7159 | 5097 | 103 | 103 | 1.44% | 2.02% | 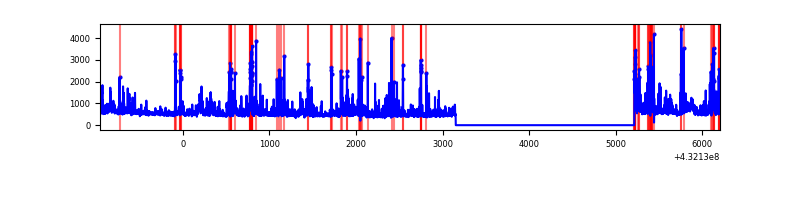 |
Top three noisy pixels from each quadrant. If the there are fewer than three noisy pixels in the level2.evt file, extra rows are filled as -1
| Pixel properties | Quadrant properties | ||||||
|---|---|---|---|---|---|---|---|
| Quadrant | DetID | PixID | Counts | Sigma | Mean | Median | Sigma |
| A | 10 | 83 | 545620 | 3669.75 | 671 | 662 | 148.5 |
| A | 15 | 237 | 111097 | 743.67 | 671 | 662 | 148.5 |
| A | 7 | 3 | 29606 | 194.91 | 671 | 662 | 148.5 |
| B | 0 | 186 | 1236775 | 9166.44 | 648 | 635 | 134.9 |
| B | 4 | 171 | 441257 | 3267.38 | 648 | 635 | 134.9 |
| B | 3 | 112 | 56941 | 417.53 | 648 | 635 | 134.9 |
| C | 15 | 214 | 209605 | 1288.3 | 642 | 648 | 162.2 |
| C | 0 | 239 | 24808 | 148.96 | 642 | 648 | 162.2 |
| C | 13 | 61 | 4294 | 22.48 | 642 | 648 | 162.2 |
| D | 1 | 52 | 448807 | 2664.96 | 638 | 618 | 168.2 |
| D | 1 | 47 | 125002 | 739.59 | 638 | 618 | 168.2 |
| D | 13 | 249 | 106336 | 628.6 | 638 | 618 | 168.2 |
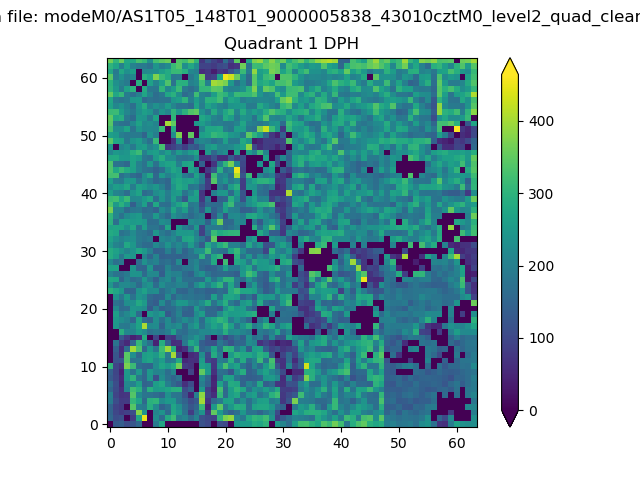
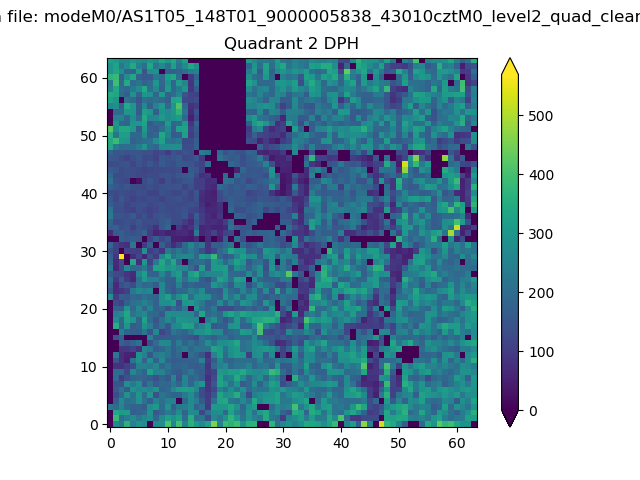
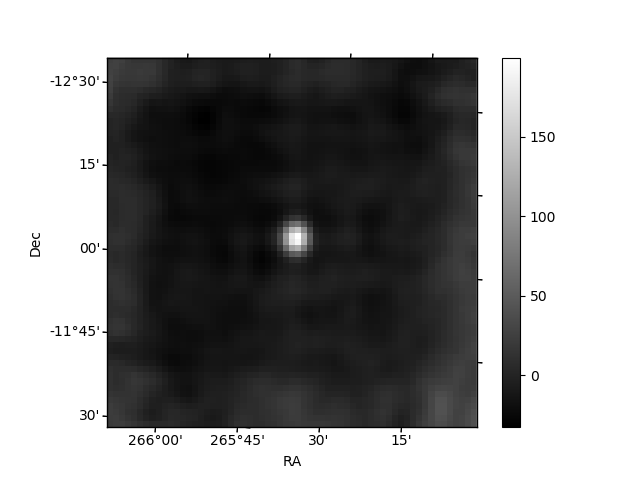
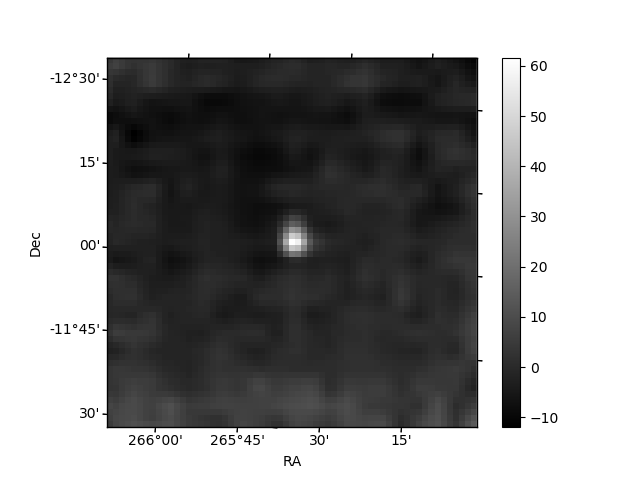
Histogram calculated using DETX and DETY for each event in the final _common_clean file
| Quadrant A | 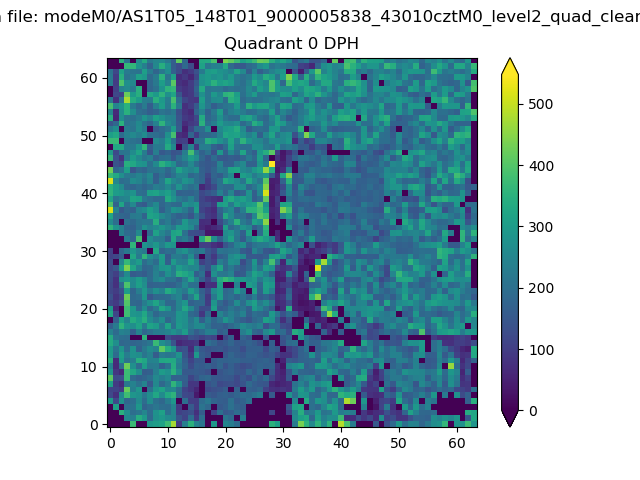 |
 |
Quadrant B |
|---|---|---|---|
| Quadrant D | 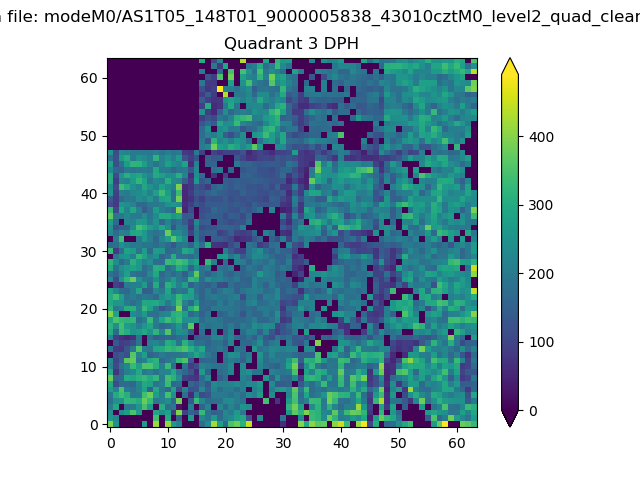 |
 |
Quadrant C |
| Plot type | Count rate plots | Images |
|---|---|---|
| Comparison with Poisson distribution Blue bars denote a histogram of data divided into 1 sec bins. Red curve is a Poisson curve with rate = median count rate of data. |
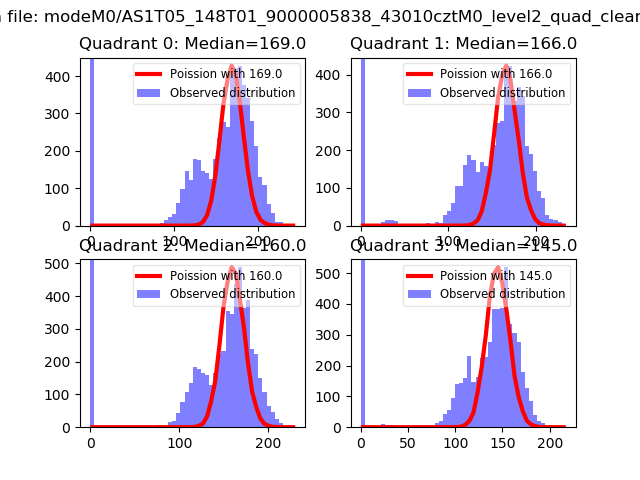 |
 |
| Quadrant-wise count rates Data is divided into 100 sec bins |
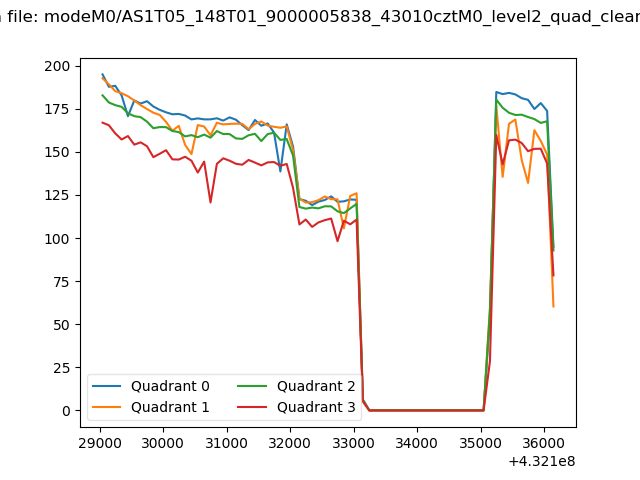 |
|
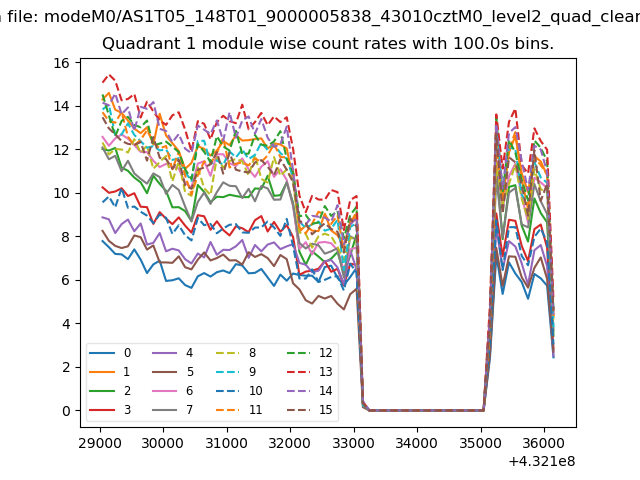
| Module-wise count rates for Quadrant A Data is divided into 100 sec bins |
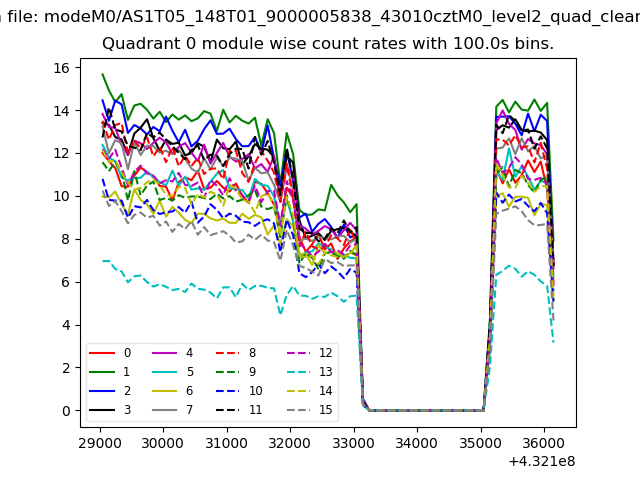 |
 |
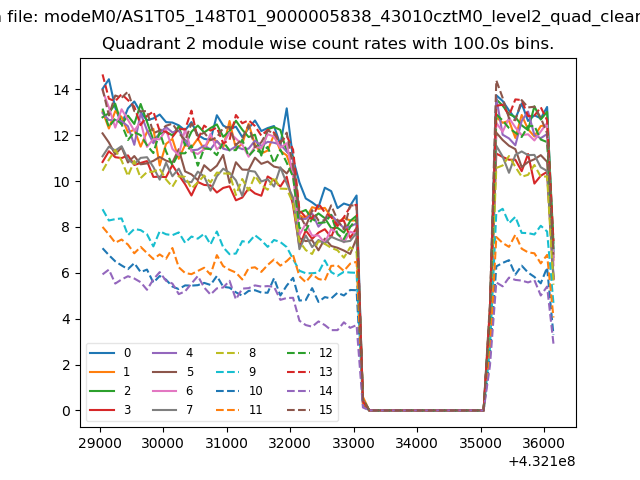
| Module-wise count rates for Quadrant B Data is divided into 100 sec bins |
 |
 |
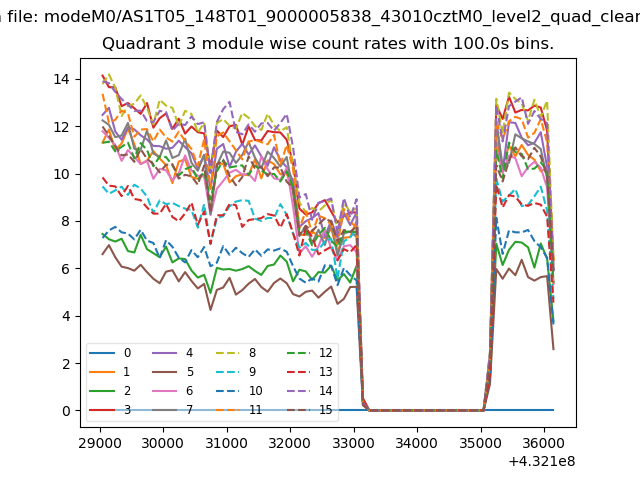
| Module-wise count rates for Quadrant C Data is divided into 100 sec bins |
 |
 |
| Module-wise count rates for Quadrant D Data is divided into 100 sec bins |
 |
 |
| Parameter | Plot |
|---|---|
| CZT HV Monitor | 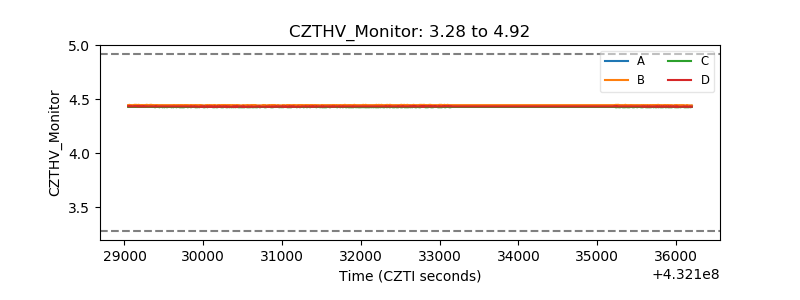 |
| D_VDD | 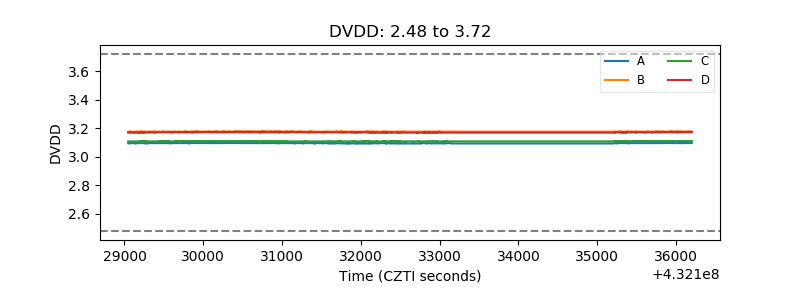 |
| Temperature 1 | 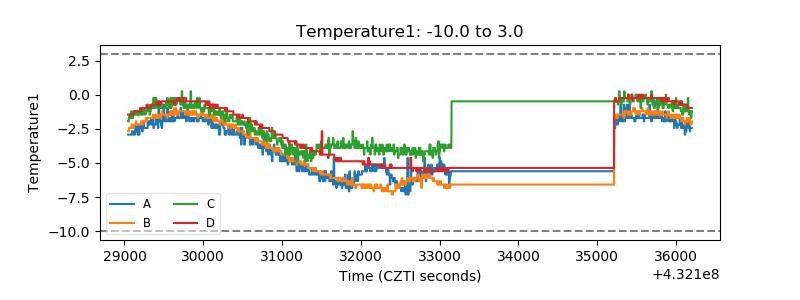 |
| Veto HV Monitor |  |
| Veto LLD | 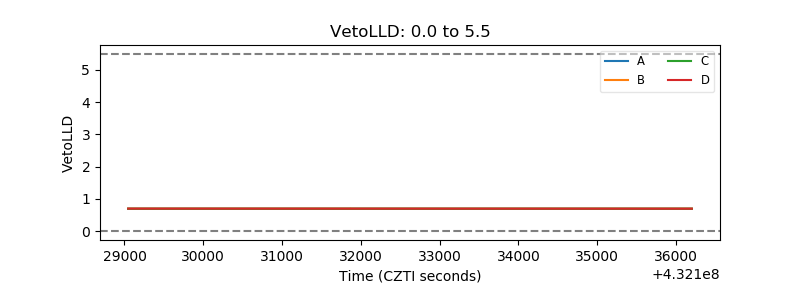 |
| Alpha Counter | 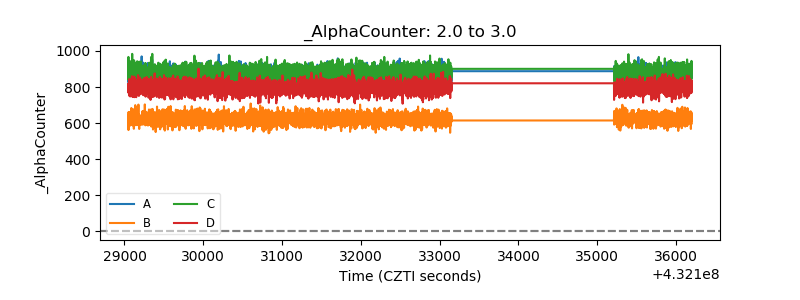 |
| _CPM_Rate |  |
| CZT Counter | 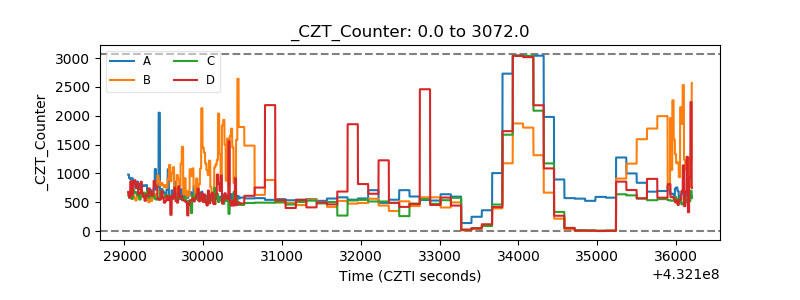 |
| +2.5 Volts monitor |  |
| +5 Volts monitor | 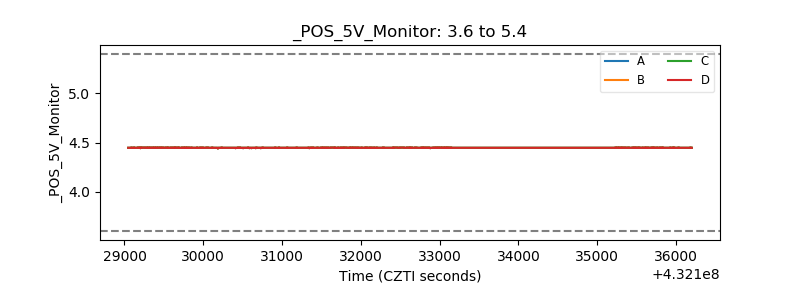 |
| _ROLL_ROT | 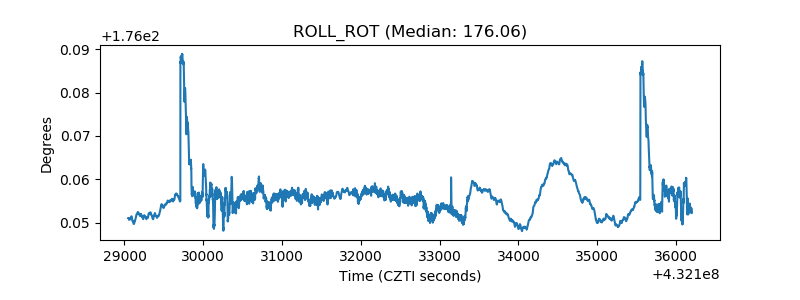 |
| _Roll_DEC | 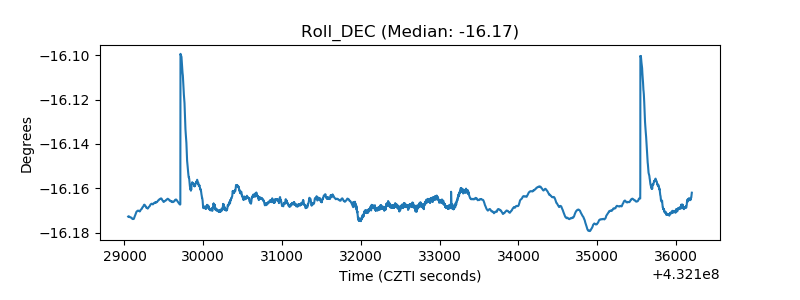 |
| _Roll_RA | 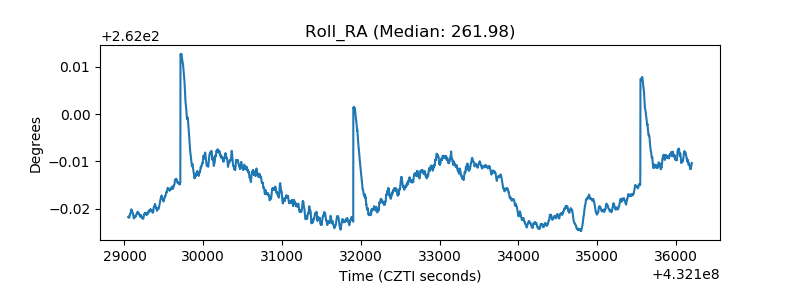 |
| Veto Counter | 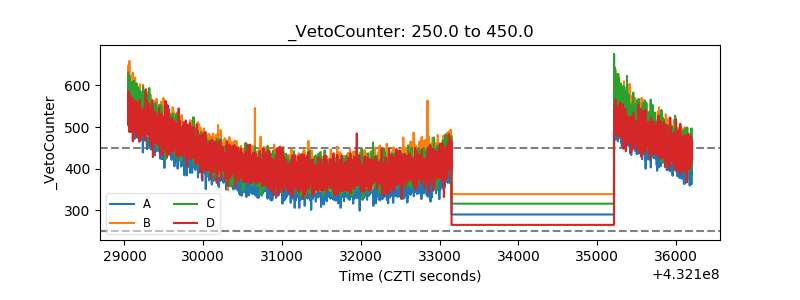 |