| Param | Original file | Final file |
|---|---|---|
| Filename | modeM0/AS1T05_148T01_9000005838_43011cztM0_level2.fits | modeM0/AS1T05_148T01_9000005838_43011cztM0_level2_quad_clean.evt |
| Size (bytes) | 439,908,480 | 108,501,120 |
| Size | 419.5 MB | 103.5 MB |
| Events in quadrant A | 3,208,004 | 796,784 |
| Events in quadrant B | 5,047,428 | 745,265 |
| Events in quadrant C | 2,644,126 | 761,627 |
| Events in quadrant D | 4,986,976 | 623,664 |
| Mode M9 | |||
|---|---|---|---|
| Quadrant | BADHDUFLAG | Total packets | Discarded packets |
| A | 0 | 24 | 0 |
| B | 0 | 25 | 0 |
| C | 0 | 25 | 0 |
| D | 0 | 25 | 0 |
| Mode SS | |||
|---|---|---|---|
| Quadrant | BADHDUFLAG | Total packets | Discarded packets |
| A | 0 | 104 | 0 |
| B | 0 | 104 | 0 |
| C | 0 | 104 | 0 |
| D | 0 | 104 | 0 |
| Mode M0 | |||
|---|---|---|---|
| Quadrant | BADHDUFLAG | Total packets | Discarded packets |
| A | 0 | 12810 | 2 |
| B | 0 | 18431 | 2 |
| C | 0 | 10748 | 2 |
| D | 0 | 18309 | 2 |
| Quadrant | Total seconds | Saturated seconds | Saturation percentage |
|---|---|---|---|
| A | 5119 | 32 | 0.625122% |
| B | 5119 | 500 | 9.767533% |
| C | 5119 | 6 | 0.117210% |
| D | 5119 | 615 | 12.014065% |
Noise dominated data is calculated using 1-second bins in cleaned event files. If a bin has >2000 counts, and if more than 50% of those come from <1% of pixels, then it is considered to be noise-dominated and hence unusable.
| Quadrant | # 1 sec bins | Bins with >0 counts | Bins with >2000 counts | High rate bins dominated by noise | Noise dominated (total time) | Noise dominated (detector-on time) | Marked lightcurve |
|---|---|---|---|---|---|---|---|
| A | 7272 | 5120 | 17 | 17 | 0.23% | 0.33% | 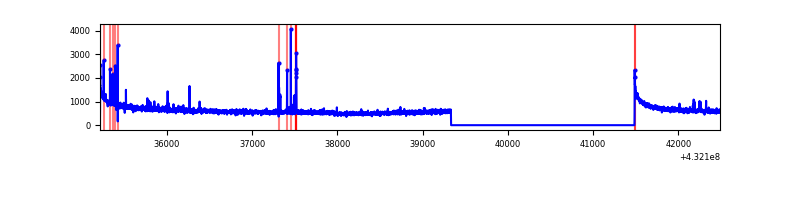 |
| B | 7272 | 5120 | 364 | 364 | 5.01% | 7.11% | 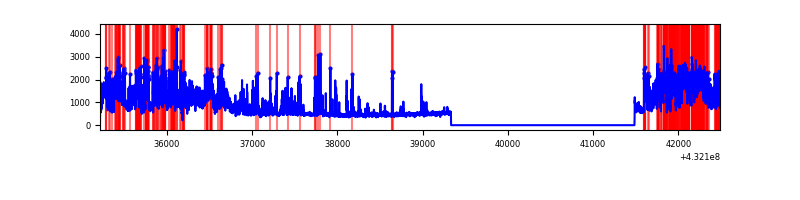 |
| C | 7272 | 5120 | 1 | 1 | 0.01% | 0.02% | 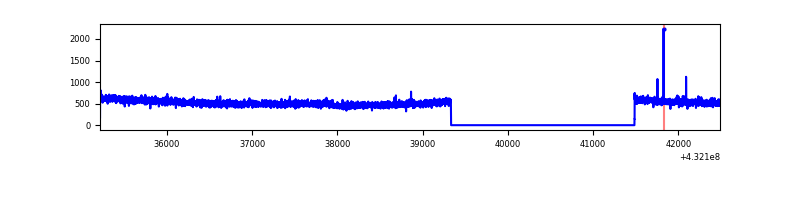 |
| D | 7272 | 5120 | 570 | 570 | 7.84% | 11.13% | 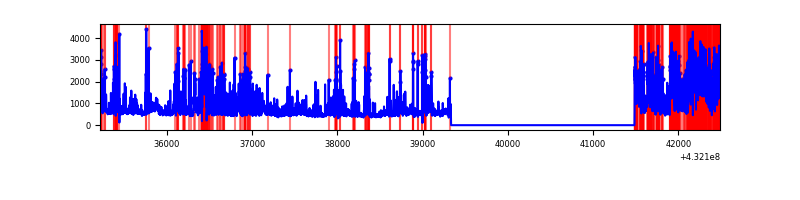 |
Top three noisy pixels from each quadrant. If the there are fewer than three noisy pixels in the level2.evt file, extra rows are filled as -1
| Pixel properties | Quadrant properties | ||||||
|---|---|---|---|---|---|---|---|
| Quadrant | DetID | PixID | Counts | Sigma | Mean | Median | Sigma |
| A | 10 | 83 | 606394 | 4222.21 | 650 | 642 | 143.5 |
| A | 15 | 237 | 56916 | 392.24 | 650 | 642 | 143.5 |
| A | 7 | 3 | 21830 | 147.68 | 650 | 642 | 143.5 |
| B | 0 | 186 | 1786545 | 13832.63 | 625 | 614 | 129.1 |
| B | 4 | 171 | 666571 | 5158.05 | 625 | 614 | 129.1 |
| B | 3 | 112 | 83574 | 642.55 | 625 | 614 | 129.1 |
| C | 15 | 214 | 210808 | 1356.49 | 622 | 629 | 154.9 |
| C | 7 | 220 | 5763 | 33.13 | 622 | 629 | 154.9 |
| C | 13 | 61 | 4316 | 23.8 | 622 | 629 | 154.9 |
| D | 12 | 233 | 1045317 | 6684.92 | 594 | 578 | 156.3 |
| D | 1 | 52 | 902344 | 5770.09 | 594 | 578 | 156.3 |
| D | 13 | 249 | 173129 | 1104.09 | 594 | 578 | 156.3 |
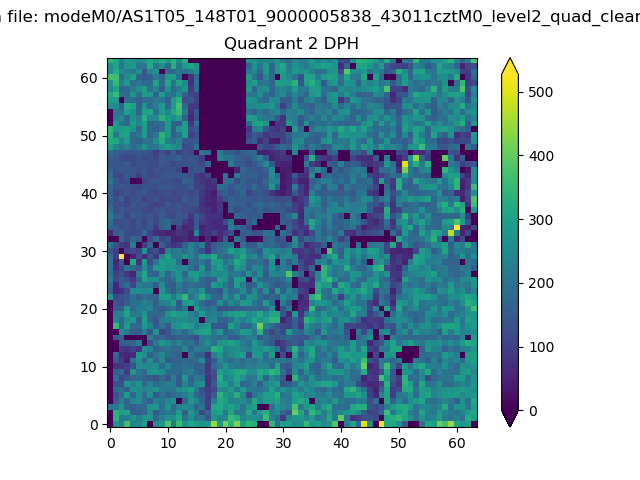
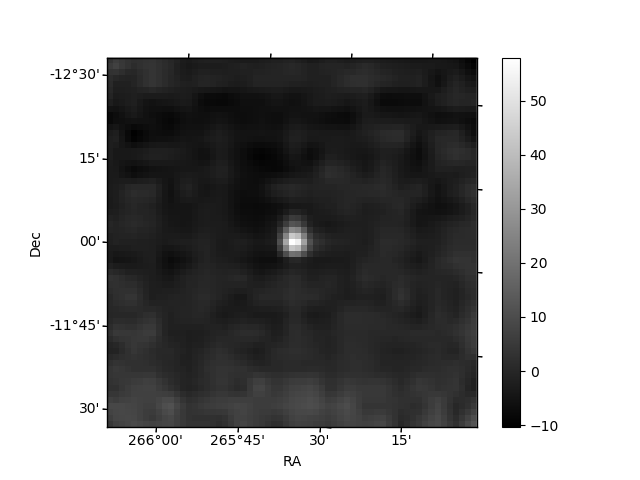
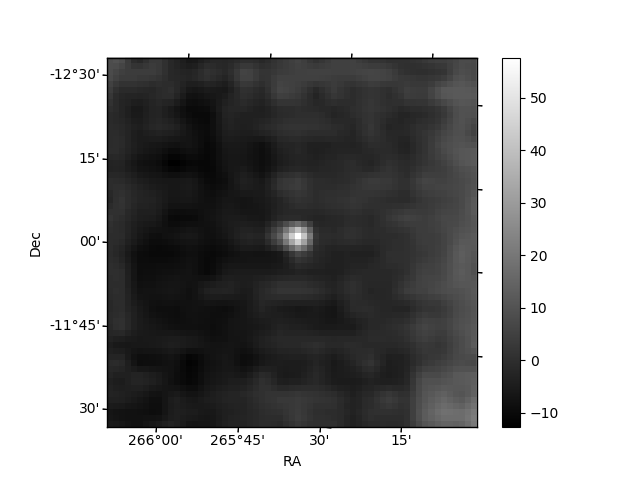
Histogram calculated using DETX and DETY for each event in the final _common_clean file
| Quadrant A | 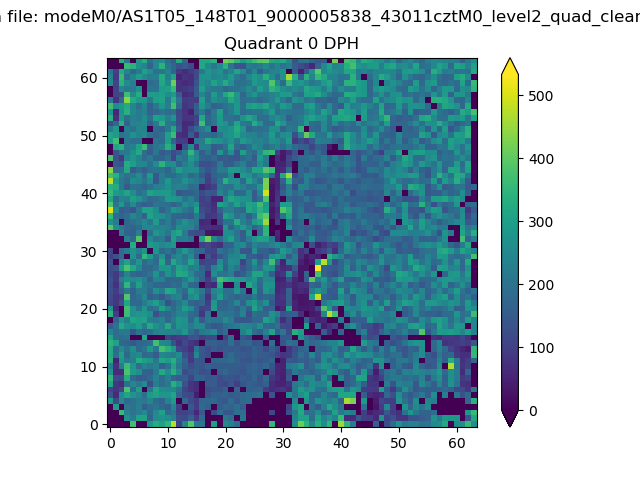 |
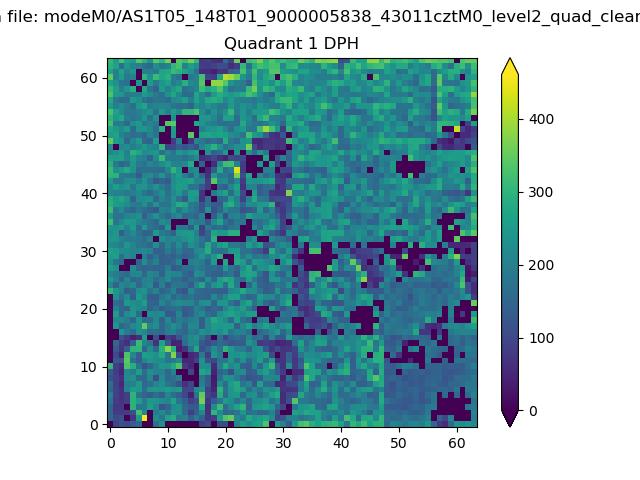 |
Quadrant B |
|---|---|---|---|
| Quadrant D | 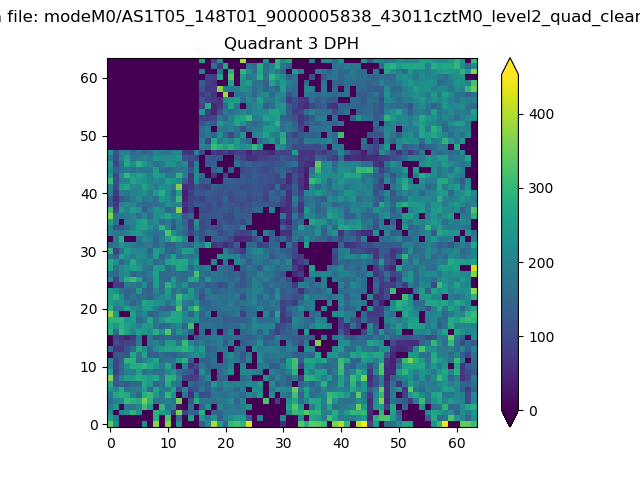 |
 |
Quadrant C |
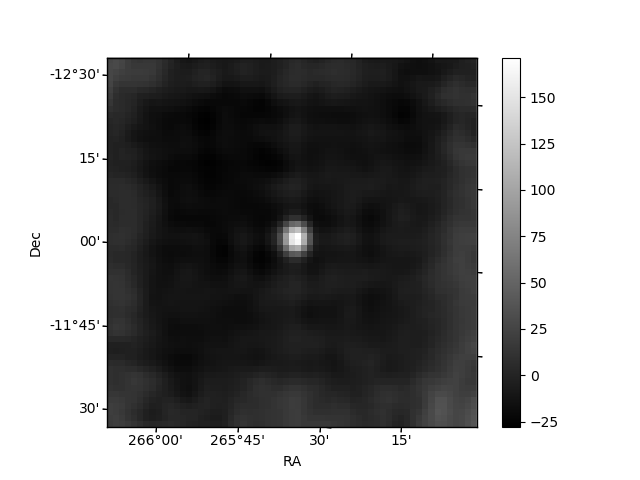
| Plot type | Count rate plots | Images |
|---|---|---|
| Comparison with Poisson distribution Blue bars denote a histogram of data divided into 1 sec bins. Red curve is a Poisson curve with rate = median count rate of data. |
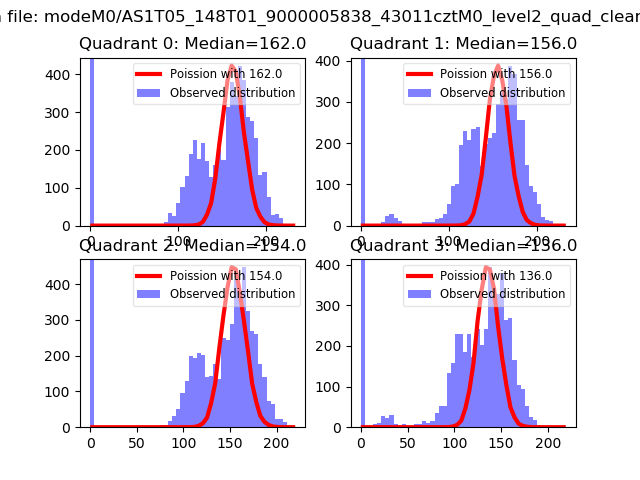 |
 |
| Quadrant-wise count rates Data is divided into 100 sec bins |
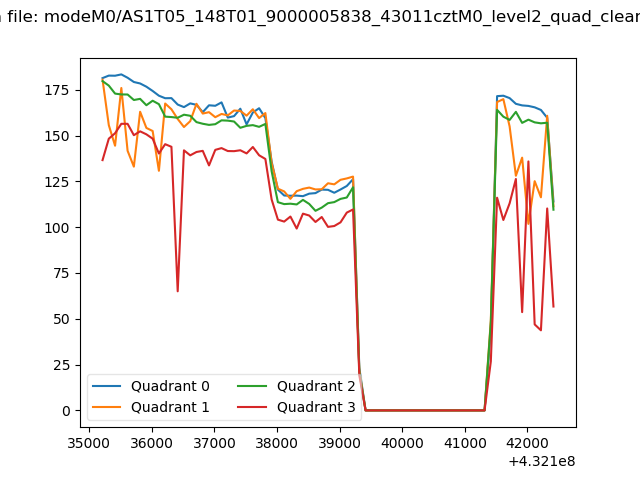 |
|
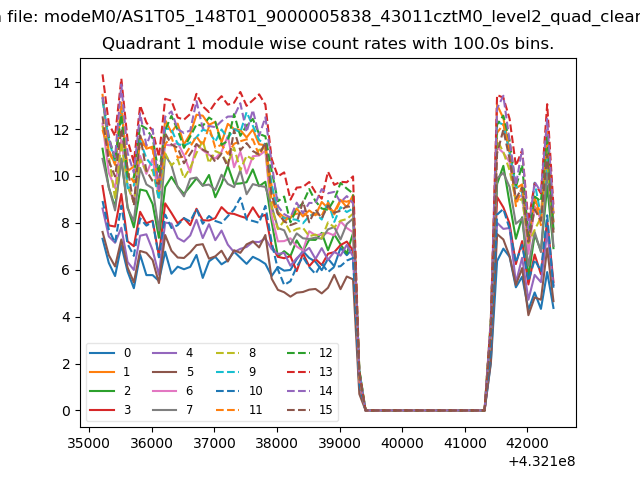
| Module-wise count rates for Quadrant A Data is divided into 100 sec bins |
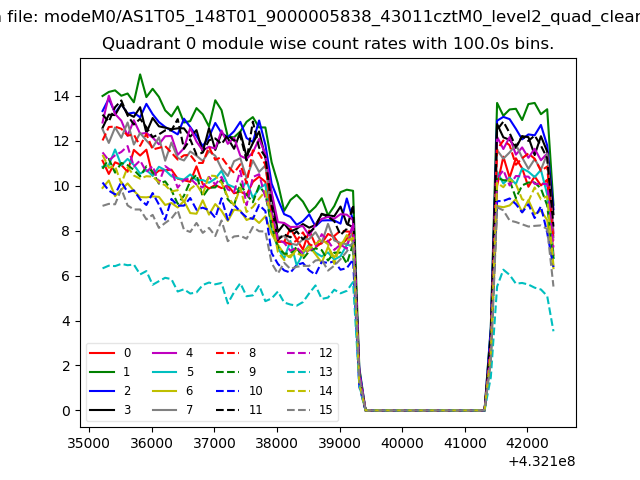 |
 |
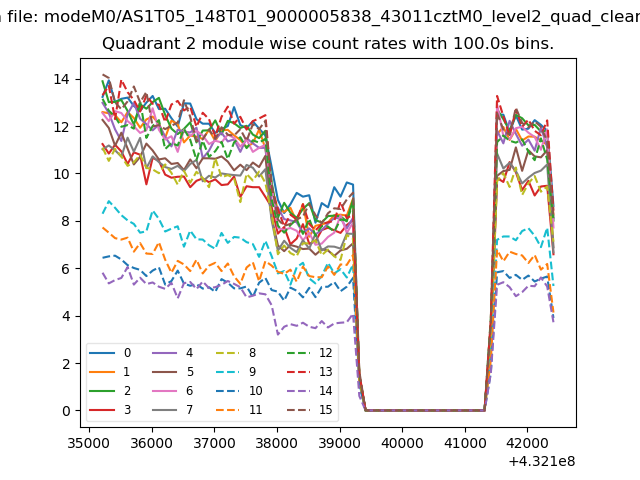
| Module-wise count rates for Quadrant B Data is divided into 100 sec bins |
 |
 |
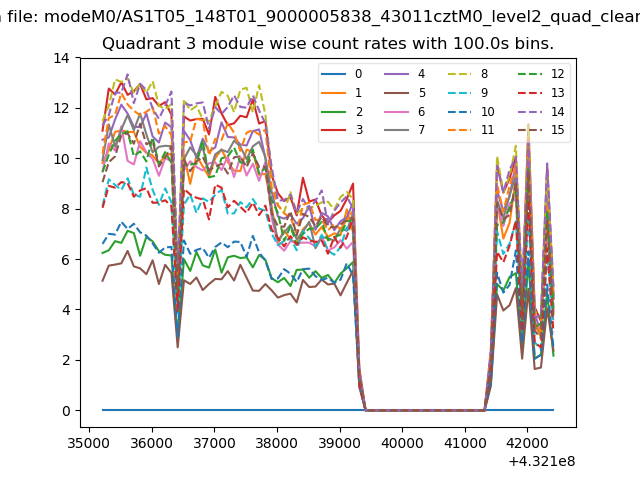
| Module-wise count rates for Quadrant C Data is divided into 100 sec bins |
 |
 |
| Module-wise count rates for Quadrant D Data is divided into 100 sec bins |
 |
 |
| Parameter | Plot |
|---|---|
| CZT HV Monitor | 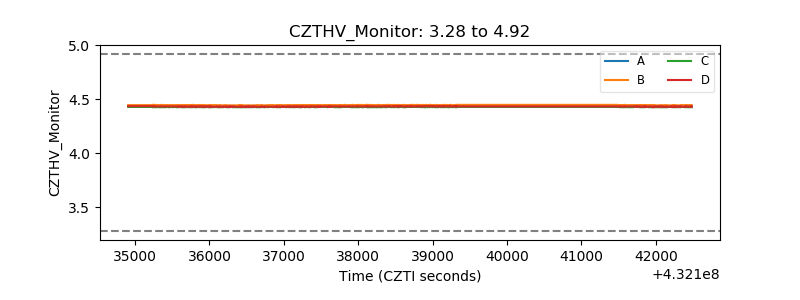 |
| D_VDD | 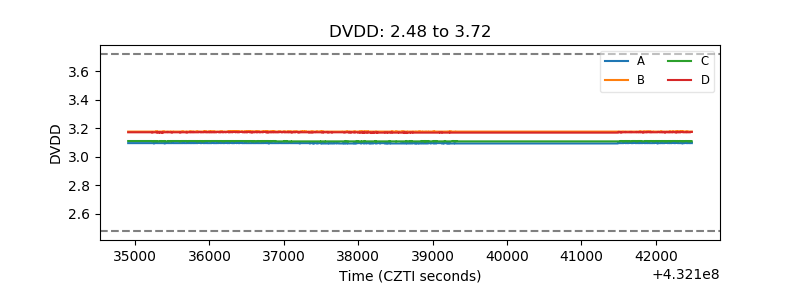 |
| Temperature 1 | 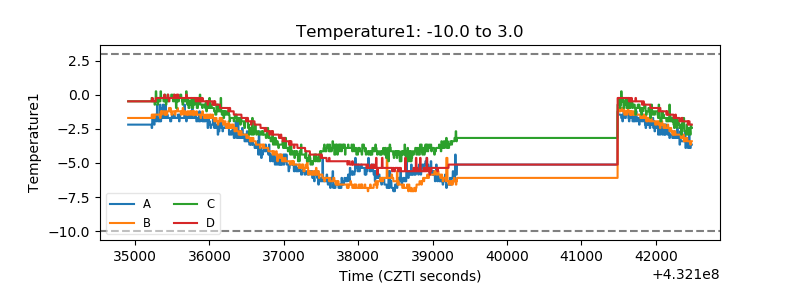 |
| Veto HV Monitor | 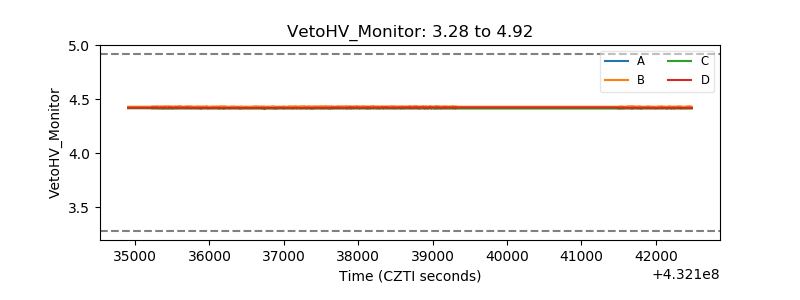 |
| Veto LLD | 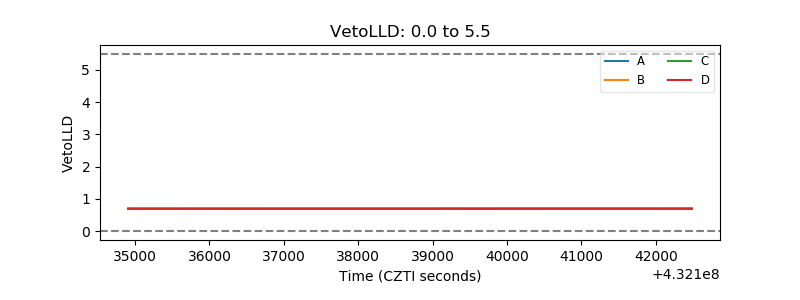 |
| Alpha Counter | 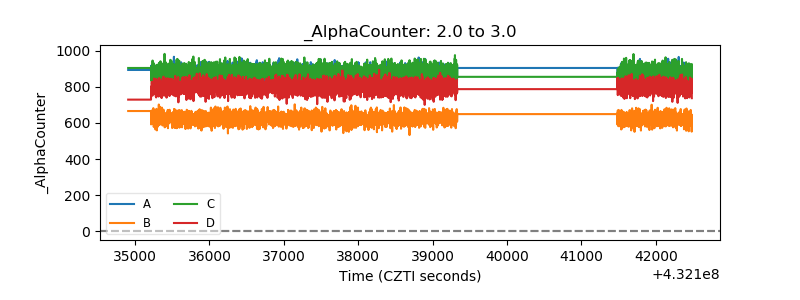 |
| _CPM_Rate |  |
| CZT Counter | 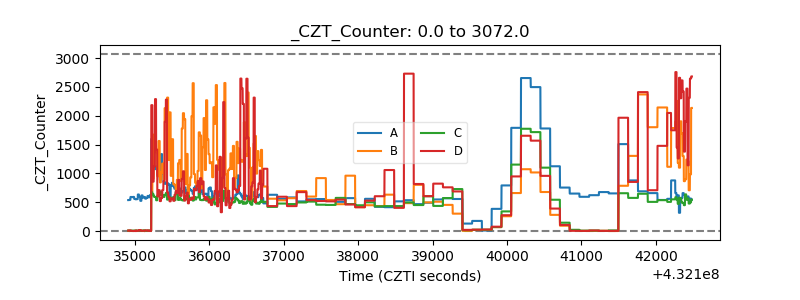 |
| +2.5 Volts monitor |  |
| +5 Volts monitor | 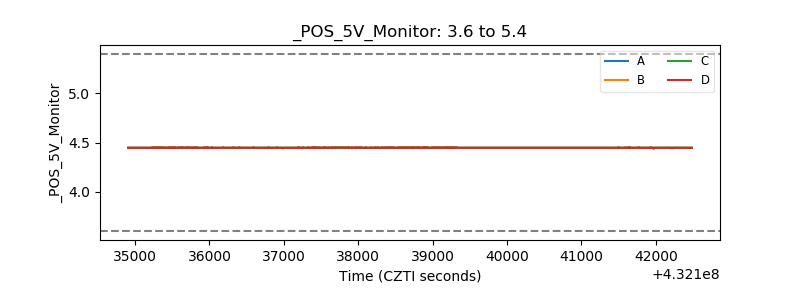 |
| _ROLL_ROT | 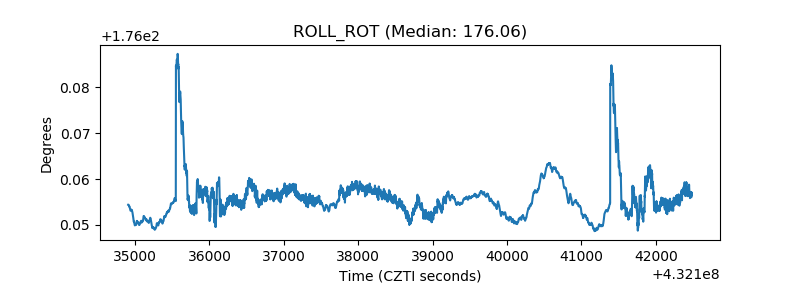 |
| _Roll_DEC | 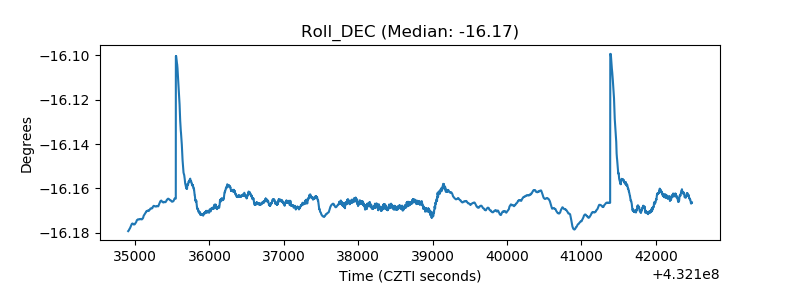 |
| _Roll_RA | 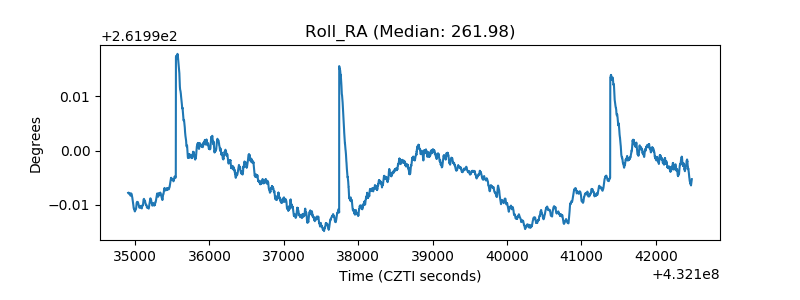 |
| Veto Counter | 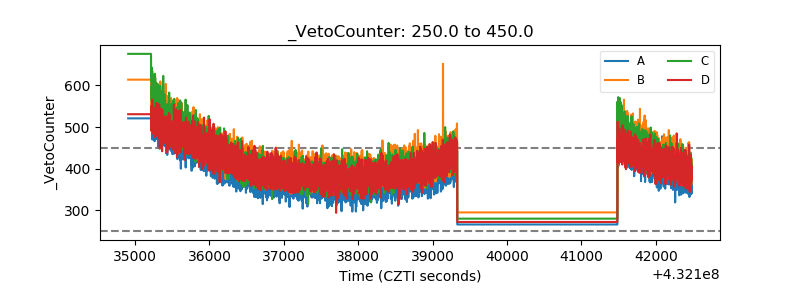 |