| Param | Original file | Final file |
|---|---|---|
| Filename | modeM0/AS1T05_148T01_9000005838_43012cztM0_level2.fits | modeM0/AS1T05_148T01_9000005838_43012cztM0_level2_quad_clean.evt |
| Size (bytes) | 406,275,840 | 96,716,160 |
| Size | 387.5 MB | 92.2 MB |
| Events in quadrant A | 2,929,269 | 709,228 |
| Events in quadrant B | 4,548,250 | 659,714 |
| Events in quadrant C | 2,457,438 | 679,081 |
| Events in quadrant D | 4,721,438 | 535,337 |
| Mode M9 | |||
|---|---|---|---|
| Quadrant | BADHDUFLAG | Total packets | Discarded packets |
| A | 0 | 21 | 0 |
| B | 0 | 21 | 0 |
| C | 0 | 21 | 0 |
| D | 0 | 21 | 0 |
| Mode SS | |||
|---|---|---|---|
| Quadrant | BADHDUFLAG | Total packets | Discarded packets |
| A | 0 | 102 | 0 |
| B | 0 | 102 | 0 |
| C | 0 | 102 | 0 |
| D | 0 | 102 | 0 |
| Mode M0 | |||
|---|---|---|---|
| Quadrant | BADHDUFLAG | Total packets | Discarded packets |
| A | 0 | 11744 | 2 |
| B | 0 | 16853 | 2 |
| C | 0 | 10077 | 2 |
| D | 0 | 17401 | 2 |
| Quadrant | Total seconds | Saturated seconds | Saturation percentage |
|---|---|---|---|
| A | 4919 | 24 | 0.487904% |
| B | 4920 | 514 | 10.447154% |
| C | 4920 | 5 | 0.101626% |
| D | 4920 | 700 | 14.227642% |
Noise dominated data is calculated using 1-second bins in cleaned event files. If a bin has >2000 counts, and if more than 50% of those come from <1% of pixels, then it is considered to be noise-dominated and hence unusable.
| Quadrant | # 1 sec bins | Bins with >0 counts | Bins with >2000 counts | High rate bins dominated by noise | Noise dominated (total time) | Noise dominated (detector-on time) | Marked lightcurve |
|---|---|---|---|---|---|---|---|
| A | 7043 | 4920 | 11 | 11 | 0.16% | 0.22% | 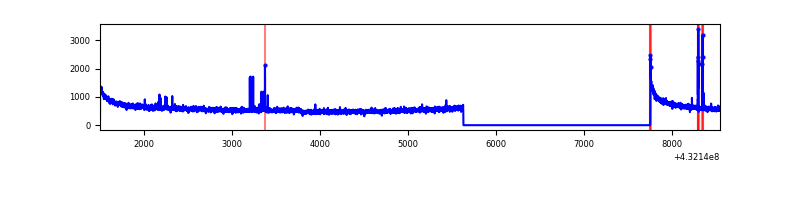 |
| B | 7044 | 4921 | 422 | 422 | 5.99% | 8.58% | 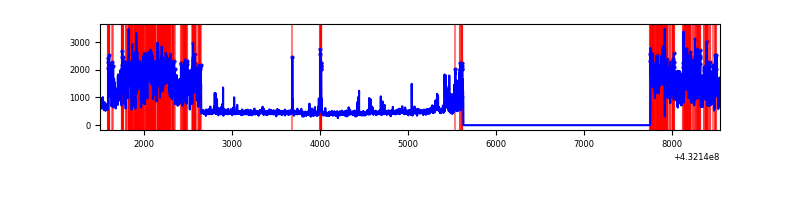 |
| C | 7044 | 4921 | 1 | 1 | 0.01% | 0.02% | 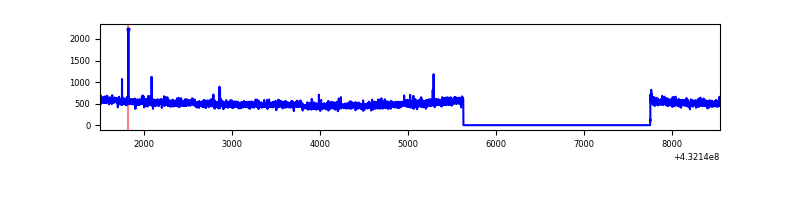 |
| D | 7044 | 4921 | 668 | 668 | 9.48% | 13.57% | 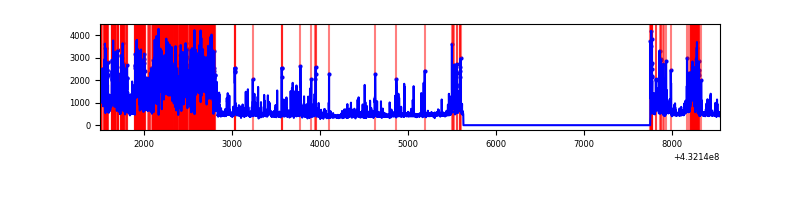 |
Top three noisy pixels from each quadrant. If the there are fewer than three noisy pixels in the level2.evt file, extra rows are filled as -1
| Pixel properties | Quadrant properties | ||||||
|---|---|---|---|---|---|---|---|
| Quadrant | DetID | PixID | Counts | Sigma | Mean | Median | Sigma |
| A | 10 | 83 | 564236 | 4358.62 | 594 | 583 | 129.3 |
| A | 15 | 237 | 61081 | 467.82 | 594 | 583 | 129.3 |
| A | 13 | 6 | 13621 | 100.82 | 594 | 583 | 129.3 |
| B | 0 | 186 | 1730001 | 14583.82 | 577 | 566 | 118.6 |
| B | 4 | 171 | 370248 | 3117.42 | 577 | 566 | 118.6 |
| B | 4 | 81 | 95323 | 799.06 | 577 | 566 | 118.6 |
| C | 15 | 214 | 200243 | 1419.32 | 575 | 581 | 140.7 |
| C | 7 | 220 | 9361 | 62.41 | 575 | 581 | 140.7 |
| C | 1 | 241 | 4145 | 25.34 | 575 | 581 | 140.7 |
| D | 12 | 233 | 1648834 | 11845.16 | 538 | 524 | 139.2 |
| D | 1 | 52 | 362041 | 2597.95 | 538 | 524 | 139.2 |
| D | 10 | 118 | 244611 | 1754.07 | 538 | 524 | 139.2 |
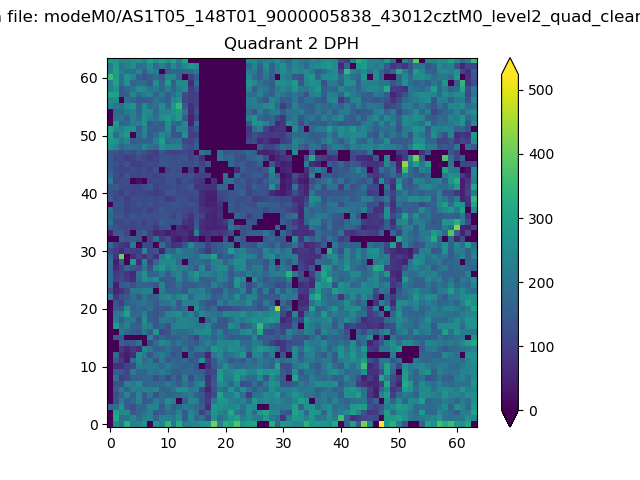
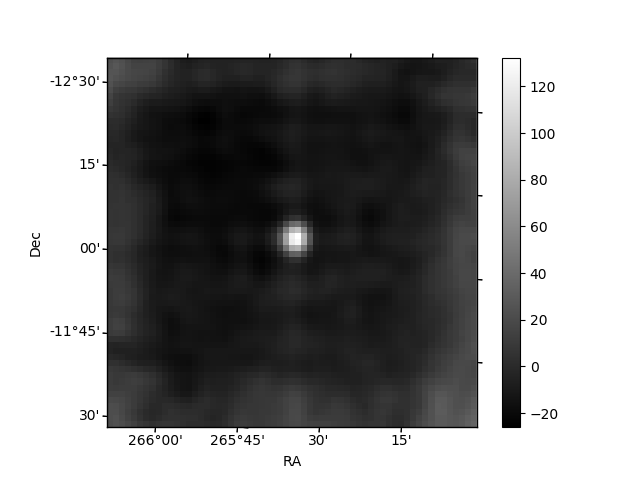
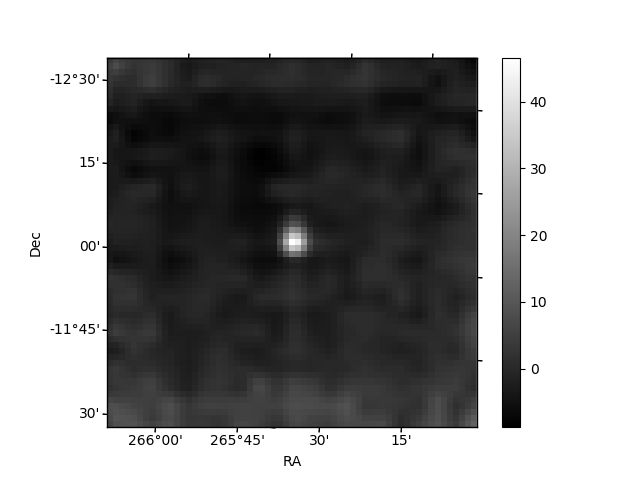
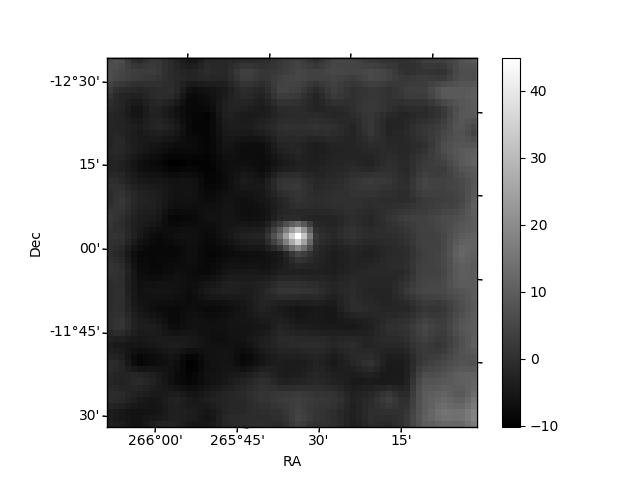
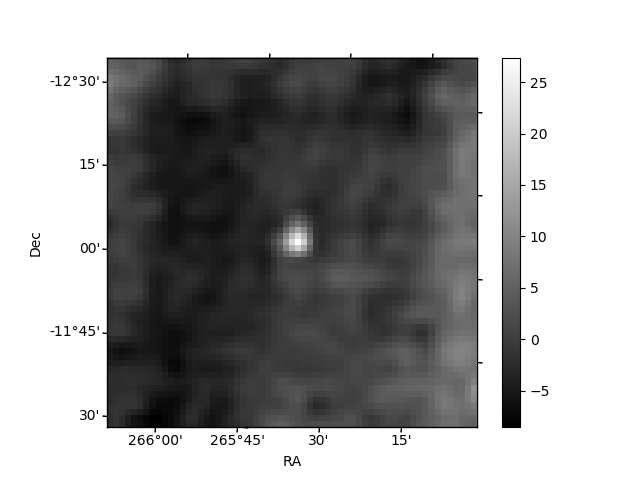
Histogram calculated using DETX and DETY for each event in the final _common_clean file
| Quadrant A | 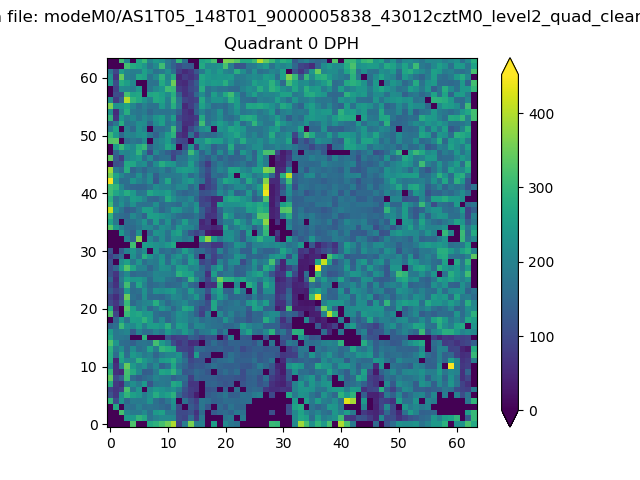 |
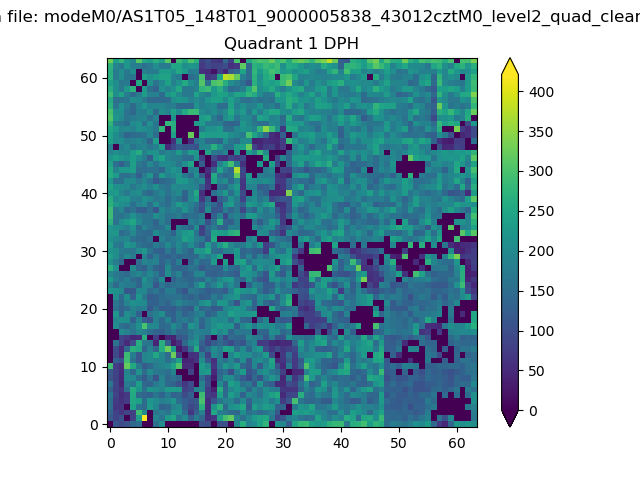 |
Quadrant B |
|---|---|---|---|
| Quadrant D | 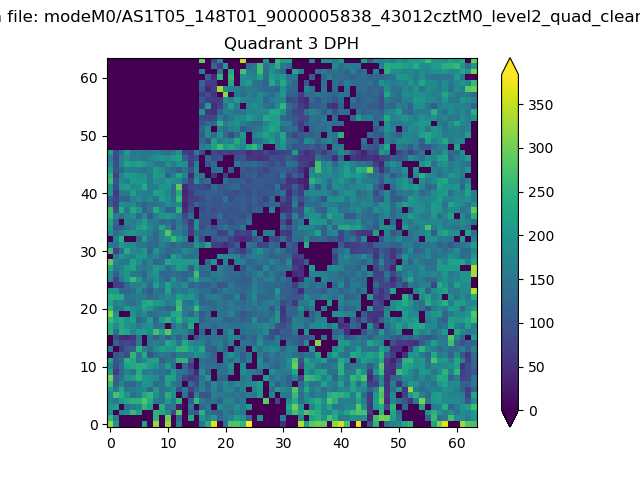 |
 |
Quadrant C |
| Plot type | Count rate plots | Images |
|---|---|---|
| Comparison with Poisson distribution Blue bars denote a histogram of data divided into 1 sec bins. Red curve is a Poisson curve with rate = median count rate of data. |
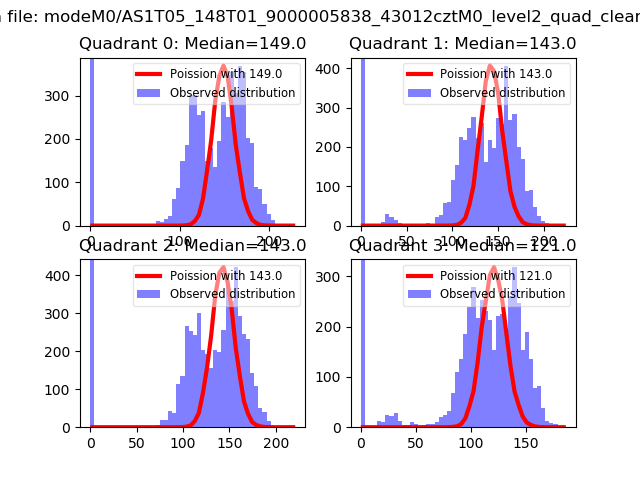 |
 |
| Quadrant-wise count rates Data is divided into 100 sec bins |
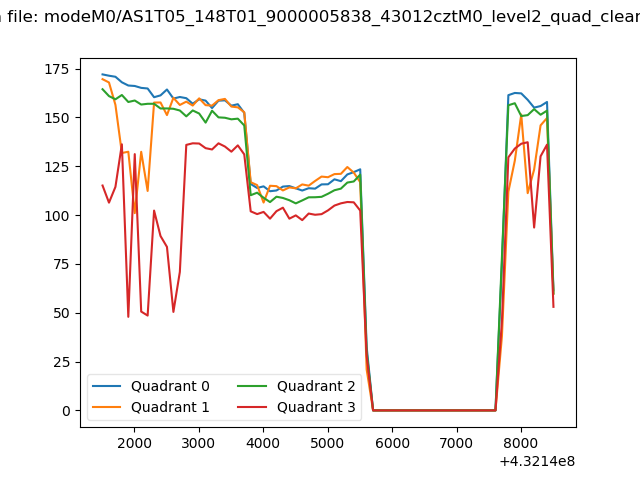 |
|
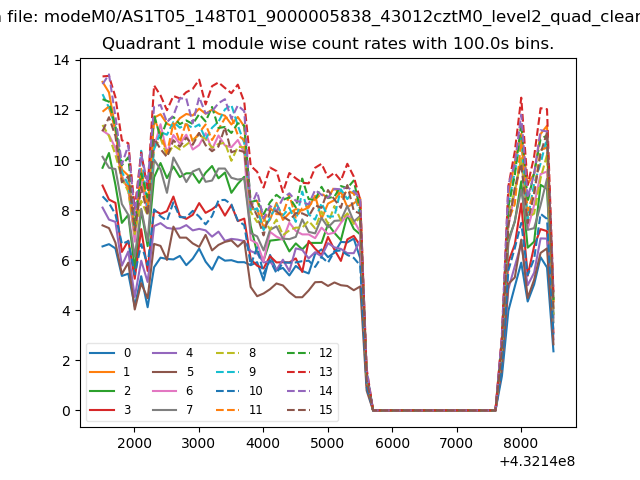
| Module-wise count rates for Quadrant A Data is divided into 100 sec bins |
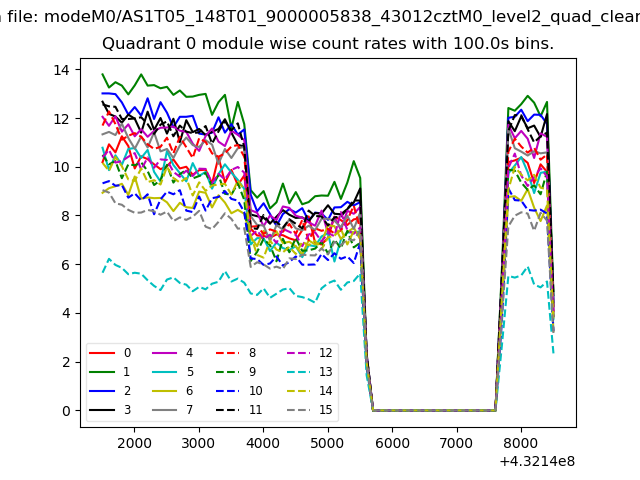 |
 |
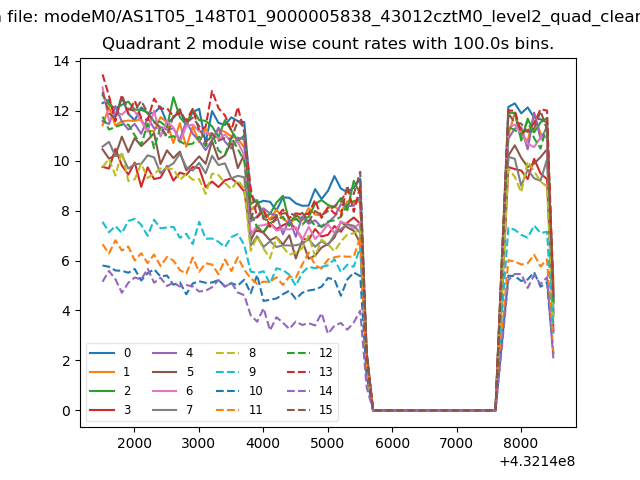
| Module-wise count rates for Quadrant B Data is divided into 100 sec bins |
 |
 |
| Module-wise count rates for Quadrant C Data is divided into 100 sec bins |
 |
 |
| Module-wise count rates for Quadrant D Data is divided into 100 sec bins |
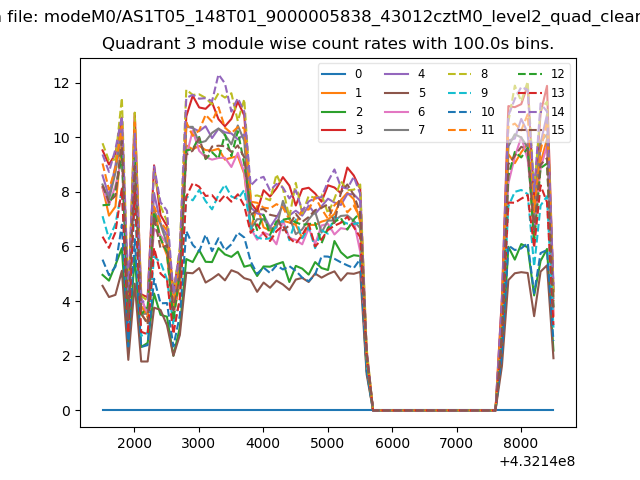 |
 |
| Parameter | Plot |
|---|---|
| CZT HV Monitor | 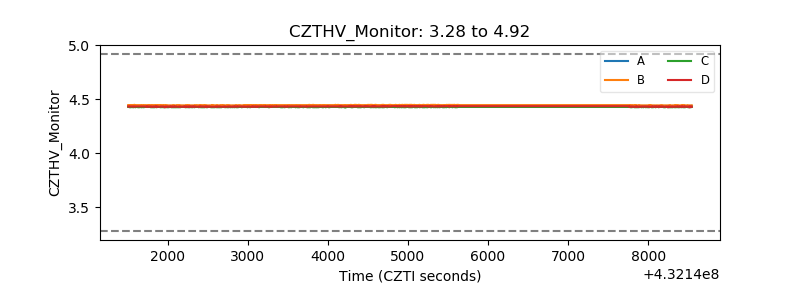 |
| D_VDD | 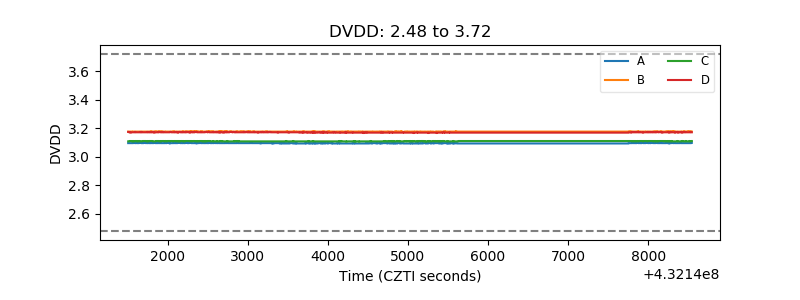 |
| Temperature 1 | 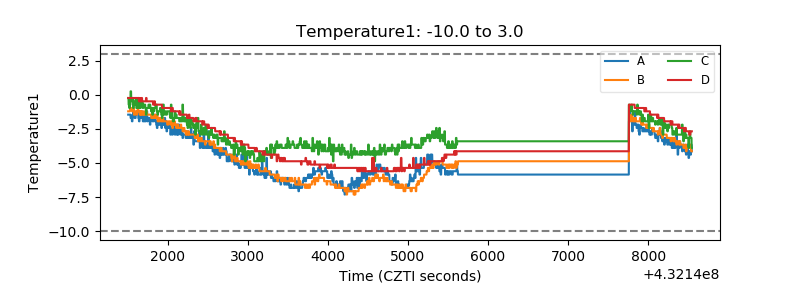 |
| Veto HV Monitor | 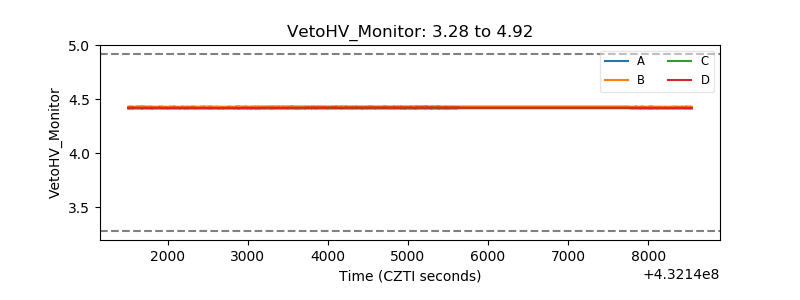 |
| Veto LLD | 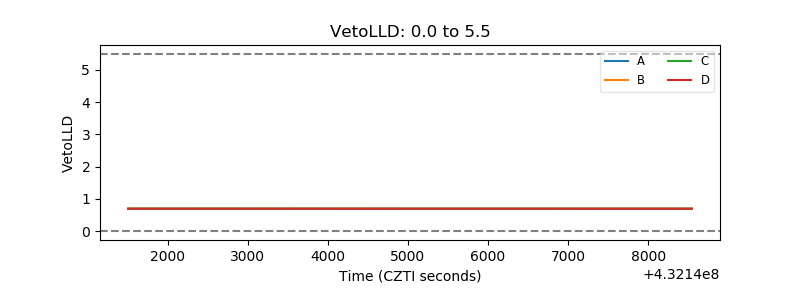 |
| Alpha Counter | 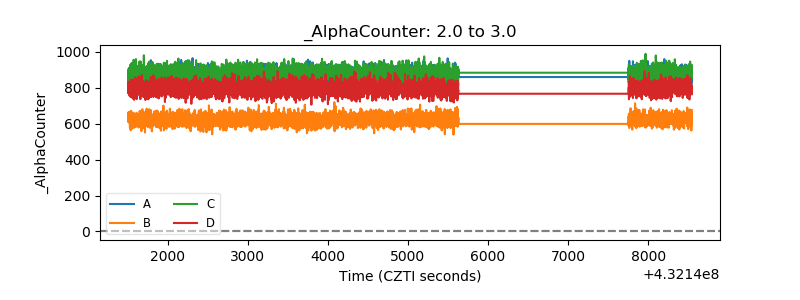 |
| _CPM_Rate | 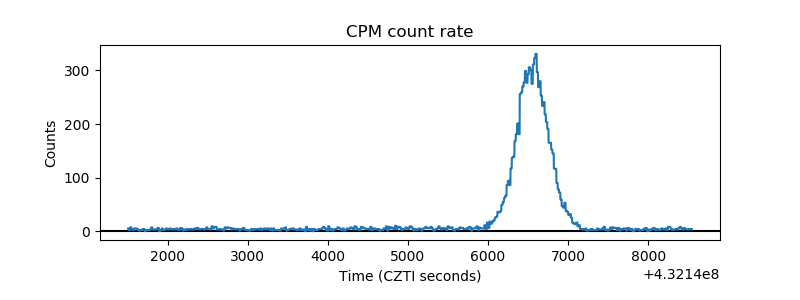 |
| CZT Counter | 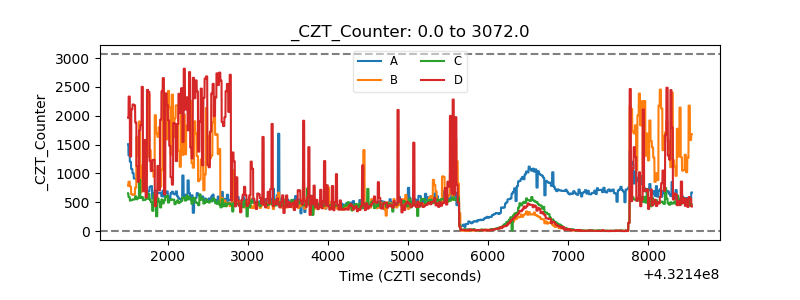 |
| +2.5 Volts monitor | 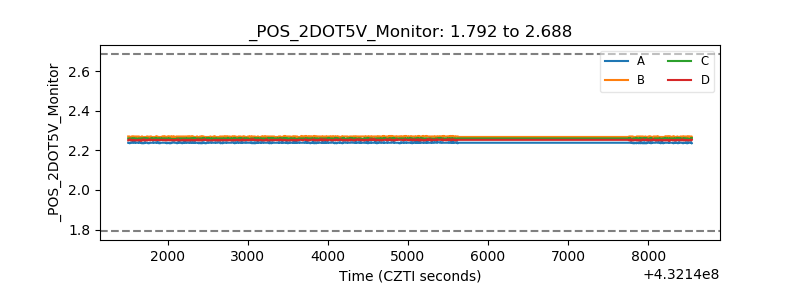 |
| +5 Volts monitor | 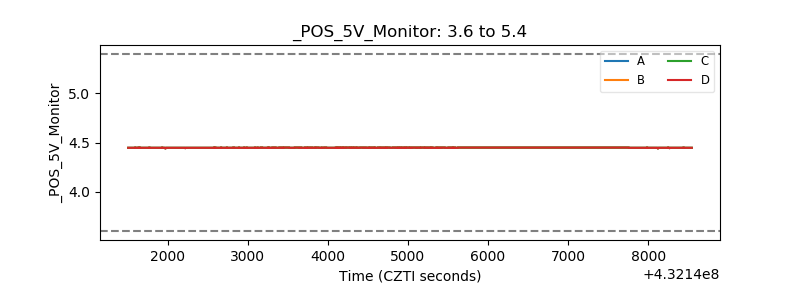 |
| _ROLL_ROT | 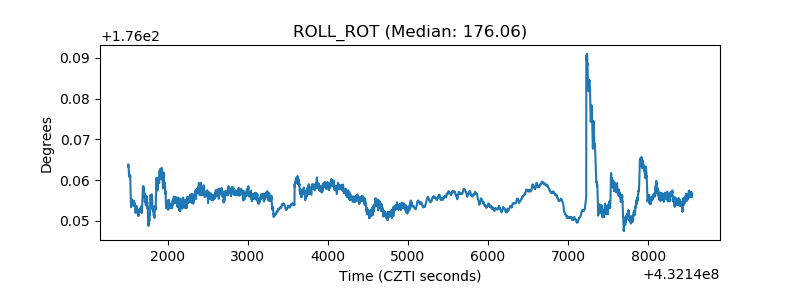 |
| _Roll_DEC | 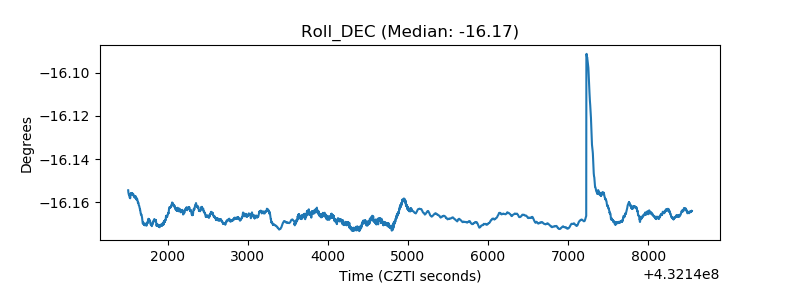 |
| _Roll_RA | 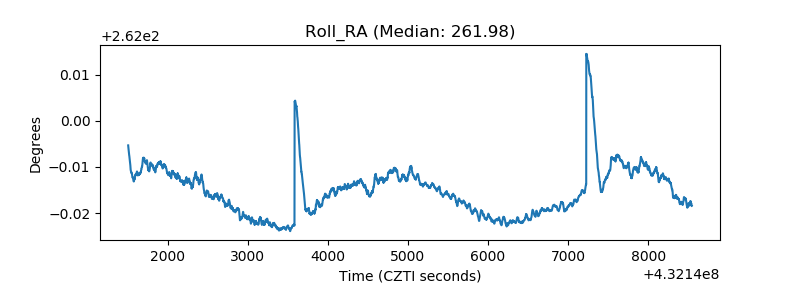 |
| Veto Counter | 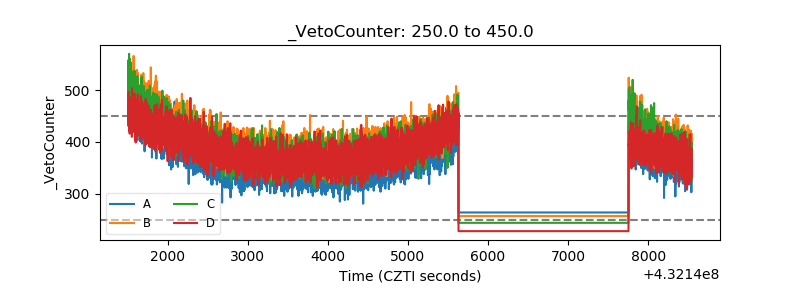 |